The India ready-to-mix food market is estimated to be valued at USD 580.0 million in 2025 and is projected to reach USD 2,305.9 million by 2035, registering a CAGR of 14.8% over the forecast period. The market is projected to add an absolute dollar opportunity of USD 1,730.8 million over the forecast period. This reflects a 3.98 times growth at a compound annual growth rate of 14.8%. The market's growth will be driven by changing consumer lifestyles, increasing urbanization, the convenience factor of quick-preparation meals, and the rising penetration of packaged food products across India’s tier-II and tier-III cities.
By 2030, the market is likely to reach approximately USD 1,156.5 million, accounting for USD 570.6 million in incremental value over the first half of the decade. The remaining USD 1,160.2 million is expected during the second half, indicating a back-loaded yet sustained growth pattern. Over the forecast period, the market is projected to add an absolute dollar opportunity of USD 1,725.9 million. Product innovation across traditional Indian recipes, fusion flavors, and health-oriented variants (such as low-sodium or fortified mixes) is expected to gain momentum due to evolving consumer preferences and broader retail penetration.
Companies such as MTR Foods and ITC Ltd. are strengthening their competitive positions through investments in advanced packaging solutions, targeted marketing campaigns, and expansion into e-commerce platforms. Premium positioning strategies, regional flavor diversification, and smaller SKUs tailored for single households are expected to attract both urban millennials and working professionals. Market performance will be anchored in convenience-driven consumption, product quality assurance, and expanding modern trade distribution networks.
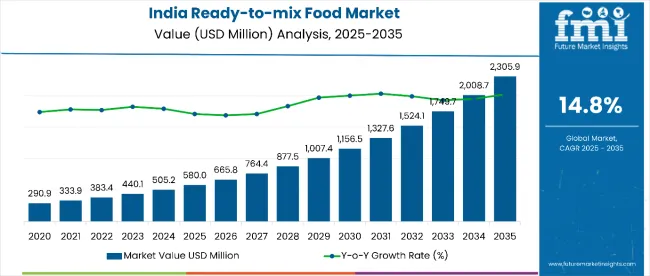
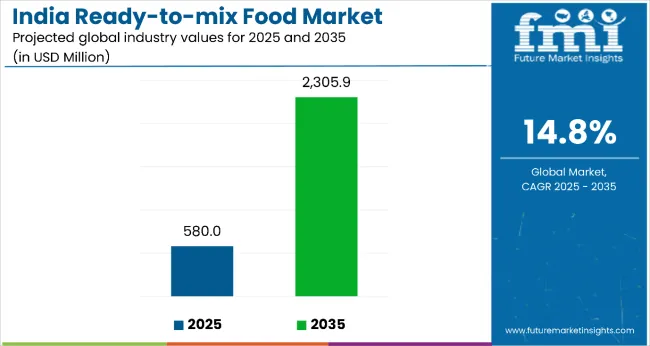
| Metric | Value |
|---|---|
| Estimated Value in (2025E) | USD 580.0 million |
| Forecast Value in (2035F) | USD 2,305.9 million |
| Forecast CAGR (2025 to 2035) | 14.8% |
The market is positioned as a fast-growing segment within the broader convenience food industry, driven by evolving urban lifestyles, increasing workforce participation, and rising demand for quick, hassle-free meal solutions. It holds a significant share of the instant food products market, supported by its wide appeal among working professionals, nuclear families, and students. Within the packaged food industry, ready-to-mix products account for a substantial portion of the snacks and meal solutions segment, underpinned by their versatility across breakfast mixes, snack preparations, and traditional Indian meals.
The market is undergoing a shift toward premiumization and health-oriented offerings, as brands introduce fortified, gluten-free, and low-sodium variants targeting health-conscious consumers. Product diversification into fusion flavors and region-specific recipes is expanding consumer reach, while advances in processing and packaging technologies are extending shelf life without compromising taste or texture. Strategic collaborations between food manufacturers, retailers, and online platforms have accelerated product accessibility and brand loyalty.
The shift toward busier urban lifestyles, rising dual-income households, and increasing workforce participation have positioned ready-to-mix products as convenient solutions for time-pressed consumers. These products offer quick preparation without compromising on traditional taste, making them appealing across a broad demographic range, from working professionals to students and nuclear families.
Growing awareness of product variety from traditional Indian breakfast mixes and snacks to fusion and international recipes has expanded adoption. The category also benefits from increasing consumer preference for hygienically packaged, consistently high-quality food products over unpackaged or freshly made alternatives.
Innovation in flavors, health-oriented variants (such as low-sodium, high-fiber, or fortified options), and packaging formats is broadening consumer appeal while meeting evolving dietary preferences. With expanding availability across modern retail and e-commerce channels, coupled with rising health consciousness and demand for clean-label products, the India ready-to-mix food market is well-positioned for sustained double-digit growth over the coming period.
The market is segmented by application and distribution channel. By application, the market is divided into snack mix, dessert mix, and curry making enablers. Based on distribution channel, the market is classified into modern trade, kirana shops, online retailers, and others (wholesalers, institutional sales, and export channels). Regionally, the market is classified into South India, North India, East India, and West India.
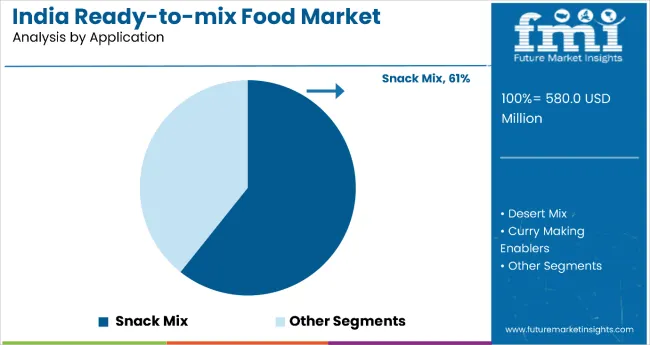
The most lucrative segment in the India ready-to-mix food market is snack mix, which commands a dominant 61% share in 2025. This segment’s growth is fueled by increasing urbanization, busy lifestyles, and the rising preference for convenient yet indulgent snacking options. Snack mixes appeal to a broad demographic young professionals, students, and nuclear families seeking quick, tasty, and easy-to-prepare options without compromising on flavor. Innovation in flavor profiles, regional taste adaptations, and healthier ingredient inclusions (like baked variants or millet-based mixes) are further boosting its adoption.
Additionally, the expansion of modern trade and e-commerce channels has improved accessibility and product visibility, driving both impulse and planned purchases. The segment is also benefiting from aggressive marketing campaigns, premium packaging, and seasonal promotions. As consumer willingness to experiment with new flavors grows, manufacturers are likely to launch premium and health-oriented snack mix variants, cementing this segment’s leadership position in the coming period.
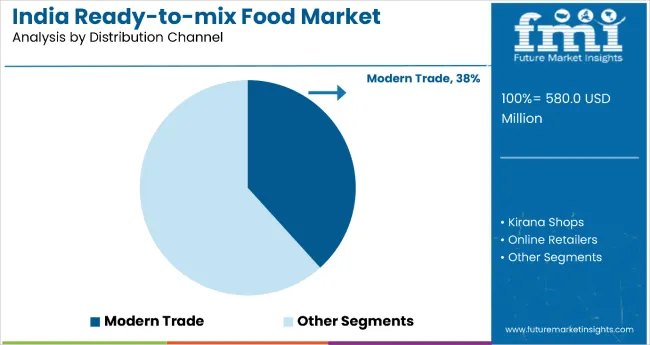
In the India ready-to-mix food market, modern trade emerges as the most lucrative distribution channel, holding a 38% share in 2025. The dominance of this channel is driven by its ability to offer a wide variety of brands and product lines under one roof, along with attractive in-store promotions, discounts, and product sampling opportunities that encourage trial and repeat purchases. Modern trade outlets spanning hypermarkets, supermarkets, and large retail chains are increasingly penetrating urban and semi-urban areas, where consumers seek organized, clean, and convenient shopping experiences.
The channel’s structured supply chain ensures product freshness and consistent availability, which is critical for packaged food categories. Additionally, strategic shelf placement and cross-merchandising (e.g., pairing ready-to-mix items with complementary products) boost sales volumes. With modern trade players expanding their footprint, adopting loyalty programs, and integrating omnichannel strategies, this segment is expected to maintain its stronghold while capturing incremental growth from shifting consumer preferences toward organized retail.
From 2025 to 2035, increasing urbanization, fast-paced lifestyles, and higher disposable incomes are expected to drive sustained demand for ready-to-mix food products in India. Consumers particularly working professionals, students, and nuclear families are seeking quick, tasty, and hygienic meal options without compromising on flavor or nutrition.
Price Sensitivity and Preference for Freshly Cooked Food
Despite growth potential, the India ready-to-mix food market faces challenges from deeply ingrained consumer habits favoring freshly prepared meals, particularly in rural and semi-urban regions. Price sensitivity among middle- and lower-income groups can limit premium product adoption, while competition from street food and home cooking traditions remains strong. Additionally, inconsistent cold chain infrastructure in certain areas may affect product freshness and distribution efficiency for certain ready-to-mix variants.
Health-Centric Innovation and Flavor Diversification
By 2025, health-conscious consumers are increasingly opting for ready-to-mix products with functional benefits, clean labels, and nutrient-rich ingredients such as quinoa, oats, or fortified pulses. Manufacturers are responding with innovative recipes tailored to specific dietary needs, including gluten-free, vegan, and low-sodium options. Regional flavor adaptation is becoming a core strategy, with brands launching state-specific variants to appeal to local palates. Aggressive marketing campaigns, premium packaging, and cross-merchandising in modern trade outlets are enhancing brand positioning.
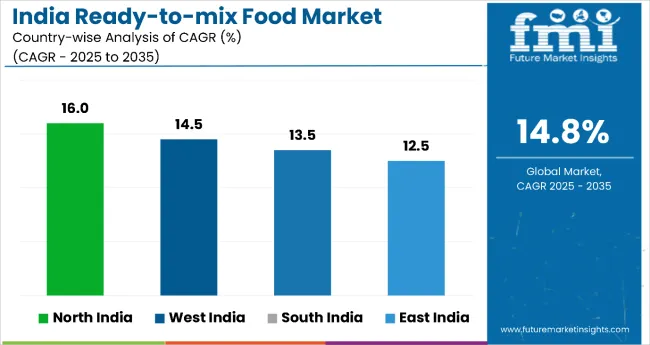
| Country | CAGR |
|---|---|
| North India | 16% |
| West India | 14.5% |
| South India | 13.5% |
| East India | 12.5% |
In the India ready-to-mix food market, North India leads with the highest projected CAGR of 16% from 2025 to 2035, driven by its dense urban centers, strong retail penetration, and cultural affinity for convenience foods. West India follows with a 14.5% CAGR, benefiting from urbanization, diverse culinary heritage, and tourism-fueled demand. South India’s market, growing at 13.5% CAGR, is anchored in its strong traditional product base and rising premiumization trends such as organic and millet-based mixes. East India, while the smallest contributor, is expanding at a 12.5% CAGR, supported by improving infrastructure, growing incomes, and untapped semi-urban demand.
Demand for ready-to-mix food in North India is projected to grow at a CAGR of 16% from 2025 to 2035.North India remains the largest contributor to the India ready-to-mix food market, supported by its dense urban centers and strong retail penetration in cities like Delhi, Chandigarh, and Jaipur. The region’s growing working-class population and preference for convenience-oriented meals drive high product adoption. Expanding organized retail chains, coupled with aggressive marketing campaigns, boost consumer awareness and trial.
Ready-to-mix breakfast, snack, and dessert options dominate sales, with a notable shift toward healthier variants such as millet- and quinoa-based mixes. The rapid growth of e-commerce platforms allows regional and national brands to penetrate tier-2 and tier-3 cities. Seasonal festivals and cultural food preferences also create consistent spikes in sales. Additionally, strong distribution networks and better cold chain infrastructure enhance market accessibility. Leading brands leverage localized flavors to maintain high repeat purchases.
Sales of ready-to-mix food in West India are expected to grow at a CAGR of 14.5% from 2025 to 2035. West India’s ready-to-mix food market thrives on its diverse culinary heritage, spanning Gujarati snacks, Maharashtrian breakfast mixes, and Rajasthani curries. The region benefits from a high rate of urbanization in cities like Mumbai, Pune, and Ahmedabad, where time-pressed consumers actively seek quick meal solutions. Strong tourism also fuels demand for packaged mixes in hotels, cafés, and retail.
Health-conscious urban youth are increasingly switching to low-oil, whole-grain, and fortified products. Retail giants and modern trade channels play a crucial role in introducing premium ready-to-mix brands to the mass market. Festive seasons, particularly Diwali and Navratri, create peak sales opportunities for sweet and savory mixes. The growing influence of digital marketing and influencer promotions enhances brand visibility. Export-oriented manufacturers in Gujarat and Maharashtra are also expanding their capacity for ready-to-mix exports.
Sales of ready-to-mix food in South India are anticipated to grow at a CAGR of 13.5% from 2025 to 2035. South India, known for its rich culinary traditions, is a stronghold for ready-to-mix dosa, idli, vada, and sambar powders. Busy urban professionals in cities like Bengaluru, Chennai, and Hyderabad drive daily consumption of quick-serve mixes. The IT sector’s large workforce creates a stable demand for convenient, nutritious meals.
Premiumization trends are emerging, with brands offering organic, preservative-free, and millet-based options. Increasing retail shelf space in supermarkets and hypermarkets strengthens product accessibility. Traditional food brands in the region are modernizing packaging and extending their shelf life through advanced processing techniques. Social media-driven recipe sharing boosts experimentation with ready-to-mix products. The export potential for South Indian mixes is also expanding, targeting diaspora communities.
Revenue from ready-to-mix food in East India is forecasted to grow at a CAGR of 12.5% from 2025 to 2035. East India is an emerging growth frontier for the ready-to-mix food market, with cities like Kolkata, Bhubaneswar, and Guwahati witnessing increasing demand. Cultural preferences for sweets and snacks create unique market opportunities for traditional mixes like sandesh, rasgulla premixes, and pakora batters. Rising disposable incomes and exposure to modern retail formats are changing purchase behaviors in urban and semi-urban areas.
The entry of national brands, supported by aggressive distributor partnerships, is expanding market reach. Government initiatives to improve logistics and connectivity are enabling better supply chain management. Ready-to-mix breakfast items like poha and upma are gaining traction among younger consumers. Social media advertisements and cooking channels are playing a key role in driving awareness. Seasonal festivals and weddings act as catalysts for bulk purchases.
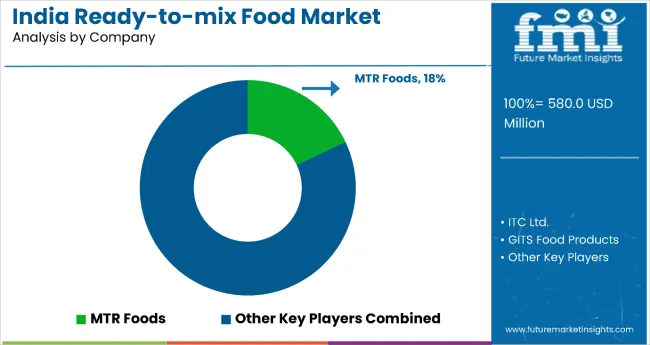
The market is moderately consolidated, with MTR Foods holding the leading position, accounting for 18% market share. The company benefits from strong brand equity, a wide range of product offerings across snack mixes, dessert mixes, and curry-making enablers, as well as an extensive distribution network spanning modern trade, kirana stores, and online channels.
Key players include MTR Foods Pvt. Ltd., Gits Food Products Pvt. Ltd., Nestlé India Ltd., Haldiram’s, Kohinoor Foods Ltd., Aashirvaad (ITC), Everest Spices, Bambino Agro Industries Ltd., and Patanjali Ayurved Ltd. These companies cater to diverse consumer preferences through product lines such as instant snack mixes, dessert mixes, curry bases, and millet-based variants.
Market demand is fueled by busy lifestyles, rising disposable incomes, increased penetration of modern retail and e-commerce, and consumer inclination toward convenience without compromising taste or quality. Premiumization, health-focused innovation, and regional flavor launches are emerging as key competitive strategies.
| Item | Value |
|---|---|
| Quantitative Units | USD 580 Million |
| Application | Snack Mix, Dessert Mix, Curry Making Enablers |
| Distribution Channel | Modern Trade, Kirana Shops, Online Retailers, and Other Distribution Channels. |
| Regions Covered | North India, South India, East India, West India |
| Key Companies Profiled | Indian Tobacco Company, Mavalli Tiffin Room, Gits Food Products Pvt Ltd, Kohinoor Foods, Priya Foods, Bambino Agro Industry, Maiyas Beverages and Foods Pvt. Ltd, Haldiram's Food International Pvt. Ltd, Rasoi Magic Foods (India) Pvt. Ltd., Ushodaya Enterprises Pvt. Ltd. |
| Additional Attributes | Dollar sales by product category and form; rising adoption in urban households due to convenience; penetration growth in tier-2 and tier-3 cities; increasing product premiumization with health-focused variants; growth driven by modern trade & e-commerce channels |
The global India ready-to-mix food market is estimated to be valued at USD 0.6 billion in 2025.
The market size for the India ready-to-mix food market is projected to reach USD 2.2 billion by 2035.
The India ready-to-mix food market is expected to grow at a 14.1% CAGR between 2025 and 2035.
The key product types in India ready-to-mix food market are snack mix, desert mix and curry making enablers.
In terms of distribution channel, modern trade segment to command 38.2% share in the India ready-to-mix food market in 2025.


Our Research Products

The "Full Research Suite" delivers actionable market intel, deep dives on markets or technologies, so clients act faster, cut risk, and unlock growth.

The Leaderboard benchmarks and ranks top vendors, classifying them as Established Leaders, Leading Challengers, or Disruptors & Challengers.

Locates where complements amplify value and substitutes erode it, forecasting net impact by horizon

We deliver granular, decision-grade intel: market sizing, 5-year forecasts, pricing, adoption, usage, revenue, and operational KPIs—plus competitor tracking, regulation, and value chains—across 60 countries broadly.

Spot the shifts before they hit your P&L. We track inflection points, adoption curves, pricing moves, and ecosystem plays to show where demand is heading, why it is changing, and what to do next across high-growth markets and disruptive tech

Real-time reads of user behavior. We track shifting priorities, perceptions of today’s and next-gen services, and provider experience, then pace how fast tech moves from trial to adoption, blending buyer, consumer, and channel inputs with social signals (#WhySwitch, #UX).

Partner with our analyst team to build a custom report designed around your business priorities. From analysing market trends to assessing competitors or crafting bespoke datasets, we tailor insights to your needs.
Supplier Intelligence
Discovery & Profiling
Capacity & Footprint
Performance & Risk
Compliance & Governance
Commercial Readiness
Who Supplies Whom
Scorecards & Shortlists
Playbooks & Docs
Category Intelligence
Definition & Scope
Demand & Use Cases
Cost Drivers
Market Structure
Supply Chain Map
Trade & Policy
Operating Norms
Deliverables
Buyer Intelligence
Account Basics
Spend & Scope
Procurement Model
Vendor Requirements
Terms & Policies
Entry Strategy
Pain Points & Triggers
Outputs
Pricing Analysis
Benchmarks
Trends
Should-Cost
Indexation
Landed Cost
Commercial Terms
Deliverables
Brand Analysis
Positioning & Value Prop
Share & Presence
Customer Evidence
Go-to-Market
Digital & Reputation
Compliance & Trust
KPIs & Gaps
Outputs
Full Research Suite comprises of:
Market outlook & trends analysis
Interviews & case studies
Strategic recommendations
Vendor profiles & capabilities analysis
5-year forecasts
8 regions and 60+ country-level data splits
Market segment data splits
12 months of continuous data updates
DELIVERED AS:
PDF EXCEL ONLINE
India Sustainable Tourism Market Size and Share Forecast Outlook 2025 to 2035
Food & Beverage OEE Software Market Size and Share Forecast Outlook 2025 to 2035
Food Grade Crosslinked Polyvinylpolypyrrolidone (PVPP) Market Size and Share Forecast Outlook 2025 to 2035
Food Grade Cassia Gum Powder Market Size and Share Forecast Outlook 2025 to 2035
Food Grade Dry Film Lubricant Market Size and Share Forecast Outlook 2025 to 2035
India Decorative Veneer Industry Size and Share Forecast Outlook 2025 to 2035
India Outbound Tourism Market Size and Share Forecast Outlook 2025 to 2035
India Casino Tourism Market Forecast and Outlook 2025 to 2035
Foodservice Equipment Market Analysis - Size, Share, and Forecast Outlook 2025 to 2035
Food Basket Market Forecast and Outlook 2025 to 2035
Food Grade Tremella Polysaccharide Market Size and Share Forecast Outlook 2025 to 2035
Food Sorting Machine Market Size and Share Forecast Outlook 2025 to 2035
Foodservice Paper Bag Market Size and Share Forecast Outlook 2025 to 2035
Food Stabilizers Market Size and Share Forecast Outlook 2025 to 2035
Food Packaging Film Market Size and Share Forecast Outlook 2025 to 2035
Food Certification Market Size and Share Forecast Outlook 2025 to 2035
Food Tray Market Size and Share Forecast Outlook 2025 to 2035
Food & Beverage Industrial Disinfection and Cleaning Market Size and Share Forecast Outlook 2025 to 2035
Food Technology Market Size and Share Forecast Outlook 2025 to 2035
Food Tourism Sector Market Size and Share Forecast Outlook 2025 to 2035

Thank you!
You will receive an email from our Business Development Manager. Please be sure to check your SPAM/JUNK folder too.
Chat With
MaRIA