The steel wire reinforced polyethylene pipe market is forecasted to grow from USD 2,428.0 million in 2025 to USD 4,430.8 million by 2035, reflecting a CAGR of 6.2%. The growth curve begins with a steady yet moderately steep incline in the early phase, moving from USD 2,428.0 million in 2025 to USD 2,738.3 million by 2027. This stage represents a foundational acceleration driven by increasing replacement of traditional metal and concrete piping systems with reinforced polyethylene solutions. The gradual slope suggests the market’s early-stage adoption remains balanced, supported by demand from industrial fluid transport, mining, and municipal water systems where durability and corrosion resistance are key.
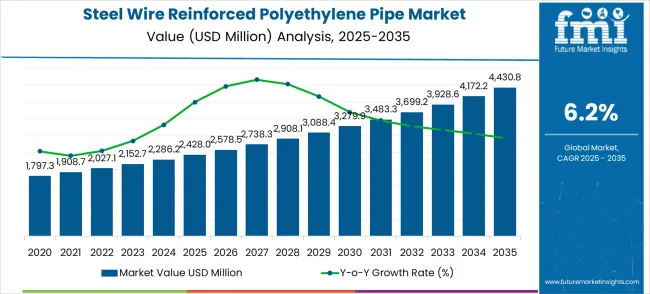
Between 2027 and 2030, the growth curve shows sharper acceleration as market value rises from USD 2,738.3 million to USD 3,088.4 million. The slope steepens during this phase, reflecting increased adoption of high-pressure applications and energy sector projects. Advancements in composite materials and reinforcement technology strengthen the value proposition, while infrastructure projects in the Asia-Pacific create demand surges. The curve in this period signals that mid-decade growth is driven by both replacement cycles in mature economies and first-time installations in developing ones, giving the market an exponential character without excessive volatility.
| Metric | Value |
|---|---|
| Market Value (2025) | USD 2,428.0 million |
| Market Forecast Value (2035) | USD 4,430.8 million |
| Market Forecast CAGR (2025–2035) | 6.2% |
From 2030 to 2033, the curve maintains its upward trajectory with values expanding from USD 3,088.4 million to USD 3,928.6 million. The growth slope here appears smoother but sustained, highlighting a consolidation phase where the market continues to gain traction but at a predictable pace. This pattern indicates that adoption becomes more evenly distributed across industries, such as oil and gas, agriculture, and urban utilities. The consistent progression also suggests that manufacturers optimize production capabilities, leading to stable supply and pricing structures. The growth curve in this interval reflects durable momentum where expansion is no longer solely innovation-driven but supported by recurring replacement demand and broader geographic penetration.
By 2033 to 2035, the market advances from USD 3,928.6 million to USD 4,430.8 million, showing signs of mild tapering. The slope here is slightly less steep, signaling that while demand continues to grow, leading markets are approaching partial saturation. This does not imply stagnation but rather a shift from high acceleration to mature expansion characterized by incremental adoption. The growth curve ultimately takes on a convex form, typical of industrial materials markets transitioning toward maturity. This shape reflects how demand stability, recurring replacement cycles, and ongoing infrastructure development will anchor the market’s long-term expansion, ensuring resilience against cyclical fluctuations.
Market expansion is being supported by the rapid increase in energy infrastructure development worldwide and the corresponding need for high-performance pipeline systems that provide superior corrosion resistance and installation efficiency. Modern pipeline projects rely on consistent material reliability and long-term durability to ensure optimal energy transportation including oil and gas transmission, water distribution systems, and chemical processing facilities. Even minor pipeline failures can require comprehensive infrastructure protocol adjustments to maintain optimal system integrity and operational safety.
The growing complexity of energy transportation requirements and increasing demand for green pipeline solutions are driving demand for steel wire reinforced polyethylene pipes from certified manufacturers with appropriate composite manufacturing capabilities and engineering expertise. Energy companies are increasingly requiring documented pressure ratings and corrosion resistance to maintain pipeline integrity and operational efficiency. Industry specifications and safety standards are establishing standardized pipeline installation procedures that require specialized composite technologies and trained pipeline professionals.
The Steel Wire Reinforced Polyethylene Pipe market is entering a phase of steady growth, driven by demand for advanced pipeline systems, energy infrastructure expansion, and evolving safety and performance standards. By 2035, these pathways together can unlock USD 900-1,200 million in incremental revenue opportunities beyond baseline growth.
Pathway A -- Petroleum Infrastructure Leadership (Oil & Gas Transportation) The petroleum segment already holds the largest share due to its extensive pipeline requirements and demanding operating conditions. Expanding energy infrastructure, pipeline replacement projects, and safety upgrades can consolidate leadership. Opportunity pool: USD 300-420 million.
Pathway B -- Winding Process Innovation (Manufacturing Excellence) Winding molding processes account for the largest share due to manufacturing advantages. Growing infrastructure focus on quality consistency and structural integrity will drive higher adoption of advanced winding process systems. Opportunity pool: USD 240-320 million.
Pathway C -- Natural Gas & Chemical Applications Growth Natural gas distribution and chemical processing markets are expanding, especially with energy transition initiatives. Pipes designed for gas transport and chemical resistance can capture significant growth. Opportunity pool: USD 160-220 million.
Pathway D -- Emerging Market Expansion Asia-Pacific, Middle East, and Latin America present growing demand due to rising energy infrastructure development. Targeting pipeline contractors and energy companies will accelerate adoption. Opportunity pool: USD 120-170 million.
Pathway E -- Water Infrastructure Applications With aging water infrastructure requiring replacement, there is opportunity to develop specialized pipes for potable water distribution and wastewater management systems. Opportunity pool: USD 90-130 million.
Pathway F -- Offshore & Marine Applications Growing offshore energy projects create opportunities for specialized marine-grade pipes designed for subsea and coastal pipeline applications. Opportunity pool: USD 60-90 million.
Pathway G -- Renewable Energy Integration Expanding renewable energy infrastructure, including geothermal and hydrogen systems, creates opportunities for specialized high-performance composite pipes. Opportunity pool: USD 40-60 million.
Pathway H -- Smart Pipeline & Monitoring Systems Integration with pipeline monitoring technologies, leak detection systems, and predictive maintenance creates value-added opportunities for intelligent pipeline solutions. Opportunity pool: USD 20-30 million.
The market is segmented by manufacturing process, application, and region. By manufacturing process, the market is divided into winding molding process, weaving molding process, and spot welding molding process. Based on application, the market is categorized into petroleum, natural gas, chemical, and water supply and drainage. Regionally, the market is divided into North America, Europe, East Asia, South Asia & Pacific, Latin America, and Middle East & Africa.
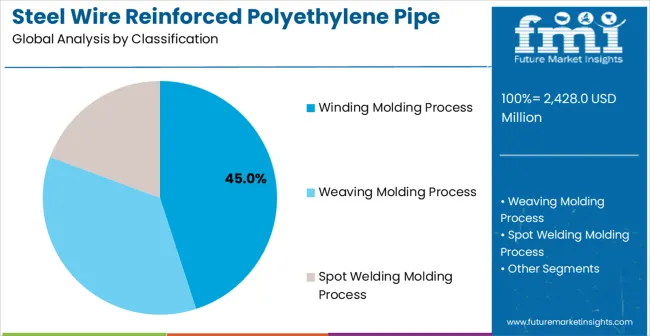
In 2025, the winding molding process segment is projected to capture around 45% of the total market share, making it the leading product category. This dominance is largely driven by the widespread adoption of continuous winding manufacturing techniques that provide optimal fiber orientation and structural integrity, catering to a wide variety of high-pressure pipeline applications. The winding molding process is particularly favored for its ability to deliver consistent pipe quality with precise steel wire placement and polyethylene matrix distribution, ensuring structural reliability. Pipeline manufacturers, energy companies, infrastructure contractors, and engineering firms increasingly prefer winding process pipes, as they meet demanding pressure requirements without imposing excessive manufacturing complexity or quality variations.
The availability of well-established automated winding equipment, along with comprehensive quality control standards and technical support from leading composite pipe manufacturers, further reinforces the segment's market position. This manufacturing process benefits from consistent demand across regions, as it is considered a proven solution for pipeline projects requiring reliable high-pressure performance and corrosion resistance. The combination of manufacturing consistency, structural optimization, and quality reliability makes winding molding process steel wire reinforced polyethylene pipes a preferred choice, ensuring their continued dominance in the composite pipeline market.
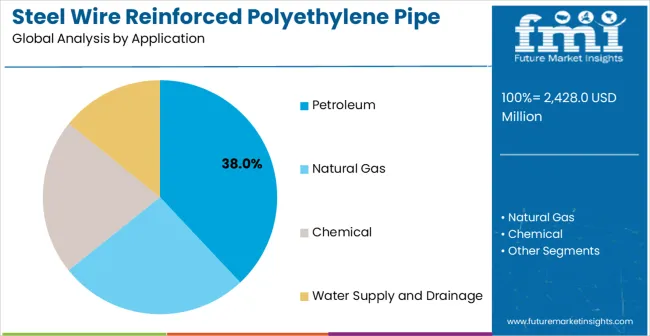
The petroleum segment is expected to represent 38% of steel wire reinforced polyethylene pipe demand in 2025, highlighting its position as the most significant application sector. This dominance stems from the extensive use of composite pipeline systems in petroleum transportation and distribution networks, where corrosion resistance and structural integrity are critical to operational safety and environmental protection. Petroleum applications often require specialized pipeline systems that can withstand hydrocarbon exposure throughout various operating conditions and pressure levels, requiring high-performance and chemically resistant piping solutions.
Steel wire reinforced polyethylene pipes are particularly well-suited to petroleum environments due to their excellent chemical resistance and ability to maintain structural integrity under high-pressure conditions, even when transporting corrosive petroleum products and refined fuels. As global petroleum infrastructure continues to expand and energy companies emphasize improved pipeline safety and environmental compliance standards, the demand for steel wire reinforced polyethylene pipes continues to rise. The segment also benefits from increased investment within the petroleum industry, where operators are increasingly prioritizing pipeline reliability and corrosion prevention as essential elements of safe and efficient petroleum transportation. With petroleum operations requiring comprehensive pipeline networks and long-term operational integrity, steel wire reinforced polyethylene pipes provide an essential solution to maintain effective petroleum transport while minimizing corrosion-related maintenance and environmental risks. The growth of offshore petroleum projects, coupled with increased focus on pipeline safety and environmental protection regulations, ensures that petroleum applications will remain the largest and most stable demand driver for steel wire reinforced polyethylene pipes in the forecast period.
The market is advancing steadily due to increasing energy infrastructure development and growing recognition of composite pipe technology advantages over traditional steel and concrete pipeline systems. The market faces challenges including higher initial material costs compared to conventional pipes, need for specialized installation techniques and equipment, and varying industry acceptance across different pipeline applications. Quality certification efforts and manufacturing standardization programs continue to influence product development and market adoption patterns.
The growing development of advanced composite manufacturing processes is enabling superior pipe performance with improved pressure ratings and enhanced corrosion resistance characteristics. Enhanced manufacturing technologies and optimized fiber reinforcement systems provide reliable pipeline performance while maintaining lightweight construction and installation efficiency. These technologies are particularly valuable for pipeline contractors who require consistent pipe performance that can support demanding infrastructure applications with reliable long-term durability results.
Modern steel wire reinforced polyethylene pipe manufacturers are incorporating advanced monitoring features and smart pipeline capabilities that enhance operational safety and system management effectiveness. Integration of advanced sensor compatibility systems and optimized leak detection interfaces enables superior pipeline monitoring and comprehensive maintenance scheduling capabilities. Advanced smart features support installation in diverse infrastructure environments while meeting various safety requirements and operational specifications.
| Country | CAGR (2025–2035) |
|---|---|
| China | 8.4% |
| India | 7.8% |
| Germany | 7.1% |
| Brazil | 6.5% |
| United States | 5.9% |
| United Kingdom | 5.3% |
| Japan | 4.7% |
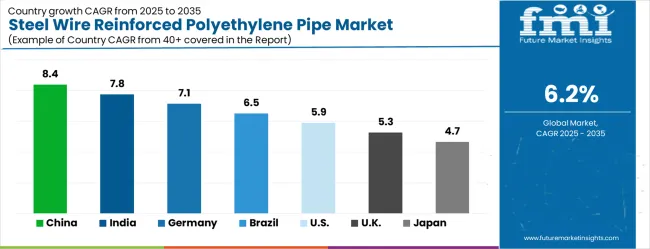
The market is growing steadily, with China leading at an 8.4% CAGR through 2035, driven by massive energy infrastructure development and increasing adoption of advanced pipeline technologies. India follows at 7.8%, supported by rising oil and gas infrastructure expansion and growing awareness of composite pipe solutions. Germany grows strongly at 7.1%, integrating composite pipeline technology into its established energy and industrial infrastructure. Brazil records 6.5%, focusing energy infrastructure modernization and pipeline replacement initiatives. The United States shows solid growth at 5.9%, focusing on pipeline safety enhancement and infrastructure renewal. The United Kingdom demonstrates steady progress at 5.3%, maintaining established energy infrastructure applications. Japan records 4.7% growth, concentrating on technology advancement and pipeline system optimization.
The report covers an in-depth analysis of 40+ countries; top-performing countries are highlighted below.
The market in China is projected to witness a CAGR of 8.4% from 2025 to 2035, highlighting rapid expansion across infrastructure and utility sectors. Government-driven pipeline replacement projects are favoring advanced pipe technologies due to their strength and corrosion resistance. The demand is being steered by energy distribution, urban infrastructure modernization, and large-scale water management programs. Chinese manufacturers are investing in automation and intelligent production lines to scale operations while maintaining quality. Foreign players are entering through joint ventures to capture opportunities in water supply and oil transport projects. Strategic collaboration among domestic and global enterprises is reinforcing competitiveness, ensuring steady adoption across industries such as mining, petrochemicals, and agriculture.
India steel wire reinforced polyethylene pipe market is set to register a CAGR of 7.8% during 2025 to 2035, driven by the expansion of irrigation and gas distribution networks. Increasing adoption of flexible and durable pipes in agriculture is boosting replacement of conventional systems. The government push for city gas distribution projects is giving strong momentum to domestic producers. Manufacturing clusters in Gujarat and Maharashtra are emerging as major production hubs with rising investment in advanced extrusion processes. Indian companies are focusing on reducing costs through raw material optimization while maintaining strength and durability. International players are collaborating with local firms to gain a foothold in public infrastructure and industrial projects, creating competitive intensity in the sector.
A CAGR of 7.1% has been estimated for the German market between 2025 and 2035, supported by industrial modernization and water treatment investments. Strict European regulations on pipeline integrity are favoring high-strength and long-lasting pipe materials. Germany is experiencing a shift toward reinforced polyethylene pipes in chemical transport and wastewater systems due to their resistance to abrasion and high pressure. Local manufacturers are focusing eco-efficient production processes and automation to maintain competitiveness. Import dependency is relatively low as established firms have developed strong in-house production capacities. Strategic expansion into Eastern Europe is also being pursued by German companies to strengthen regional dominance and diversify sales channels.
The Brazilian steel wire reinforced polyethylene pipe market is anticipated to record a CAGR of 6.5% from 2025 to 2035, fueled by energy distribution and agricultural applications. Expansion of oil and gas infrastructure, particularly in offshore projects, is generating consistent demand for advanced pipeline systems. Brazilian agricultural irrigation networks are shifting toward reinforced polyethylene pipes due to their durability in harsh conditions. Local manufacturers are facing competition from imports, prompting them to adopt better reinforcement technologies. Strategic partnerships with foreign firms are being developed to ensure technology transfer and cost competitiveness. The market is also witnessing investment in expanding capacity to meet rising demand from infrastructure modernization and industrial projects.
In the United States, the market is forecasted to grow at a CAGR of 5.9% between 2025 and 2035, supported by the modernization of oil and gas distribution systems. Replacement of outdated steel pipelines is enhancing demand for reinforced polyethylene alternatives that offer durability and efficiency. USA regulations around pipeline safety are encouraging adoption of advanced composite piping solutions. Domestic players are focusing on scaling production with robotic extrusion processes while international companies are entering through acquisitions to secure regional share. Applications in chemical transport and municipal water supply are gaining traction, positioning reinforced polyethylene pipes as a reliable alternative to traditional systems in critical sectors.
The United Kingdom steel wire reinforced polyethylene pipe market is expected to advance at a CAGR of 5.3% from 2025 to 2035, driven by pipeline rehabilitation initiatives and industrial adaptation. Replacement of aging water and gas networks is a central factor creating opportunities for durable pipe systems. UK companies are investing in advanced reinforcement methods to meet performance expectations in high-pressure applications. Imports are filling gaps in domestic supply, with European suppliers playing a strong role in meeting demand. Government infrastructure programs are favoring pipes with longer service life and reduced maintenance costs. Industrial sectors including energy, chemicals, and mining are adopting reinforced polyethylene solutions for their superior durability and cost efficiency.
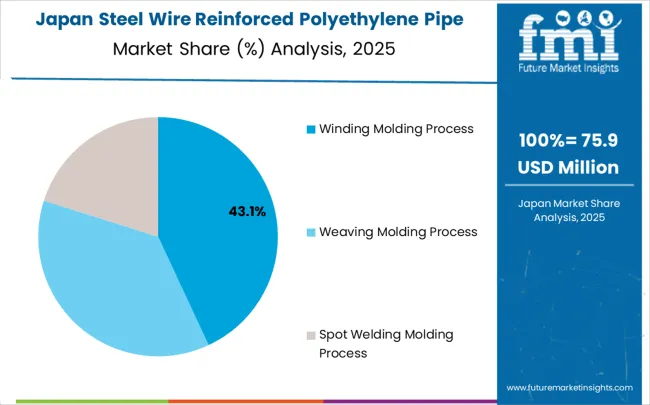
The market in Japan is projected to expand at a CAGR of 4.7% between 2025 and 2035, supported by high-value applications in chemical, power, and water industries. Japan pipeline replacement projects are favoring reinforced polyethylene pipes due to their resistance to pressure and corrosion. Domestic manufacturers are focusing high-performance pipes for specialized sectors such as electronics and petrochemicals. Strong focus is being placed on quality and compliance with global standards, ensuring pipes meet the requirements of advanced industries. Import penetration remains limited as Japanese producers are well positioned to supply high-precision products. Energy-efficient production systems and technology-driven innovation are being prioritized to retain competitiveness in both domestic and export markets.
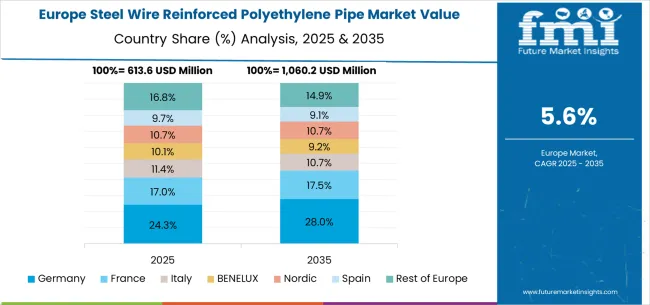
The steel wire reinforced polyethylene pipe market in Europe is forecast to expand from USD 650.7 million in 2025 to USD 1,187.5 million by 2035, registering a CAGR of 6.2%. Germany will remain the largest market, holding 34.0% share in 2025, easing to 33.5% by 2035, supported by strong energy infrastructure and advanced pipeline systems. The United Kingdom follows, rising from 26.0% in 2025 to 26.5% by 2035, driven by energy companies and infrastructure modernization initiatives. France is expected to decline slightly from 22.0% to 21.5%, reflecting energy industry consolidation. Italy maintains stability at around 13.0%, supported by energy facilities and industrial pipeline centers, while Spain grows from 4.5% to 5.0% with expanding energy and industrial pipeline demand. BENELUX markets ease from 0.4% to 0.3%, while the remainder of Europe hovers near 0.1%--0.2%, balancing emerging Eastern European growth against mature Nordic markets.
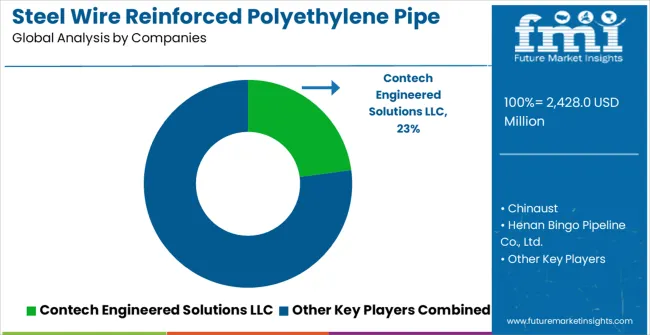
The market is defined by competition between established multinational suppliers and regional manufacturers that focus on cost efficiency and product customization. Contech Engineered Solutions LLC holds a strong position with advanced engineering capabilities and a diversified product line, targeting infrastructure, municipal water distribution, and industrial applications. Their competitive advantage lies in combining robust technical expertise with wide-scale project experience, which allows them to secure large contracts in urban development and industrial expansion projects.
Chinese players such as Chinaust, Henan Bingo Pipeline, Tianjin Jingtong Pipeline Technology, and Shandong Eastern Pipe are expanding their market presence by focusing high-volume production capacity, affordable pricing, and compliance with international standards. Their brochures highlight product strength, corrosion resistance, and long service life, making them suitable for large-scale water supply and sewage applications. Companies like HAILI and Def Pipeline differentiate through enhanced jointing systems and flexible installation solutions that improve on-site efficiency.
Emerging competitors including Okorder, Jiangsu Langboone, Riverson, Comflex Industrial, and Tokka focus on niche segments and regional distribution networks. They strengthen competitiveness by offering tailored pipe diameters, specialized fittings, and application-specific solutions for mining, irrigation, and energy industries. Brochures frequently highlight tensile strength, hydraulic efficiency, and low maintenance advantages. The market is becoming more technology-driven, with investment in automated production lines and advanced quality testing to ensure reliability. Competitive dynamics are shaped by a blend of scale, cost-effectiveness, and innovation, with global leaders focusing on performance-driven differentiation while regional players capitalize on localized demand and flexible pricing.
| Item | Value |
|---|---|
| Quantitative Units | USD 2,428.0 million |
| Manufacturing Process | Winding Molding Process, Weaving Molding Process, Spot Welding Molding Process |
| Application | Petroleum, Natural Gas, Chemical, Water Supply and Drainage |
| Regions Covered | North America, Europe, East Asia, South Asia & Pacific, Latin America, Middle East & Africa |
| Countries Covered | China, India, Germany, Brazil, United States, United Kingdom, Japan, and 40+ countries |
| Key Companies Profiled | Contech Engineered Solutions LLC, Chinaust, Henan Bingo Pipeline Co., Ltd., HAILI, Def Pipeline, Okorder, Tianjin Jingtong Pipeline Technology Co., Ltd., IANGSU LANGBOONE PIPE MANUFACTURING CO., LTD, Riverson, SHANDONG EASTERN PIPE CO., LTD., Comflex Industrial Co Limited, Tokka |
| Additional Attributes | Dollar sales by manufacturing process and application segment, regional demand trends across major markets, competitive landscape with established composite pipe manufacturers and emerging pipeline technology providers, customer preferences for different manufacturing processes and energy applications, integration with pipeline installation systems and energy infrastructure protocols, innovations in composite manufacturing effectiveness and pressure performance technologies, and adoption of smart pipeline features with enhanced monitoring capabilities for improved energy infrastructure workflows |
The global steel wire reinforced polyethylene pipe market is estimated to be valued at USD 2,428.0 million in 2025.
The market size for the steel wire reinforced polyethylene pipe market is projected to reach USD 4,430.8 million by 2035.
The steel wire reinforced polyethylene pipe market is expected to grow at a 6.2% CAGR between 2025 and 2035.
The key product types in steel wire reinforced polyethylene pipe market are winding molding process, weaving molding process and spot welding molding process.
In terms of application, petroleum segment to command 38.0% share in the steel wire reinforced polyethylene pipe market in 2025.


Our Research Products

The "Full Research Suite" delivers actionable market intel, deep dives on markets or technologies, so clients act faster, cut risk, and unlock growth.

The Leaderboard benchmarks and ranks top vendors, classifying them as Established Leaders, Leading Challengers, or Disruptors & Challengers.

Locates where complements amplify value and substitutes erode it, forecasting net impact by horizon

We deliver granular, decision-grade intel: market sizing, 5-year forecasts, pricing, adoption, usage, revenue, and operational KPIs—plus competitor tracking, regulation, and value chains—across 60 countries broadly.

Spot the shifts before they hit your P&L. We track inflection points, adoption curves, pricing moves, and ecosystem plays to show where demand is heading, why it is changing, and what to do next across high-growth markets and disruptive tech

Real-time reads of user behavior. We track shifting priorities, perceptions of today’s and next-gen services, and provider experience, then pace how fast tech moves from trial to adoption, blending buyer, consumer, and channel inputs with social signals (#WhySwitch, #UX).

Partner with our analyst team to build a custom report designed around your business priorities. From analysing market trends to assessing competitors or crafting bespoke datasets, we tailor insights to your needs.
Supplier Intelligence
Discovery & Profiling
Capacity & Footprint
Performance & Risk
Compliance & Governance
Commercial Readiness
Who Supplies Whom
Scorecards & Shortlists
Playbooks & Docs
Category Intelligence
Definition & Scope
Demand & Use Cases
Cost Drivers
Market Structure
Supply Chain Map
Trade & Policy
Operating Norms
Deliverables
Buyer Intelligence
Account Basics
Spend & Scope
Procurement Model
Vendor Requirements
Terms & Policies
Entry Strategy
Pain Points & Triggers
Outputs
Pricing Analysis
Benchmarks
Trends
Should-Cost
Indexation
Landed Cost
Commercial Terms
Deliverables
Brand Analysis
Positioning & Value Prop
Share & Presence
Customer Evidence
Go-to-Market
Digital & Reputation
Compliance & Trust
KPIs & Gaps
Outputs
Full Research Suite comprises of:
Market outlook & trends analysis
Interviews & case studies
Strategic recommendations
Vendor profiles & capabilities analysis
5-year forecasts
8 regions and 60+ country-level data splits
Market segment data splits
12 months of continuous data updates
DELIVERED AS:
PDF EXCEL ONLINE
Steel Drum Market Size and Share Forecast Outlook 2025 to 2035
Steel Drums & IBCs Market Size and Share Forecast Outlook 2025 to 2035
Steel Roll-on Tube Market Size and Share Forecast Outlook 2025 to 2035
Steel Testing Equipment Market Size and Share Forecast Outlook 2025 to 2035
Steel Salvage Drums Market Size and Share Forecast Outlook 2025 to 2035
Steel Strapping Market Size and Share Forecast Outlook 2025 to 2035
Steel Drum Industry Analysis in Southeast Asia Size and Share Forecast Outlook 2025 to 2035
Steel Studs Market Size and Share Forecast Outlook 2025 to 2035
Steel Rebar Market Size and Share Forecast Outlook 2025 to 2035
Steel Sections Market Analysis - Size, Share, and Forecast Outlook 2025 to 2035
Steel Market Size, Growth, and Forecast 2025 to 2035
Steel Containers Market Analysis by Product Type, Capacity Type, End Use, and Region through 2025 to 2035
Key Players & Market Share in the Steel Containers Industry
Competitive Overview of Steel Drum Market Share
Examining Market Share Trends in Steel Drums and IBCs Industry
Japan Steel Drum Market Analysis – Trends & Forecast 2023-2033
Korea Steel Drum Market Growth – Trends & Forecast 2023-2033
Western Europe Steel Drum Market Insights – Trends & Forecast 2023-2033
Steel Ring Pull Caps Market
Steel Pipe Market Growth - Trends & Forecast 2025 to 2035

Thank you!
You will receive an email from our Business Development Manager. Please be sure to check your SPAM/JUNK folder too.
Chat With
MaRIA