Reports

- Global Locations -

Headquarters

Future Market Insights, Inc.

Christiana Corporate, 200
Continental Drive, Suite 401,
Newark, Delaware - 19713,
United States

T: +1-845-579-5705

Americas

Future Market Insights, Inc.

616 Corporate Way, Suite 2-9018,
Valley Cottage, NY 10989, United States

T: +1-347-918-3531

MEA

Future Market Insights

1602-6 Jumeirah Bay X2 Tower, Plot No: JLT-PH2-X2A,
Jumeirah Lakes Towers, Dubai,
United Arab Emirates

Europe

Future Market Insights

3rd Floor, 207 Regent Street,
W1B 3HH London
United Kingdom

T: + 44 (0) 20 8123 9659
D: +44 (0) 20 3287 4268

Asia Pacific

Future Market Insights

IndiaLand Global Tech Park, Unit UG-1, Behind Grand HighStreet, Phase 1, Hinjawadi, MH, Pune – 411057, India

Medical Spa Market Outlook for 2024 to 2034

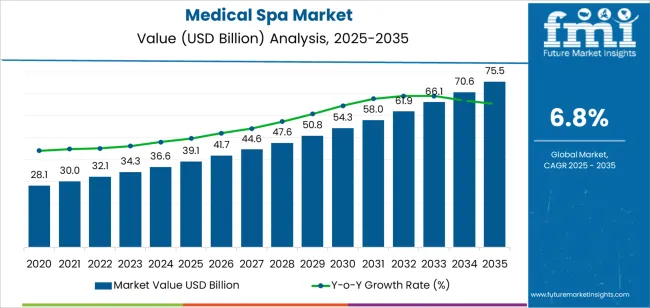
The medical spa market size is estimated to be worth US$ 36,592.2 million in 2024. The rising awareness among consumers about health and wellness has led to a growing demand for non-invasive cosmetic procedures and relaxation therapies offered by medical spa. The demand for medical spa is predicted to rise at a CAGR of 6.80% through 2034. The aging population, particularly in developed regions, fuels the demand for anti-aging treatments and cosmetic procedures.

The medical spa industry is anticipated to surpass US$ 70,648.2 million by 2034. As individuals seek to maintain a youthful appearance and address age-related concerns such as wrinkles, sagging skin, and age spots, medical spas offer a range of rejuvenation treatments including Botox injections, dermal fillers, and laser skin resurfacing.

Demand Analysis of the Medical Spa

  • Advances in medical technology have revolutionized the aesthetic industry, making cosmetic treatments safer, more effective, and less invasive.
  • There is a growing trend towards preventative healthcare, with consumers proactively seeking treatments and therapies to prevent health issues before they arise.
  • The endorsement of medical spas by celebrities and influencers through social media platforms has significantly boosted awareness and interest in aesthetic treatments.
  • Medical spas are expanding their service offerings to cater to a broader range of consumer needs and preferences.
Attributes Details
Medical Spa Market Value for 2024 US$ 36,592.2 million
Medical Spa Market Value for 2034 US$ 70,648.2 million
Medical Spa Market Forecast CAGR for 2024 to 2034 6.80%

Don't pay for what you don't need

Customize your report by selecting specific countries or regions and save 30%!

Key Trends Influencing the Medical Spa Market

  • Rise of Non-Invasive Procedures

There is a growing preference for non-invasive cosmetic procedures among consumers seeking aesthetic enhancements with minimal downtime and risks. Key trends include the adoption of treatments such as Botox injections, dermal fillers, and laser skin rejuvenation, driving the growth of the medical spa market.

  • Medical Spa Providers Investing in the Latest Technology

Medical spas are increasingly incorporating advanced technologies into their service offerings to enhance treatment efficacy and patient satisfaction. Trends include the use of laser therapy, radiofrequency devices, and ultrasound treatments for skin tightening, body contouring, and hair removal, providing clients with innovative and effective aesthetic solutions.

  • Holistic Wellness Approach

There is a shift towards a holistic wellness approach in the medical spa industry, with an emphasis on promoting overall health and well-being alongside aesthetic procedures. Trends include the integration of services such as nutritional counseling, stress management techniques, and mindfulness practices, catering to clients' desire for comprehensive wellness solutions.

  • Personalized Treatment Plans

Medical spas focus on providing personalized treatment plans tailored to individual client needs and goals. Trends include thorough consultations, customized procedures, and ongoing support throughout the client's journey, ensuring optimal results and patient satisfaction.

  • Wellness Tourism

The rise of wellness tourism has led to an increase in medical spa destinations catering to travelers seeking rejuvenation and relaxation experiences. Trends include the development of luxury spa resorts, wellness retreats, and medical tourism packages combining aesthetic treatments with leisure activities, attracting a global clientele seeking wellness-focused vacations.

Comparative View of the Adjacent Medical Spa Market

This section provides a comparative view of the medical spa industry, the wearable medical device market, and the portable medical devices market. The table below analyzes crucial factors in each market from 2024 to 2034, including CAGR, opportunities, and key trends.

Medical Spa Market:

Attributes Medical Spa Market
CAGR (2024 to 2034) 6.80%
Opportunity Increasing demand for non-invasive cosmetic procedures driving growth in the medical spa industry
Key Trends Integration of advanced technologies like AI and VR enhancing personalized treatment experiences in medical spas

Wearable Medical Device Market:

Attributes Wearable Medical Device Market
CAGR (2024 to 2034) 8.20%
Opportunity Growing focus on remote patient monitoring driving expansion opportunities in the wearable medical device market
Key Trends Adoption of wearable biosensors for continuous health tracking and early disease detection leading market innovation

Portable Medical Devices Market:

Attributes Portable Medical Devices Market
CAGR (2024 to 2034) 10.7%
Opportunity Rising preference for home healthcare solutions accelerating the growth of the portable medical devices market
Key Trends Miniaturization and wireless connectivity enable the development of compact and user-friendly portable medical devices
Sabyasachi Ghosh
Sabyasachi Ghosh

Principal Consultant

Talk to Analyst

Find your sweet spots for generating winning opportunities in this market.

Category-wise Insights

This section provides detailed insights into specific segments in the medical spa industry.

Facial Injectable Services to Hold a Share of 45% in 2024

By Services Facial Injectable
Market Share in 2024 45%

Facial injectable services segment is projected to capture a share of 45% in 2024.

  • Consumers are increasingly seeking minimally invasive procedures to achieve aesthetic improvements, driving the popularity of facial injectables.
  • Facial injectables offer noticeable and long-lasting results, making them a compelling option for individuals seeking effective rejuvenation solutions.
  • Continuous advancements in injection techniques and filler materials enhance the safety, efficacy, and natural-looking outcomes of these procedures.
  • Facial injectables address various concerns, including reducing wrinkles, enhancing facial contours, and achieving a more youthful appearance.

Single Ownership Spa Predicted to Garner a Share of 42% in 2024

By Providers Single Ownership Spa
Market Share in 2024 42.0%

The single ownership spa segment is expected to secure a significant share of 42.0% in 2024.

  • Single ownership spas often provide a more personalized and intimate experience, catering to individual client needs and preferences.
  • Independent spa owners have greater flexibility to adapt treatment offerings and pricing structures to cater to local market demands.
  • Single ownership spas can foster strong relationships with their clients, leading to increased customer loyalty and repeat business.
  • The independent ownership model attracts passionate individuals who are dedicated to providing high-quality services and creating a unique spa experience.

Country-wise Insights

The section analyzes the medical spa market across key countries, including the United States, United Kingdom, India, Thailand, and Germany. The analysis points toward specific factors driving the adoption of medical spa in these countries.

Countries CAGR
United States 5.4%
United Kingdom 2.90%
Germany 3.10%
Thailand 6.9%
India 7.60%

Medical Spa Industry in the United States

The medical spa industry in the United States is anticipated to rise at a CAGR of 5.4% through 2034.

  • The United States healthcare system facilitates the integration of medical spa services, offering patients convenient access and ensuring quality standards.
  • Americans have long embraced cosmetic procedures and preventative healthcare practices, creating a strong foundation for the medical spa industry.
  • The United States is a hub for research and development in medical aesthetics, leading to the continuous introduction of cutting-edge technologies within the medical spa industry.

Medical Spa Industry in the United Kingdom

The medical spa industry in the United Kingdom is projected to rise at a CAGR of 2.90% through 2034. This stable growth reflects the market's maturity and its focus on:

  • British medical spas often cater to a discerning clientele, offering bespoke treatment plans and luxurious spa experiences.
  • Stringent regulations ensure safety and quality standards within the medical spa industry, fostering consumer trust and confidence.
  • Certain medical spa procedures, such as laser hair removal for certain medical conditions, can be partially covered by the NHS, contributing to wider accessibility.

Medical Spa Industry in Germany

Germany’s medical spa industry is likely to witness expansion at a CAGR of 3.10% through 2034.

  • Germans prioritize preventive measures to maintain health and well-being, making medical spa services that promote holistic wellness highly attractive.
  • Germany boasts a long tradition of thermal spas and wellness retreats, offering a unique blend of medical spa treatments and relaxation experiences.
  • German consumers often seek medical spa treatments that utilize natural ingredients and incorporate holistic wellness principles.

Medical Spa Industry in Thailand

Thailand's medical spa industry is projected to rise at a healthy CAGR of 6.9% through 2034.

  • Thailand has established itself as a leading medical tourism destination, attracting international patients seeking affordable and high-quality medical spa treatments.
  • The Thai government actively promotes medical tourism, creating a supportive environment for the growth of the medical spa industry.
  • Thai culture places a high value on beauty and well-being, contributing to the widespread acceptance and popularity of medical spa services.

Medical Spa Industry in India

India's medical spa market is anticipated to record a remarkable CAGR of 7.60% through 2034.

  • India's burgeoning middle class has increased disposable income and a growing interest in self-care practices, creating a significant customer base for medical spa services.
  • The Indian healthcare system is undergoing rapid advancements, making high-quality medical spa treatments more accessible to a wider population.
  • Medical spa treatments are gaining increased awareness and acceptance in India, shedding traditional stigmas and attracting new customers.

Get the data you need at a Fraction of the cost

Personalize your report by choosing insights you need
and save 40%!

Competition Outlook of the Medical Spa Industry

The competition within the medical spa industry is intensifying as the demand for non-invasive cosmetic procedures continues to surge. Established players are striving to maintain their market positions by offering a comprehensive range of services, including laser treatments, injectables, and skin rejuvenation therapies. Moreover, they focus on enhancing customer experience through personalized treatment plans and luxurious spa amenities to retain clientele loyalty amidst growing competition.

Emerging trends in the medical spa industry, such as the integration of advanced technologies like artificial intelligence and virtual reality, are reshaping the competitive dynamics. Market entrants are leveraging these innovations to differentiate their services, attract new customers, and stay ahead of competitors. Additionally, strategic partnerships with cosmetic brands and healthcare providers are becoming increasingly common, enabling medical spas to expand their service offerings and reach a broader market segment.

Players in the medical spa industry are ramping up their marketing efforts and investing in staff training to ensure high-quality service delivery. They are also focusing on creating unique selling propositions, such as specialized treatment packages and exclusive membership benefits, to stand out in the market.

Recent Developments in the Medical Spa Industry

  • In 2023, Chic La Vie expanded its services to cater specifically to men's needs, offering treatments like Botox for men and body contouring procedures tailored for the male physique.
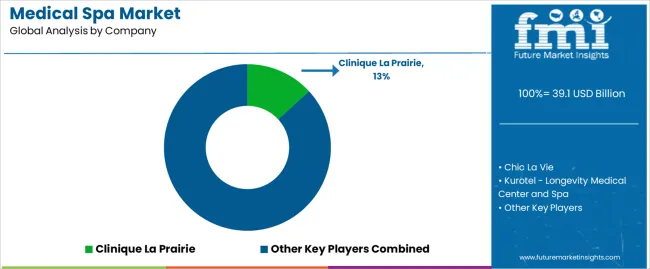
  • Clinique La Prairie continues to emphasize its personalized approach, launching custom-designed wellness programs that combine traditional and cutting-edge therapies based on individual needs and goals.
  • Lanserhof plans to expand to the Spanish market in 2026 with a health resort in Marbella.

Key Companies in the Market

  • Chic La Vie
  • Clinique La Prairie
  • Kurotel - Longevity Medical Center and Spa
  • Lanserhof Lans
  • The Orchard Wellness Resort
  • Biovital Medspa
  • Allure Medspa
  • Longevity Wellness Worldwide
  • Serenity Medspa
  • Bijoux Medi-Spa

Key Coverage in the Medical Spa Industry Report

  • Breakdown of the Leading Medical Spa Services
  • Competitive Analysis of Medical Spa Market
  • Med Spa Industry growth
  • Demand for Medical Spa Hair Treatment
  • Leading Medical Spa Service Providers

Key Segments

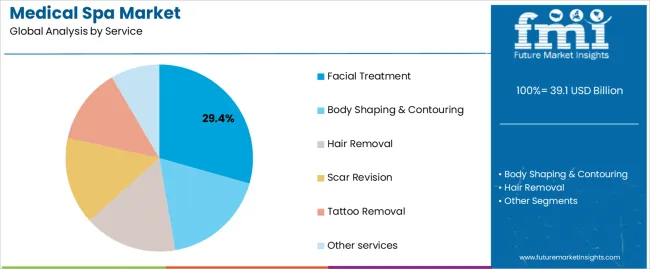
By Service:

  • Facial Treatment
  • Body Shaping & Contouring
  • Hair Removal
  • Scar Revision
  • Tattoo Removal
  • Other services

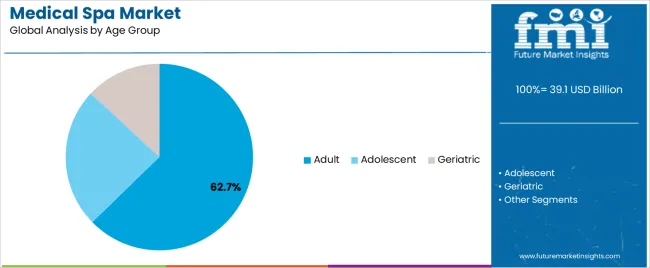
By Age Group:

  • Adolescent
  • Adult
  • Geriatric

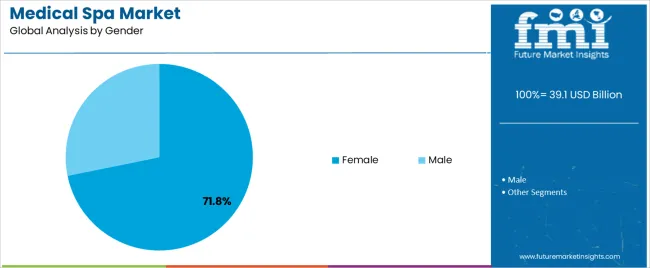
By Gender:

  • Male
  • Female

By Provider:

  • Single Ownership
  • Group Ownership
  • Free-standing
  • Medical Practice Associated Spas

By Region:

  • North America
  • Latin America
  • Europe
  • East Asia
  • South Asia
  • Oceania
  • Middle East and Africa

Frequently Asked Questions

What is the Market Potential for Medical Spa?

The medical spa market is projected to expand at a CAGR of 6.80% between 2024 and 2034.

Which Provider Segment Dominates the Medical Spa Market?

The single ownership spa segment leads the medical spa industry.

Who are the Top Three Medical Spa Companies?

Some leading medical spa companies are Chic La Vie, Clinique La Prairie, and Lanserhof Lans.

What is the Medical Spa Market Growth Outlook for 2034?

The medical spa market is anticipated to surpass US$ 70,648.2 million by 2034.

What is Driving the Demand for Medical Spa?

Increasing desire for non-invasive cosmetic procedures and wellness treatments is driving the demand for medical spa services.

Table of Content

1. Executive Summary

    1.1. Global Market Outlook

    1.2. Demand-side Trends

    1.3. Supply-side Trends

    1.4. Technology Roadmap Analysis

    1.5. Analysis and Recommendations

2. Market Overview

    2.1. Market Coverage / Taxonomy

    2.2. Market Definition / Scope / Limitations

3. Market Background

    3.1. Market Dynamics

        3.1.1. Drivers

        3.1.2. Restraints

        3.1.3. Opportunity

        3.1.4. Trends

    3.2. Scenario Forecast

        3.2.1. Demand in Optimistic Scenario

        3.2.2. Demand in Likely Scenario

        3.2.3. Demand in Conservative Scenario

    3.3. Opportunity Map Analysis

    3.4. Investment Feasibility Matrix

    3.5. PESTLE and Porter’s Analysis

    3.6. Regulatory Landscape

        3.6.1. By Key Regions

        3.6.2. By Key Countries

    3.7. Regional Parent Market Outlook

4. Global Market Analysis 2019 to 2023 and Forecast, 2024 to 2034

    4.1. Historical Market Size Value (US$ Million) Analysis, 2019 to 2023

    4.2. Current and Future Market Size Value (US$ Million) Projections, 2024 to 2034

        4.2.1. Y-o-Y Growth Trend Analysis

        4.2.2. Absolute $ Opportunity Analysis

5. Global Market Analysis 2019 to 2023 and Forecast 2024 to 2034, By Service

    5.1. Introduction / Key Findings

    5.2. Historical Market Size Value (US$ Million) Analysis By Service, 2019 to 2023

    5.3. Current and Future Market Size Value (US$ Million) Analysis and Forecast By Service, 2024 to 2034

        5.3.1. Facial Treatment

        5.3.2. Body Shaping & Contouring

        5.3.3. Hair Removal

        5.3.4. Scar Revision

        5.3.5. Tattoo Removal

        5.3.6. Other Services

    5.4. Y-o-Y Growth Trend Analysis By Service, 2019 to 2023

    5.5. Absolute $ Opportunity Analysis By Service, 2024 to 2034

6. Global Market Analysis 2019 to 2023 and Forecast 2024 to 2034, By Gender

    6.1. Introduction / Key Findings

    6.2. Historical Market Size Value (US$ Million) Analysis By Gender, 2019 to 2023

    6.3. Current and Future Market Size Value (US$ Million) Analysis and Forecast By Gender, 2024 to 2034

        6.3.1. Male

        6.3.2. Female

    6.4. Y-o-Y Growth Trend Analysis By Gender, 2019 to 2023

    6.5. Absolute $ Opportunity Analysis By Gender, 2024 to 2034

7. Global Market Analysis 2019 to 2023 and Forecast 2024 to 2034, By Age

    7.1. Introduction / Key Findings

    7.2. Historical Market Size Value (US$ Million) Analysis By Age, 2019 to 2023

    7.3. Current and Future Market Size Value (US$ Million) Analysis and Forecast By Age, 2024 to 2034

        7.3.1. Adolescent

        7.3.2. Adult

        7.3.3. Geriatric

    7.4. Y-o-Y Growth Trend Analysis By Age, 2019 to 2023

    7.5. Absolute $ Opportunity Analysis By Age, 2024 to 2034

8. Global Market Analysis 2019 to 2023 and Forecast 2024 to 2034, By Region

    8.1. Introduction

    8.2. Historical Market Size Value (US$ Million) Analysis By Region, 2019 to 2023

    8.3. Current Market Size Value (US$ Million) Analysis and Forecast By Region, 2024 to 2034

        8.3.1. North America

        8.3.2. Latin America

        8.3.3. Western Europe

        8.3.4. Eastern Europe

        8.3.5. South Asia and Pacific

        8.3.6. East Asia

        8.3.7. Middle East and Africa

    8.4. Market Attractiveness Analysis By Region

9. North America Market Analysis 2019 to 2023 and Forecast 2024 to 2034, By Country

    9.1. Historical Market Size Value (US$ Million) Trend Analysis By Market Taxonomy, 2019 to 2023

    9.2. Market Size Value (US$ Million) Forecast By Market Taxonomy, 2024 to 2034

        9.2.1. By Country

            9.2.1.1. USA

            9.2.1.2. Canada

        9.2.2. By Service

        9.2.3. By Gender

        9.2.4. By Age

    9.3. Market Attractiveness Analysis

        9.3.1. By Country

        9.3.2. By Service

        9.3.3. By Gender

        9.3.4. By Age

    9.4. Key Takeaways

10. Latin America Market Analysis 2019 to 2023 and Forecast 2024 to 2034, By Country

    10.1. Historical Market Size Value (US$ Million) Trend Analysis By Market Taxonomy, 2019 to 2023

    10.2. Market Size Value (US$ Million) Forecast By Market Taxonomy, 2024 to 2034

        10.2.1. By Country

            10.2.1.1. Brazil

            10.2.1.2. Mexico

            10.2.1.3. Rest of Latin America

        10.2.2. By Service

        10.2.3. By Gender

        10.2.4. By Age

    10.3. Market Attractiveness Analysis

        10.3.1. By Country

        10.3.2. By Service

        10.3.3. By Gender

        10.3.4. By Age

    10.4. Key Takeaways

11. Western Europe Market Analysis 2019 to 2023 and Forecast 2024 to 2034, By Country

    11.1. Historical Market Size Value (US$ Million) Trend Analysis By Market Taxonomy, 2019 to 2023

    11.2. Market Size Value (US$ Million) Forecast By Market Taxonomy, 2024 to 2034

        11.2.1. By Country

            11.2.1.1. Germany

            11.2.1.2. UK

            11.2.1.3. France

            11.2.1.4. Spain

            11.2.1.5. Italy

            11.2.1.6. Rest of Western Europe

        11.2.2. By Service

        11.2.3. By Gender

        11.2.4. By Age

    11.3. Market Attractiveness Analysis

        11.3.1. By Country

        11.3.2. By Service

        11.3.3. By Gender

        11.3.4. By Age

    11.4. Key Takeaways

12. Eastern Europe Market Analysis 2019 to 2023 and Forecast 2024 to 2034, By Country

    12.1. Historical Market Size Value (US$ Million) Trend Analysis By Market Taxonomy, 2019 to 2023

    12.2. Market Size Value (US$ Million) Forecast By Market Taxonomy, 2024 to 2034

        12.2.1. By Country

            12.2.1.1. Poland

            12.2.1.2. Russia

            12.2.1.3. Czech Republic

            12.2.1.4. Romania

            12.2.1.5. Rest of Eastern Europe

        12.2.2. By Service

        12.2.3. By Gender

        12.2.4. By Age

    12.3. Market Attractiveness Analysis

        12.3.1. By Country

        12.3.2. By Service

        12.3.3. By Gender

        12.3.4. By Age

    12.4. Key Takeaways

13. South Asia and Pacific Market Analysis 2019 to 2023 and Forecast 2024 to 2034, By Country

    13.1. Historical Market Size Value (US$ Million) Trend Analysis By Market Taxonomy, 2019 to 2023

    13.2. Market Size Value (US$ Million) Forecast By Market Taxonomy, 2024 to 2034

        13.2.1. By Country

            13.2.1.1. India

            13.2.1.2. Bangladesh

            13.2.1.3. Australia

            13.2.1.4. New Zealand

            13.2.1.5. Rest of South Asia and Pacific

        13.2.2. By Service

        13.2.3. By Gender

        13.2.4. By Age

    13.3. Market Attractiveness Analysis

        13.3.1. By Country

        13.3.2. By Service

        13.3.3. By Gender

        13.3.4. By Age

    13.4. Key Takeaways

14. East Asia Market Analysis 2019 to 2023 and Forecast 2024 to 2034, By Country

    14.1. Historical Market Size Value (US$ Million) Trend Analysis By Market Taxonomy, 2019 to 2023

    14.2. Market Size Value (US$ Million) Forecast By Market Taxonomy, 2024 to 2034

        14.2.1. By Country

            14.2.1.1. China

            14.2.1.2. Japan

            14.2.1.3. South Korea

        14.2.2. By Service

        14.2.3. By Gender

        14.2.4. By Age

    14.3. Market Attractiveness Analysis

        14.3.1. By Country

        14.3.2. By Service

        14.3.3. By Gender

        14.3.4. By Age

    14.4. Key Takeaways

15. Middle East and Africa Market Analysis 2019 to 2023 and Forecast 2024 to 2034, By Country

    15.1. Historical Market Size Value (US$ Million) Trend Analysis By Market Taxonomy, 2019 to 2023

    15.2. Market Size Value (US$ Million) Forecast By Market Taxonomy, 2024 to 2034

        15.2.1. By Country

            15.2.1.1. GCC Countries

            15.2.1.2. South Africa

            15.2.1.3. Israel

            15.2.1.4. Rest of MEA

        15.2.2. By Service

        15.2.3. By Gender

        15.2.4. By Age

    15.3. Market Attractiveness Analysis

        15.3.1. By Country

        15.3.2. By Service

        15.3.3. By Gender

        15.3.4. By Age

    15.4. Key Takeaways

16. Key Countries Market Analysis

    16.1. USA

        16.1.1. Market Share Analysis, 2023

            16.1.1.1. By Service

            16.1.1.2. By Gender

            16.1.1.3. By Age

    16.2. Canada

        16.2.1. Market Share Analysis, 2023

            16.2.1.1. By Service

            16.2.1.2. By Gender

            16.2.1.3. By Age

    16.3. Brazil

        16.3.1. Market Share Analysis, 2023

            16.3.1.1. By Service

            16.3.1.2. By Gender

            16.3.1.3. By Age

    16.4. Mexico

        16.4.1. Market Share Analysis, 2023

            16.4.1.1. By Service

            16.4.1.2. By Gender

            16.4.1.3. By Age

    16.5. Germany

        16.5.1. Market Share Analysis, 2023

            16.5.1.1. By Service

            16.5.1.2. By Gender

            16.5.1.3. By Age

    16.6. UK

        16.6.1. Market Share Analysis, 2023

            16.6.1.1. By Service

            16.6.1.2. By Gender

            16.6.1.3. By Age

    16.7. France

        16.7.1. Market Share Analysis, 2023

            16.7.1.1. By Service

            16.7.1.2. By Gender

            16.7.1.3. By Age

    16.8. Spain

        16.8.1. Market Share Analysis, 2023

            16.8.1.1. By Service

            16.8.1.2. By Gender

            16.8.1.3. By Age

    16.9. Italy

        16.9.1. Market Share Analysis, 2023

            16.9.1.1. By Service

            16.9.1.2. By Gender

            16.9.1.3. By Age

    16.10. Poland

        16.10.1. Market Share Analysis, 2023

            16.10.1.1. By Service

            16.10.1.2. By Gender

            16.10.1.3. By Age

    16.11. Russia

        16.11.1. Market Share Analysis, 2023

            16.11.1.1. By Service

            16.11.1.2. By Gender

            16.11.1.3. By Age

    16.12. Czech Republic

        16.12.1. Market Share Analysis, 2023

            16.12.1.1. By Service

            16.12.1.2. By Gender

            16.12.1.3. By Age

    16.13. Romania

        16.13.1. Market Share Analysis, 2023

            16.13.1.1. By Service

            16.13.1.2. By Gender

            16.13.1.3. By Age

    16.14. India

        16.14.1. Market Share Analysis, 2023

            16.14.1.1. By Service

            16.14.1.2. By Gender

            16.14.1.3. By Age

    16.15. Bangladesh

        16.15.1. Market Share Analysis, 2023

            16.15.1.1. By Service

            16.15.1.2. By Gender

            16.15.1.3. By Age

    16.16. Australia

        16.16.1. Market Share Analysis, 2023

            16.16.1.1. By Service

            16.16.1.2. By Gender

            16.16.1.3. By Age

    16.17. New Zealand

        16.17.1. Market Share Analysis, 2023

            16.17.1.1. By Service

            16.17.1.2. By Gender

            16.17.1.3. By Age

    16.18. China

        16.18.1. Market Share Analysis, 2023

            16.18.1.1. By Service

            16.18.1.2. By Gender

            16.18.1.3. By Age

    16.19. Japan

        16.19.1. Market Share Analysis, 2023

            16.19.1.1. By Service

            16.19.1.2. By Gender

            16.19.1.3. By Age

    16.20. South Korea

        16.20.1. Market Share Analysis, 2023

            16.20.1.1. By Service

            16.20.1.2. By Gender

            16.20.1.3. By Age

    16.21. GCC Countries

        16.21.1. Market Share Analysis, 2023

            16.21.1.1. By Service

            16.21.1.2. By Gender

            16.21.1.3. By Age

    16.22. South Africa

        16.22.1. Market Share Analysis, 2023

            16.22.1.1. By Service

            16.22.1.2. By Gender

            16.22.1.3. By Age

    16.23. Israel

        16.23.1. Market Share Analysis, 2023

            16.23.1.1. By Service

            16.23.1.2. By Gender

            16.23.1.3. By Age

17. Market Structure Analysis

    17.1. Competition Dashboard

    17.2. Competition Benchmarking

    17.3. Market Share Analysis of Top Players

        17.3.1. By Regional

        17.3.2. By Service

        17.3.3. By Gender

        17.3.4. By Age

18. Competition Analysis

    18.1. Competition Deep Dive

        18.1.1. Chic La Vie

            18.1.1.1. Overview

            18.1.1.2. Product Portfolio

            18.1.1.3. Profitability by Market Segments

            18.1.1.4. Sales Footprint

            18.1.1.5. Strategy Overview

                18.1.1.5.1. Marketing Strategy

        18.1.2. Clinique La Prairie

            18.1.2.1. Overview

            18.1.2.2. Product Portfolio

            18.1.2.3. Profitability by Market Segments

            18.1.2.4. Sales Footprint

            18.1.2.5. Strategy Overview

                18.1.2.5.1. Marketing Strategy

        18.1.3. Kurotel - Longevity Medical Center and Spa

            18.1.3.1. Overview

            18.1.3.2. Product Portfolio

            18.1.3.3. Profitability by Market Segments

            18.1.3.4. Sales Footprint

            18.1.3.5. Strategy Overview

                18.1.3.5.1. Marketing Strategy

        18.1.4. Lanserhof Lans

            18.1.4.1. Overview

            18.1.4.2. Product Portfolio

            18.1.4.3. Profitability by Market Segments

            18.1.4.4. Sales Footprint

            18.1.4.5. Strategy Overview

                18.1.4.5.1. Marketing Strategy

        18.1.5. The Orchard Wellness Resort

            18.1.5.1. Overview

            18.1.5.2. Product Portfolio

            18.1.5.3. Profitability by Market Segments

            18.1.5.4. Sales Footprint

            18.1.5.5. Strategy Overview

                18.1.5.5.1. Marketing Strategy

        18.1.6. Biovital Medspa

            18.1.6.1. Overview

            18.1.6.2. Product Portfolio

            18.1.6.3. Profitability by Market Segments

            18.1.6.4. Sales Footprint

            18.1.6.5. Strategy Overview

                18.1.6.5.1. Marketing Strategy

        18.1.7. Allure Medspa

            18.1.7.1. Overview

            18.1.7.2. Product Portfolio

            18.1.7.3. Profitability by Market Segments

            18.1.7.4. Sales Footprint

            18.1.7.5. Strategy Overview

                18.1.7.5.1. Marketing Strategy

        18.1.8. Longevity Wellness Worldwide

            18.1.8.1. Overview

            18.1.8.2. Product Portfolio

            18.1.8.3. Profitability by Market Segments

            18.1.8.4. Sales Footprint

            18.1.8.5. Strategy Overview

                18.1.8.5.1. Marketing Strategy

        18.1.9. Serenity Medspa

            18.1.9.1. Overview

            18.1.9.2. Product Portfolio

            18.1.9.3. Profitability by Market Segments

            18.1.9.4. Sales Footprint

            18.1.9.5. Strategy Overview

                18.1.9.5.1. Marketing Strategy

        18.1.10. Bijoux Medi-Spa

            18.1.10.1. Overview

            18.1.10.2. Product Portfolio

            18.1.10.3. Profitability by Market Segments

            18.1.10.4. Sales Footprint

            18.1.10.5. Strategy Overview

                18.1.10.5.1. Marketing Strategy

        18.1.11. Vichy Celestins Spa Hotel

            18.1.11.1. Overview

            18.1.11.2. Product Portfolio

            18.1.11.3. Profitability by Market Segments

            18.1.11.4. Sales Footprint

            18.1.11.5. Strategy Overview

                18.1.11.5.1. Marketing Strategy

19. Assumptions & Acronyms Used

20. Research Methodology

List of Tables

Table 1: Global Market Value (US$ Million) Forecast by Region, 2019 to 2034

Table 2: Global Market Value (US$ Million) Forecast by Service, 2019 to 2034

Table 3: Global Market Value (US$ Million) Forecast by Gender, 2019 to 2034

Table 4: Global Market Value (US$ Million) Forecast by Age, 2019 to 2034

Table 5: North America Market Value (US$ Million) Forecast by Country, 2019 to 2034

Table 6: North America Market Value (US$ Million) Forecast by Service, 2019 to 2034

Table 7: North America Market Value (US$ Million) Forecast by Gender, 2019 to 2034

Table 8: North America Market Value (US$ Million) Forecast by Age, 2019 to 2034

Table 9: Latin America Market Value (US$ Million) Forecast by Country, 2019 to 2034

Table 10: Latin America Market Value (US$ Million) Forecast by Service, 2019 to 2034

Table 11: Latin America Market Value (US$ Million) Forecast by Gender, 2019 to 2034

Table 12: Latin America Market Value (US$ Million) Forecast by Age, 2019 to 2034

Table 13: Western Europe Market Value (US$ Million) Forecast by Country, 2019 to 2034

Table 14: Western Europe Market Value (US$ Million) Forecast by Service, 2019 to 2034

Table 15: Western Europe Market Value (US$ Million) Forecast by Gender, 2019 to 2034

Table 16: Western Europe Market Value (US$ Million) Forecast by Age, 2019 to 2034

Table 17: Eastern Europe Market Value (US$ Million) Forecast by Country, 2019 to 2034

Table 18: Eastern Europe Market Value (US$ Million) Forecast by Service, 2019 to 2034

Table 19: Eastern Europe Market Value (US$ Million) Forecast by Gender, 2019 to 2034

Table 20: Eastern Europe Market Value (US$ Million) Forecast by Age, 2019 to 2034

Table 21: South Asia and Pacific Market Value (US$ Million) Forecast by Country, 2019 to 2034

Table 22: South Asia and Pacific Market Value (US$ Million) Forecast by Service, 2019 to 2034

Table 23: South Asia and Pacific Market Value (US$ Million) Forecast by Gender, 2019 to 2034

Table 24: South Asia and Pacific Market Value (US$ Million) Forecast by Age, 2019 to 2034

Table 25: East Asia Market Value (US$ Million) Forecast by Country, 2019 to 2034

Table 26: East Asia Market Value (US$ Million) Forecast by Service, 2019 to 2034

Table 27: East Asia Market Value (US$ Million) Forecast by Gender, 2019 to 2034

Table 28: East Asia Market Value (US$ Million) Forecast by Age, 2019 to 2034

Table 29: Middle East and Africa Market Value (US$ Million) Forecast by Country, 2019 to 2034

Table 30: Middle East and Africa Market Value (US$ Million) Forecast by Service, 2019 to 2034

Table 31: Middle East and Africa Market Value (US$ Million) Forecast by Gender, 2019 to 2034

Table 32: Middle East and Africa Market Value (US$ Million) Forecast by Age, 2019 to 2034

List of Charts

Figure 1: Global Market Value (US$ Million) by Service, 2024 to 2034

Figure 2: Global Market Value (US$ Million) by Gender, 2024 to 2034

Figure 3: Global Market Value (US$ Million) by Age, 2024 to 2034

Figure 4: Global Market Value (US$ Million) by Region, 2024 to 2034

Figure 5: Global Market Value (US$ Million) Analysis by Region, 2019 to 2034

Figure 6: Global Market Value Share (%) and BPS Analysis by Region, 2024 to 2034

Figure 7: Global Market Y-o-Y Growth (%) Projections by Region, 2024 to 2034

Figure 8: Global Market Value (US$ Million) Analysis by Service, 2019 to 2034

Figure 9: Global Market Value Share (%) and BPS Analysis by Service, 2024 to 2034

Figure 10: Global Market Y-o-Y Growth (%) Projections by Service, 2024 to 2034

Figure 11: Global Market Value (US$ Million) Analysis by Gender, 2019 to 2034

Figure 12: Global Market Value Share (%) and BPS Analysis by Gender, 2024 to 2034

Figure 13: Global Market Y-o-Y Growth (%) Projections by Gender, 2024 to 2034

Figure 14: Global Market Value (US$ Million) Analysis by Age, 2019 to 2034

Figure 15: Global Market Value Share (%) and BPS Analysis by Age, 2024 to 2034

Figure 16: Global Market Y-o-Y Growth (%) Projections by Age, 2024 to 2034

Figure 17: Global Market Attractiveness by Service, 2024 to 2034

Figure 18: Global Market Attractiveness by Gender, 2024 to 2034

Figure 19: Global Market Attractiveness by Age, 2024 to 2034

Figure 20: Global Market Attractiveness by Region, 2024 to 2034

Figure 21: North America Market Value (US$ Million) by Service, 2024 to 2034

Figure 22: North America Market Value (US$ Million) by Gender, 2024 to 2034

Figure 23: North America Market Value (US$ Million) by Age, 2024 to 2034

Figure 24: North America Market Value (US$ Million) by Country, 2024 to 2034

Figure 25: North America Market Value (US$ Million) Analysis by Country, 2019 to 2034

Figure 26: North America Market Value Share (%) and BPS Analysis by Country, 2024 to 2034

Figure 27: North America Market Y-o-Y Growth (%) Projections by Country, 2024 to 2034

Figure 28: North America Market Value (US$ Million) Analysis by Service, 2019 to 2034

Figure 29: North America Market Value Share (%) and BPS Analysis by Service, 2024 to 2034

Figure 30: North America Market Y-o-Y Growth (%) Projections by Service, 2024 to 2034

Figure 31: North America Market Value (US$ Million) Analysis by Gender, 2019 to 2034

Figure 32: North America Market Value Share (%) and BPS Analysis by Gender, 2024 to 2034

Figure 33: North America Market Y-o-Y Growth (%) Projections by Gender, 2024 to 2034

Figure 34: North America Market Value (US$ Million) Analysis by Age, 2019 to 2034

Figure 35: North America Market Value Share (%) and BPS Analysis by Age, 2024 to 2034

Figure 36: North America Market Y-o-Y Growth (%) Projections by Age, 2024 to 2034

Figure 37: North America Market Attractiveness by Service, 2024 to 2034

Figure 38: North America Market Attractiveness by Gender, 2024 to 2034

Figure 39: North America Market Attractiveness by Age, 2024 to 2034

Figure 40: North America Market Attractiveness by Country, 2024 to 2034

Figure 41: Latin America Market Value (US$ Million) by Service, 2024 to 2034

Figure 42: Latin America Market Value (US$ Million) by Gender, 2024 to 2034

Figure 43: Latin America Market Value (US$ Million) by Age, 2024 to 2034

Figure 44: Latin America Market Value (US$ Million) by Country, 2024 to 2034

Figure 45: Latin America Market Value (US$ Million) Analysis by Country, 2019 to 2034

Figure 46: Latin America Market Value Share (%) and BPS Analysis by Country, 2024 to 2034

Figure 47: Latin America Market Y-o-Y Growth (%) Projections by Country, 2024 to 2034

Figure 48: Latin America Market Value (US$ Million) Analysis by Service, 2019 to 2034

Figure 49: Latin America Market Value Share (%) and BPS Analysis by Service, 2024 to 2034

Figure 50: Latin America Market Y-o-Y Growth (%) Projections by Service, 2024 to 2034

Figure 51: Latin America Market Value (US$ Million) Analysis by Gender, 2019 to 2034

Figure 52: Latin America Market Value Share (%) and BPS Analysis by Gender, 2024 to 2034

Figure 53: Latin America Market Y-o-Y Growth (%) Projections by Gender, 2024 to 2034

Figure 54: Latin America Market Value (US$ Million) Analysis by Age, 2019 to 2034

Figure 55: Latin America Market Value Share (%) and BPS Analysis by Age, 2024 to 2034

Figure 56: Latin America Market Y-o-Y Growth (%) Projections by Age, 2024 to 2034

Figure 57: Latin America Market Attractiveness by Service, 2024 to 2034

Figure 58: Latin America Market Attractiveness by Gender, 2024 to 2034

Figure 59: Latin America Market Attractiveness by Age, 2024 to 2034

Figure 60: Latin America Market Attractiveness by Country, 2024 to 2034

Figure 61: Western Europe Market Value (US$ Million) by Service, 2024 to 2034

Figure 62: Western Europe Market Value (US$ Million) by Gender, 2024 to 2034

Figure 63: Western Europe Market Value (US$ Million) by Age, 2024 to 2034

Figure 64: Western Europe Market Value (US$ Million) by Country, 2024 to 2034

Figure 65: Western Europe Market Value (US$ Million) Analysis by Country, 2019 to 2034

Figure 66: Western Europe Market Value Share (%) and BPS Analysis by Country, 2024 to 2034

Figure 67: Western Europe Market Y-o-Y Growth (%) Projections by Country, 2024 to 2034

Figure 68: Western Europe Market Value (US$ Million) Analysis by Service, 2019 to 2034

Figure 69: Western Europe Market Value Share (%) and BPS Analysis by Service, 2024 to 2034

Figure 70: Western Europe Market Y-o-Y Growth (%) Projections by Service, 2024 to 2034

Figure 71: Western Europe Market Value (US$ Million) Analysis by Gender, 2019 to 2034

Figure 72: Western Europe Market Value Share (%) and BPS Analysis by Gender, 2024 to 2034

Figure 73: Western Europe Market Y-o-Y Growth (%) Projections by Gender, 2024 to 2034

Figure 74: Western Europe Market Value (US$ Million) Analysis by Age, 2019 to 2034

Figure 75: Western Europe Market Value Share (%) and BPS Analysis by Age, 2024 to 2034

Figure 76: Western Europe Market Y-o-Y Growth (%) Projections by Age, 2024 to 2034

Figure 77: Western Europe Market Attractiveness by Service, 2024 to 2034

Figure 78: Western Europe Market Attractiveness by Gender, 2024 to 2034

Figure 79: Western Europe Market Attractiveness by Age, 2024 to 2034

Figure 80: Western Europe Market Attractiveness by Country, 2024 to 2034

Figure 81: Eastern Europe Market Value (US$ Million) by Service, 2024 to 2034

Figure 82: Eastern Europe Market Value (US$ Million) by Gender, 2024 to 2034

Figure 83: Eastern Europe Market Value (US$ Million) by Age, 2024 to 2034

Figure 84: Eastern Europe Market Value (US$ Million) by Country, 2024 to 2034

Figure 85: Eastern Europe Market Value (US$ Million) Analysis by Country, 2019 to 2034

Figure 86: Eastern Europe Market Value Share (%) and BPS Analysis by Country, 2024 to 2034

Figure 87: Eastern Europe Market Y-o-Y Growth (%) Projections by Country, 2024 to 2034

Figure 88: Eastern Europe Market Value (US$ Million) Analysis by Service, 2019 to 2034

Figure 89: Eastern Europe Market Value Share (%) and BPS Analysis by Service, 2024 to 2034

Figure 90: Eastern Europe Market Y-o-Y Growth (%) Projections by Service, 2024 to 2034

Figure 91: Eastern Europe Market Value (US$ Million) Analysis by Gender, 2019 to 2034

Figure 92: Eastern Europe Market Value Share (%) and BPS Analysis by Gender, 2024 to 2034

Figure 93: Eastern Europe Market Y-o-Y Growth (%) Projections by Gender, 2024 to 2034

Figure 94: Eastern Europe Market Value (US$ Million) Analysis by Age, 2019 to 2034

Figure 95: Eastern Europe Market Value Share (%) and BPS Analysis by Age, 2024 to 2034

Figure 96: Eastern Europe Market Y-o-Y Growth (%) Projections by Age, 2024 to 2034

Figure 97: Eastern Europe Market Attractiveness by Service, 2024 to 2034

Figure 98: Eastern Europe Market Attractiveness by Gender, 2024 to 2034

Figure 99: Eastern Europe Market Attractiveness by Age, 2024 to 2034

Figure 100: Eastern Europe Market Attractiveness by Country, 2024 to 2034

Figure 101: South Asia and Pacific Market Value (US$ Million) by Service, 2024 to 2034

Figure 102: South Asia and Pacific Market Value (US$ Million) by Gender, 2024 to 2034

Figure 103: South Asia and Pacific Market Value (US$ Million) by Age, 2024 to 2034

Figure 104: South Asia and Pacific Market Value (US$ Million) by Country, 2024 to 2034

Figure 105: South Asia and Pacific Market Value (US$ Million) Analysis by Country, 2019 to 2034

Figure 106: South Asia and Pacific Market Value Share (%) and BPS Analysis by Country, 2024 to 2034

Figure 107: South Asia and Pacific Market Y-o-Y Growth (%) Projections by Country, 2024 to 2034

Figure 108: South Asia and Pacific Market Value (US$ Million) Analysis by Service, 2019 to 2034

Figure 109: South Asia and Pacific Market Value Share (%) and BPS Analysis by Service, 2024 to 2034

Figure 110: South Asia and Pacific Market Y-o-Y Growth (%) Projections by Service, 2024 to 2034

Figure 111: South Asia and Pacific Market Value (US$ Million) Analysis by Gender, 2019 to 2034

Figure 112: South Asia and Pacific Market Value Share (%) and BPS Analysis by Gender, 2024 to 2034

Figure 113: South Asia and Pacific Market Y-o-Y Growth (%) Projections by Gender, 2024 to 2034

Figure 114: South Asia and Pacific Market Value (US$ Million) Analysis by Age, 2019 to 2034

Figure 115: South Asia and Pacific Market Value Share (%) and BPS Analysis by Age, 2024 to 2034

Figure 116: South Asia and Pacific Market Y-o-Y Growth (%) Projections by Age, 2024 to 2034

Figure 117: South Asia and Pacific Market Attractiveness by Service, 2024 to 2034

Figure 118: South Asia and Pacific Market Attractiveness by Gender, 2024 to 2034

Figure 119: South Asia and Pacific Market Attractiveness by Age, 2024 to 2034

Figure 120: South Asia and Pacific Market Attractiveness by Country, 2024 to 2034

Figure 121: East Asia Market Value (US$ Million) by Service, 2024 to 2034

Figure 122: East Asia Market Value (US$ Million) by Gender, 2024 to 2034

Figure 123: East Asia Market Value (US$ Million) by Age, 2024 to 2034

Figure 124: East Asia Market Value (US$ Million) by Country, 2024 to 2034

Figure 125: East Asia Market Value (US$ Million) Analysis by Country, 2019 to 2034

Figure 126: East Asia Market Value Share (%) and BPS Analysis by Country, 2024 to 2034

Figure 127: East Asia Market Y-o-Y Growth (%) Projections by Country, 2024 to 2034

Figure 128: East Asia Market Value (US$ Million) Analysis by Service, 2019 to 2034

Figure 129: East Asia Market Value Share (%) and BPS Analysis by Service, 2024 to 2034

Figure 130: East Asia Market Y-o-Y Growth (%) Projections by Service, 2024 to 2034

Figure 131: East Asia Market Value (US$ Million) Analysis by Gender, 2019 to 2034

Figure 132: East Asia Market Value Share (%) and BPS Analysis by Gender, 2024 to 2034

Figure 133: East Asia Market Y-o-Y Growth (%) Projections by Gender, 2024 to 2034

Figure 134: East Asia Market Value (US$ Million) Analysis by Age, 2019 to 2034

Figure 135: East Asia Market Value Share (%) and BPS Analysis by Age, 2024 to 2034

Figure 136: East Asia Market Y-o-Y Growth (%) Projections by Age, 2024 to 2034

Figure 137: East Asia Market Attractiveness by Service, 2024 to 2034

Figure 138: East Asia Market Attractiveness by Gender, 2024 to 2034

Figure 139: East Asia Market Attractiveness by Age, 2024 to 2034

Figure 140: East Asia Market Attractiveness by Country, 2024 to 2034

Figure 141: Middle East and Africa Market Value (US$ Million) by Service, 2024 to 2034

Figure 142: Middle East and Africa Market Value (US$ Million) by Gender, 2024 to 2034

Figure 143: Middle East and Africa Market Value (US$ Million) by Age, 2024 to 2034

Figure 144: Middle East and Africa Market Value (US$ Million) by Country, 2024 to 2034

Figure 145: Middle East and Africa Market Value (US$ Million) Analysis by Country, 2019 to 2034

Figure 146: Middle East and Africa Market Value Share (%) and BPS Analysis by Country, 2024 to 2034

Figure 147: Middle East and Africa Market Y-o-Y Growth (%) Projections by Country, 2024 to 2034

Figure 148: Middle East and Africa Market Value (US$ Million) Analysis by Service, 2019 to 2034

Figure 149: Middle East and Africa Market Value Share (%) and BPS Analysis by Service, 2024 to 2034

Figure 150: Middle East and Africa Market Y-o-Y Growth (%) Projections by Service, 2024 to 2034

Figure 151: Middle East and Africa Market Value (US$ Million) Analysis by Gender, 2019 to 2034

Figure 152: Middle East and Africa Market Value Share (%) and BPS Analysis by Gender, 2024 to 2034

Figure 153: Middle East and Africa Market Y-o-Y Growth (%) Projections by Gender, 2024 to 2034

Figure 154: Middle East and Africa Market Value (US$ Million) Analysis by Age, 2019 to 2034

Figure 155: Middle East and Africa Market Value Share (%) and BPS Analysis by Age, 2024 to 2034

Figure 156: Middle East and Africa Market Y-o-Y Growth (%) Projections by Age, 2024 to 2034

Figure 157: Middle East and Africa Market Attractiveness by Service, 2024 to 2034

Figure 158: Middle East and Africa Market Attractiveness by Gender, 2024 to 2034

Figure 159: Middle East and Africa Market Attractiveness by Age, 2024 to 2034

Figure 160: Middle East and Africa Market Attractiveness by Country, 2024 to 2034

Recommendations

Travel and Tourism

Spa Resorts Market

Published : July 2023

Travel and Tourism

Spa Services Market

Published : October 2022

Explore Healthcare Insights

View Reports