The medical display market is experiencing consistent expansion, supported by the increasing adoption of advanced visualization technologies in diagnostic imaging, surgery, and clinical review applications. Rising demand for precision imaging, coupled with the digitalization of healthcare infrastructure, has accelerated product deployment across hospitals and specialty clinics.
The integration of high-resolution panels with superior luminance and contrast performance enables enhanced diagnostic accuracy, especially in modalities such as radiology and pathology. Manufacturers are focusing on ergonomic designs, improved calibration software, and energy-efficient components to meet stringent healthcare standards.
The ongoing transition toward multi-modality imaging and hybrid operating rooms continues to drive adoption globally. With technological advancements improving color uniformity and image stability, the market outlook remains favorable, reinforced by the increasing prevalence of chronic diseases and expanding telemedicine practices that demand reliable display quality for remote diagnostics.
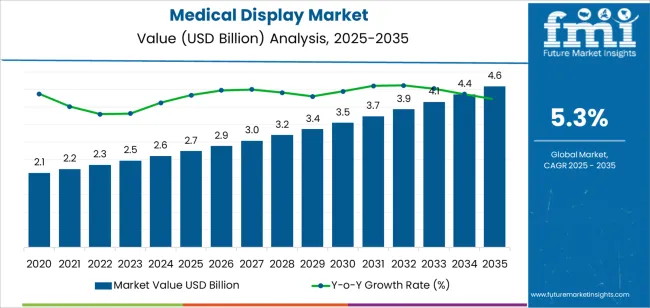
| Metric | Value |
|---|---|
| Medical Display Market Estimated Value in (2025 E) | USD 2.7 billion |
| Medical Display Market Forecast Value in (2035 F) | USD 4.6 billion |
| Forecast CAGR (2025 to 2035) | 5.3% |
The market is segmented by Device, Panel Size, Resolution, and Application and region. By Device, the market is divided into Desktop, Mobile, and All In One. In terms of Panel Size, the market is classified into 27.0 To 41.9 Inches, Up To 22.9 Inches, 23.0 To 26.9 Inches, and Above 42 Inches. Based on Resolution, the market is segmented into 2.1 To 4 Mp, Up To 2 Mp, 4.1 To 8 Mp, and Above 8 Mp. By Application, the market is divided into Radiology, Multi-Modality, Digital Pathology, Surgical, and Mammography. Regionally, the market is classified into North America, Latin America, Western Europe, Eastern Europe, Balkan & Baltic Countries, Russia & Belarus, Central Asia, East Asia, South Asia & Pacific, and the Middle East & Africa.
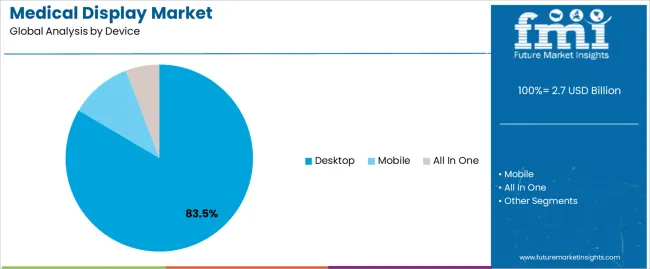
The desktop segment dominates the device category with approximately 83.50% share, reflecting its broad integration across diagnostic departments and clinical review settings. Its popularity is supported by ergonomic flexibility, cost-effectiveness, and ease of maintenance compared to larger mobile or wall-mounted displays.
Desktop medical displays are widely used in radiology, mammography, and dental imaging, providing high brightness and color consistency necessary for accurate diagnosis. The segment benefits from technological enhancements, including anti-reflective coatings and automated luminance stabilization, ensuring long-term reliability in hospital environments.
With healthcare facilities increasingly digitizing imaging workflows and focusing on high-throughput diagnostics, the desktop segment is expected to sustain its leadership position through continued upgrades in resolution and performance capabilities.
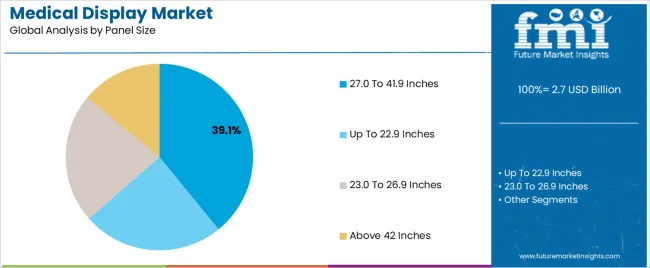
The 27.0 to 41.9 inches segment holds approximately 39.10% share of the panel size category, driven by its suitability for high-detail visualization in surgical and radiology applications. Displays within this size range offer an optimal balance between viewing comfort and spatial efficiency, allowing for improved collaboration during medical procedures.
The segment benefits from increased adoption of large-screen, high-brightness displays that enhance multi-image comparison and real-time visualization. Ongoing innovation in LED backlighting and panel calibration technologies has improved brightness uniformity and energy efficiency, further promoting usage.
With rising emphasis on visual accuracy in advanced surgical theaters and diagnostic centers, the 27.0 to 41.9 inches segment is projected to maintain steady growth in the forecast period.
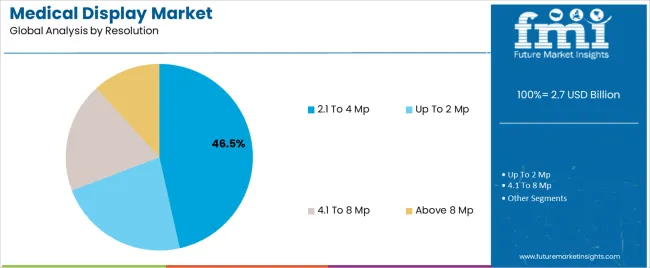
The 2.1 to 4 MP segment accounts for approximately 46.50% share in the resolution category, supported by its balance of image clarity, cost efficiency, and compatibility across various medical imaging modalities. This resolution range is well-suited for clinical review, endoscopy, and general diagnostics, where precise visualization is required without excessive data processing load.
Manufacturers are optimizing these panels with advanced grayscale rendering and DICOM calibration features to enhance diagnostic confidence. The segment’s dominance is reinforced by its widespread acceptance in both new installations and replacement cycles.
With healthcare institutions emphasizing display standardization and reliable performance, the 2.1 to 4 MP segment is expected to continue leading adoption in the coming years.
Developing Dual-modality Displays for Hybrid Imaging Presents Opportunities for Manufacturers
Medical display manufacturers have an exceptional opportunity to create displays, especially for dual-modality imaging applications like PET-CT or PET-MRI. These medical screens improve diagnosis accuracy in advanced imaging situations by seamlessly combining and presenting data from different imaging modalities.
This chance to specialize can fulfill the specific requirements of medical professionals in advanced diagnostics and oncology. Businesses in the medical display industry can advertise themselves as suppliers of critical instruments for precision diagnosis in intricate medical circumstances by offering displays designed for hybrid imaging.
Demand for Higher Resolution and 3D Imaging Capabilities Rises in the Market
Improvements in patient outcomes and diagnostic accuracy drive demand for medical displays with greater resolution and 3D imaging capabilities. Investing in cutting-edge display systems gives healthcare organizations a competitive advantage in providing excellent medical imaging services.
By allowing medical professionals to see minute details in medical pictures, these displays have a strong value proposition and help doctors make more accurate diagnoses and customized treatment regimens.
In order to take advantage of the increasing demand for cutting-edge imaging solutions, producers that can create and distribute high-resolution, 3D-capable medical displays are expected to expand their market share.
Incorporating Advanced Eye-tracking Technologies Revolutionizes Healthcare Landscape
In order to better comprehend and optimize user interactions in diagnostic and research applications, medical imaging displays have integrated cutting-edge eye-tracking technology. Businesses that follow this approach present their displays as instruments for a comprehensive investigation of diagnostic decision-making procedures.
By using eye-tracking technology, medical display manufacturers can offer useful information about how people focus their attention visually while interpreting medical images.
This trend positions enterprises as leaders in increasing the scientific knowledge of healthcare diagnostic procedures, in line with the industry's pursuit of technologies that improve research capacity and advance the understanding of visual cognition in medical contexts.
| Attributes | Details |
|---|---|
| Trends |
|
| Opportunities |
|
| Challenges |
|
| Segment | Desktop (Device) |
|---|---|
| Value CAGR (2025 to 2035) | 5.0% |
Based on device, the desktop segment is projected to thrive at a 5.0% CAGR through 2035.
| Segment | 22.9 Inches (Panel Size) |
|---|---|
| Value CAGR (2025 to 2035) | 4.8% |
Based on panel size, the 22.9 inches segment is anticipated to thrive at a 4.8% CAGR through 2035.
| Countries | Value CAGR (2025 to 2035) |
|---|---|
| United States | 5.6% |
| United Kingdom | 4.3% |
| China | 6.0% |
| Japan | 6.5% |
| South Korea | 3.1% |
The demand for medical displays in the United States is projected to rise at a 5.6% CAGR through 2035.
The sales of medical displays in the United Kingdom are expected to surge at a 4.3% CAGR through 2035.
The medical display market growth in China is estimated at a 6.0% CAGR through 2035.
The demand for medical displays in Japan is anticipated to expand at a 6.5% CAGR through 2035.
The sales of medical displays in South Korea are expected to increase at a 3.1% CAGR through 2035.
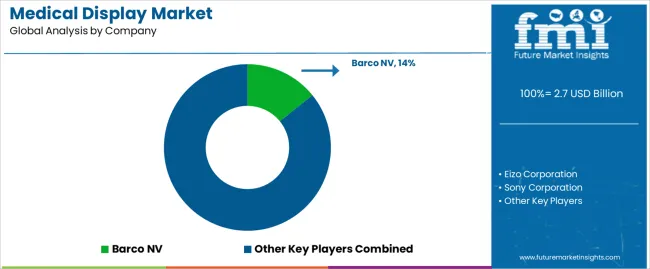
The medical display market is highly competitive, with prominent competitors fighting for market dominance and technical leadership. Established industry giants, such as Barco NV, Eizo Corporation, and Sony Corporation, lead the market by utilizing their diverse product portfolios, global presence, and widespread industry partnerships.
These companies prioritize ongoing innovation, spending extensively in R&D to provide cutting-edge technology such as high-resolution screens, AI integration, and enhanced color calibration to satisfy the changing demands of the healthcare industry.
Recent Developments
The global medical display market is estimated to be valued at USD 2.7 billion in 2025.
The market size for the medical display market is projected to reach USD 4.6 billion by 2035.
The medical display market is expected to grow at a 5.3% CAGR between 2025 and 2035.
The key product types in medical display market are desktop, mobile and all in one.
In terms of panel size, 27.0 to 41.9 inches segment to command 39.1% share in the medical display market in 2025.


Our Research Products

The "Full Research Suite" delivers actionable market intel, deep dives on markets or technologies, so clients act faster, cut risk, and unlock growth.

The Leaderboard benchmarks and ranks top vendors, classifying them as Established Leaders, Leading Challengers, or Disruptors & Challengers.

Locates where complements amplify value and substitutes erode it, forecasting net impact by horizon

We deliver granular, decision-grade intel: market sizing, 5-year forecasts, pricing, adoption, usage, revenue, and operational KPIs—plus competitor tracking, regulation, and value chains—across 60 countries broadly.

Spot the shifts before they hit your P&L. We track inflection points, adoption curves, pricing moves, and ecosystem plays to show where demand is heading, why it is changing, and what to do next across high-growth markets and disruptive tech

Real-time reads of user behavior. We track shifting priorities, perceptions of today’s and next-gen services, and provider experience, then pace how fast tech moves from trial to adoption, blending buyer, consumer, and channel inputs with social signals (#WhySwitch, #UX).

Partner with our analyst team to build a custom report designed around your business priorities. From analysing market trends to assessing competitors or crafting bespoke datasets, we tailor insights to your needs.
Supplier Intelligence
Discovery & Profiling
Capacity & Footprint
Performance & Risk
Compliance & Governance
Commercial Readiness
Who Supplies Whom
Scorecards & Shortlists
Playbooks & Docs
Category Intelligence
Definition & Scope
Demand & Use Cases
Cost Drivers
Market Structure
Supply Chain Map
Trade & Policy
Operating Norms
Deliverables
Buyer Intelligence
Account Basics
Spend & Scope
Procurement Model
Vendor Requirements
Terms & Policies
Entry Strategy
Pain Points & Triggers
Outputs
Pricing Analysis
Benchmarks
Trends
Should-Cost
Indexation
Landed Cost
Commercial Terms
Deliverables
Brand Analysis
Positioning & Value Prop
Share & Presence
Customer Evidence
Go-to-Market
Digital & Reputation
Compliance & Trust
KPIs & Gaps
Outputs
Full Research Suite comprises of:
Market outlook & trends analysis
Interviews & case studies
Strategic recommendations
Vendor profiles & capabilities analysis
5-year forecasts
8 regions and 60+ country-level data splits
Market segment data splits
12 months of continuous data updates
DELIVERED AS:
PDF EXCEL ONLINE
Medical Silicone Radiopaque Vascular Ties Market Size and Share Forecast Outlook 2025 to 2035
Medical Indoor Air Purifier Market Size and Share Forecast Outlook 2025 to 2035
Medical Eye Shield Film Market Size and Share Forecast Outlook 2025 to 2035
Medical Far Infrared Therapy Device Market Size and Share Forecast Outlook 2025 to 2035
Medical Latex Protective Suit Market Size and Share Forecast Outlook 2025 to 2035
Medical Activated Carbon Dressing Market Size and Share Forecast Outlook 2025 to 2035
Medical Coated Roll Stock Market Size and Share Forecast Outlook 2025 to 2035
Medical Billing Outsourcing Market Size and Share Forecast Outlook 2025 to 2035
Medical Pressure Mapping System Market Size and Share Forecast Outlook 2025 to 2035
Medical Chairs Market Size and Share Forecast Outlook 2025 to 2035
Medical Exoskeleton Market Forecast Outlook 2025 to 2035
Medical Spa Market Size and Share Forecast Outlook 2025 to 2035
Medical Face Shield Market Forecast and Outlook 2025 to 2035
Medical Robot Market Size and Share Forecast Outlook 2025 to 2035
Medical Nutrition Market Forecast and Outlook 2025 to 2035
Medical Wax Market Size and Share Forecast Outlook 2025 to 2035
Medical Specialty Bag Market Size and Share Forecast Outlook 2025 to 2035
Medical Plastics Market Size and Share Forecast Outlook 2025 to 2035
Medical Device Tester Market Size and Share Forecast Outlook 2025 to 2035
Medical Device Trays Market Size and Share Forecast Outlook 2025 to 2035

Thank you!
You will receive an email from our Business Development Manager. Please be sure to check your SPAM/JUNK folder too.
Chat With
MaRIA