Microbial Lipids Size and Share Forecast Outlook 2025 to 2035

The microbial lipids market has been projected to reach a valuation of USD 835.6 million in 2025, advancing to USD 1,487.5 million by 2035, marking an absolute increase of USD 651.9 million a near 1.8x growth over the decade. This expansion has been underpinned by a compound annual growth rate (CAGR) of 5.9%, signaling rising industrial validation of microbial lipids as scalable and sustainable alternatives to plant and animal-derived lipids.
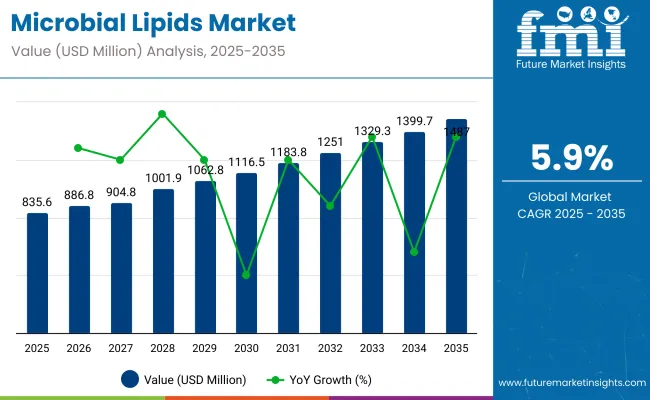
Quick Stats for Microbial Lipids

  • Microbial Lipids Value (2025):USD 835.6 million
  • Microbial Lipids Forecast Value (2035): USD 1,487.0 million
  • Microbial Lipids Forecast CAGR:5.9%
  • Leading Segment in Microbial Lipids in 2025, by Micro-organisms Source:Algae‑Derived Lipids (42%)
  • Key Growth Regions in the Microbial Lipids: North America, Asia-Pacific, Europe
  • Top Key Players in Microbial Lipids:Corbion NV, DSM-Firmenich, Cargill Inc., Ginkgo Bioworks, BASF SE, Roquette Frères, Amyris Inc., TerraVia, and Solazyme

Microbial Lipids Market

Metric Value
Microbial Lipids Estimated Value in (2025E) USD 835.6 million
Microbial Lipids Forecast Value in (2035F) USD 1,487.0 million
Forecast CAGR (2025 to 2035) 5.9%

In the first half of the forecast period (2025 to 2030), the market is expected to rise from approximately USD 835.6 million to USD 1,116.5 million, accounting for 43% of the total decade gain. Early growth has been driven by heightened interest in yeast- and algae-derived lipid formulations for functional foods and omega-3 enriched dietary supplements. Nutritional alignment and traceability advantages have positioned microbial lipids favorably within nutraceutical and vegan nutrition sectors.

From 2030 to 2035, the market is forecasted to accelerate from USD 1,116.5 million to USD 1,487.5 million, contributing the remaining 57% of decade growth. This phase is likely to be shaped by the scaling of synthetic biology applications, emergence of lipid-personalized therapeutics, and deeper integration of microbial lipids in cosmetics and biopharma excipients.

Regional expansion in East Asia and Europe is anticipated, supported by biotech manufacturing clusters and progressive bio-ingredient policies. By 2035, microbial lipid technologies are expected to be embedded within circular production ecosystems, with digital fermentation optimization contributing to both yield efficiency and cost parity.

From 2020 to 2024, the microbial lipids market expanded from USD 610 million to USD 835.6 million, driven primarily by increased demand for algae- and yeast-derived omega-rich oils in dietary supplements and functional foods.

During this period, value capture remained concentrated among integrated fermentation companies controlling over 60% of total revenues. Industry leaders such as Corbion, DSM-Firmenich, and Cargill sustained dominance through patented microbial strains, vertically integrated production, and regulatory expertise across food and pharma sectors. Application-based pricing, high purity yields, and EU/US compliance standards served as core differentiators.

By 2025, the market is projected to cross USD 835.6 million, with downstream integration and bioengineering-led strain development expected to shift the value chain. A growing share of market revenue will be driven by custom lipid profiles, encapsulated delivery formats, and precision fermentation platforms collectively expected to exceed 35% of total market value by 2030.

Established lipid producers are now being challenged by synthetic biology start-ups offering modular bio production and AI-driven process control. As a result, ecosystem integration, bio manufacturing scalability, and application-specific lipid tailoring are poised to define competitive success over the next decade.

Why the Microbial Lipids is growing?

The microbial lipids market is being propelled by a convergence of health-conscious consumer trends, sustainability mandates, and technological innovation in precision fermentation. Rising scrutiny on traditional lipid sources-due to deforestation, overfishing, and allergen risks has led to microbial lipids being prioritized for their eco-efficiency and tailored functionality. Increased adoption has been observed across nutraceuticals and functional foods, where omega-enriched and cholesterol-free lipid profiles are being preferred. Growth has also been supported by advances in synthetic biology, through which lipid biosynthesis pathways are being optimized for higher yields and specificity.

Regulatory encouragement toward bio-based alternatives has further accelerated development pipelines, particularly in North America, Europe, and East Asia. Pharmaceutical and cosmetic applications are being explored, as microbial lipids are being recognized for their purity, consistency, and biocompatibility. As cost curves continue to decline with fermentation scale-up and digital optimization, market competitiveness is expected to intensify positioning microbial lipids as foundational ingredients across multiple high-growth industries.

Segmental Analysis

The microbial lipids market has been segmented across multiple strategic dimensions to capture emerging demand trends and value drivers. Key segmentation has been performed by microorganism source, lipid type, application, product form, sales channel, and end user. Among microorganism sources, yeast, fungi, algae, and bacteria are being utilized based on strain specificity, lipid yield, and scalability potential. In lipid type, the market has been differentiated by nutritional function particularly the role of omega fatty acids and phospholipids.

Application-based segmentation includes nutraceuticals, functional foods, pharmaceuticals, cosmetics, feed, and industrial biofuels, reflecting wide cross-industry utility. This granularity enables targeted innovation, regulatory alignment, and pricing strategies. By evaluating these segments, a forward-looking view has been established to identify growth hotspots and investment priorities within the microbial lipid landscape.
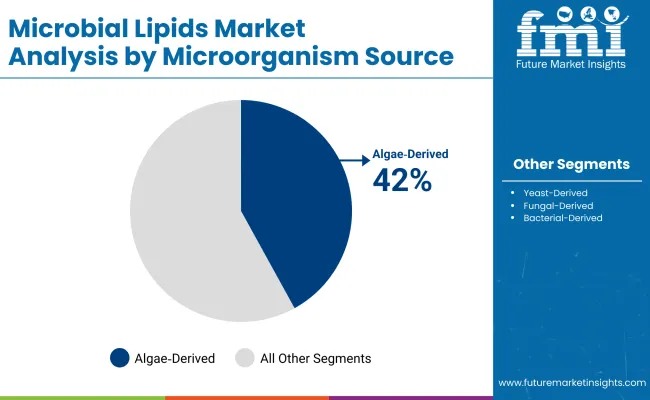
Insights into the Microorganism Source Segment with Algae Derived Lipids Leading in Market Share

Microbial Lipids Market By Microorganism Source

Microorganism Source Segment Market Value Share, 2025
Algae Derived Lipids 42.0%
Yeast Derived Lipids 28.0%

Algae-derived lipids have been positioned as the dominant segment, contributing 42.0% of the market in 2025. This leadership is attributed to their high omega-3 yield, renewable cultivation methods, and regulatory acceptance in food and nutraceutical applications. Algal fermentation systems have been increasingly favored due to their capacity for controlled biosynthesis and scalability in photo bioreactor and heterotrophic setups.

Compared to terrestrial sources, algae offer enhanced productivity with reduced land and water usage. The growth of this segment has also been supported by investments in marine biotechnology, alongside public-private partnerships aimed at developing DHA-rich algal oils. As strain engineering and downstream processing technologies are further refined, algae-derived lipids are expected to reinforce their leading role through both functional superiority and sustainable sourcing.
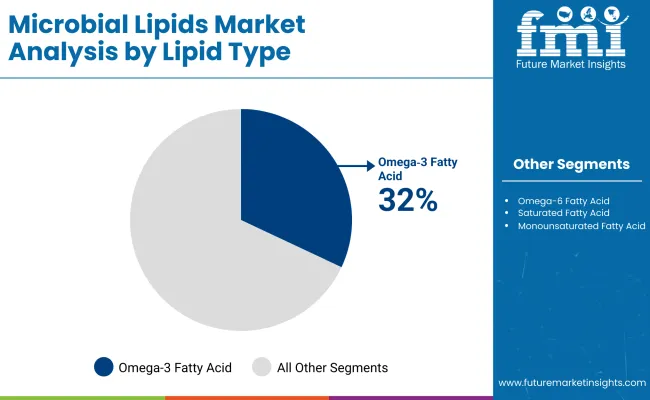
Insights into the Lipid Type Segment with Omega 3 Fatty Acids (EPA, DHA)Dominating the Demand

Microbial Lipids Market Analysis By Lipid Type

Lipid Type 2025 Share%
Omega 3 Fatty Acids (EPA, DHA) 32.0%
Phospholipids 15.0%
Polyunsaturated Fatty Acids 10.0%

Omega-3 fatty acids, particularly EPA and DHA, are projected to command 32.0% of the microbial lipids market in 2025. This dominance has been driven by rising consumer awareness of cardiovascular, cognitive, and prenatal health benefits associated with omega-3 intake. Microbial production platforms have been increasingly leveraged to bypass marine supply chains, enabling vegan, allergen-free, and traceable omega-3 sources.

Regulatory agencies have endorsed microbial omega-3s as GRAS (Generally Recognized as Safe), accelerating their incorporation into supplements, infant nutrition, and functional beverages. Moreover, pharmaceutical and clinical nutrition brands have adopted microbial omega-3s to address purity and oxidative stability concerns. With formulation versatility and growing demand for plant-alternative lipids, the omega-3 segment is expected to remain a pivotal driver of value creation.
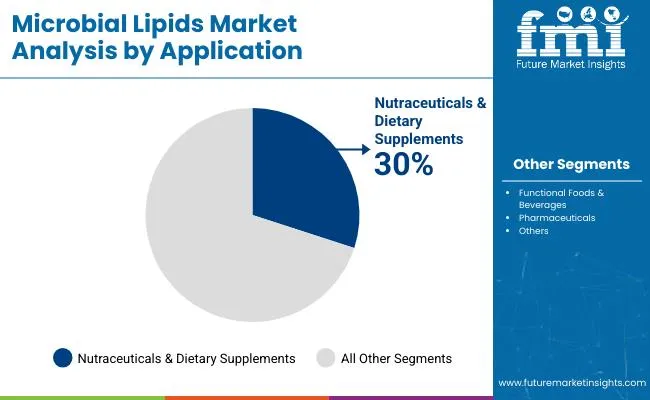
Insights into the Application Segment with Focus on Nutraceuticals & Dietary Supplements

Microbial Lipids Market By Application

Application 2025 Share%
Nutraceuticals & Dietary Supplements 30.0%
Functional Foods & Beverages 22.0%
Pharmaceuticals 15.0%

Nutraceuticals and dietary supplements have been estimated to lead the application segment, accounting for 30.0% of market value in 2025. The rising prevalence of lifestyle-related disorders and aging populations has catalyzed demand for bioavailable lipid formats enriched in omega-3s, phospholipids, and sterols. Microbial lipids are being increasingly preferred in supplement formulations for their purity, consistency, and customizable profiles.

The segment has also benefited from clean-label preferences and expanding e-commerce distribution, particularly across North America and Europe. Innovation in capsule, gummy, and softgel delivery forms has further accelerated integration into consumer wellness routines. With continued clinical validation and cross-border regulatory alignment, the nutraceuticals segment is expected to maintain its leadership in driving both volume and premium margins within the microbial lipids market.

What are the Drivers, Restraints, and Key Trends of the Microbial Lipids?

Rising production costs, scale-up variability, and bioprocess complexities are challenging microbial lipid adoption, even as demand intensifies across functional food, cosmetic, and nutraceutical industries seeking high-purity, sustainable lipid alternatives.

Increased Demand for Sustainable Omega-3 Alternatives

Heightened consumer focus on plant-based nutrition and marine biodiversity conservation has triggered a pronounced shift toward microbially derived omega-3 fatty acids. Traditional fish oil sources have been constrained by volatile yields, overfishing, and contamination risks. As a result, microalgae and yeast fermentation systems are being prioritized for their ability to produce EPA and DHA without ecological trade-offs. These systems are being scaled using closed-loop fermentation under controlled conditions, allowing for reproducibility, traceability, and allergen-free claims.

Product developers have been increasingly integrating microbial omega-3s into infant nutrition, brain health, and cardiovascular support supplements. Regulatory acceptance in North America, Europe, and Asia has further legitimized these ingredients, while venture-backed firms have accelerated production through synthetic biology innovations. Demand is expected to remain strong across both B2C and B2B nutrition segments.

Convergence of Lipid Biosynthesis with Precision Fermentation Platforms

The microbial lipids sector has been increasingly shaped by its integration into broader precision fermentation platforms. Genetic pathway optimization, CRISPR-enabled strain design, and AI-guided process control have enabled microbial hosts to be tailored for desired lipid profiles and yields.

Rather than standalone lipid production, microbial lipid fermentation is now being embedded within multi-product bio manufacturing ecosystems supporting co-production of proteins, pigments, and co-factors. This convergence has drawn strategic investment from food-tech giants, fueling innovation at the intersection of synthetic biology and ingredient customization. As cost curves decline and versatility increases, microbial lipids are expected to become central to the next generation of bioengineered nutrition systems.
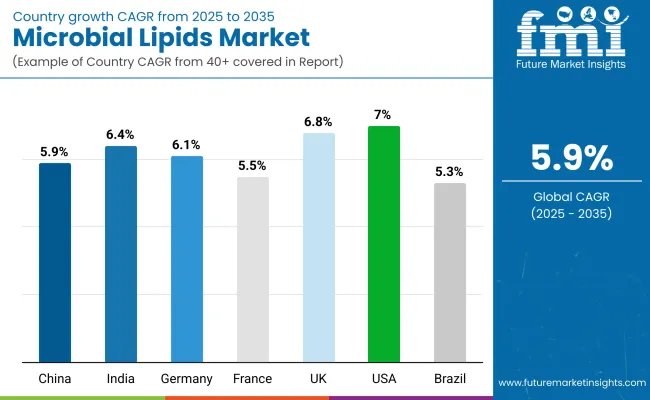
Analysis of Microbial Lipids by Key Countries

Country Wise Analysis Of Microbial Lipids Market

Countries CAGR (2025 to 2035)
China 5.9%
India 6.4%
Germany 6.1%
France 5.5%
UK 6.8%
USA 7.0%
Brazil 5.3%

The global microbial lipids market has been observed to exhibit marked disparities in country-level adoption, shaped by bioeconomy maturity, precision fermentation infrastructure, and nutritional policy orientation. Across advanced and emerging economies alike, microbial lipid technologies are being increasingly integrated into sustainable food systems and next-generation health products.

The United States is projected to lead with a 7.0% CAGR, driven by strong demand for vegan omega-3s, institutional investment in synthetic biology, and the regulatory acceptance of GRAS-approved microbial ingredients. The United Kingdom and India follow closely with 6.8% and 6.4%, respectively, where national biotech agendas and clean-label consumer movements have supported rapid innovation cycles.

Germany’s projected 6.1% CAGR reflects its strategic position in functional food manufacturing and ingredient safety standards, while China (5.9%) continues to scale fermentation-based production through government-supported industrial clusters. France (5.5%) and Brazil (5.3%) are expected to experience more moderate expansion, constrained by slower regulatory pathways and limited domestic manufacturing capacities.

However, localized demand for personalized nutrition and feed innovation is gradually strengthening commercial interest in these regions. As ecosystem partnerships deepen and technology transfer accelerates, microbial lipid adoption is expected to transition from niche applications toward core functional platforms across regions.

Sales Outlook for Microbial Lipids in the United States

Year USA Microbial Lipids Market (USD Million)
2025 200.5
2026 211.6
2027 223.8
2028 239.4
2029 251.8
2030 265.7
2031 281.2
2032 299.1
2033 314.2
2034 333.1
2035 356.1

The microbial lipids market in the United States is projected to expand from USD 200.5 million in 2025 to USD 356.1 million by 2035, reflecting a CAGR of approximately 6.0%. This sustained growth has been driven by increasing demand for sustainable and allergen-free lipid sources, particularly within functional nutrition, clean-label food manufacturing, and plant-based personal care formulations. Omega-3 rich lipids produced via fermentation have been prioritized over marine-derived alternatives due to regulatory alignment and consumer preferences for traceable, vegan ingredients.

High adoption rates have been observed among dietary supplement brands and medical nutrition providers seeking lipid bioavailability and purity. USA-based synthetic biology firms have catalyzed domestic production capacity, attracting venture capital and long-term offtake partnerships. Government-backed incentives supporting biomanufacturing infrastructure and ESG-compliant sourcing have further stimulated market acceleration. In addition, microbial lipid inclusion in animal-free cosmetics and infant formulas has gained regulatory clarity, enabling market diversification.

  • USA supplement and clinical nutrition sectors are increasingly sourcing EPA/DHA from algae- and yeast-derived microbial oils.
  • Synthetic biology startups in California and the Northeast are scaling production through fermentation-as-a-service models.

Growth and Expansion Outlook for Microbial Lipids in the United Kingdom

The microbial lipids market in the UK is projected to witness robust expansion, driven by a CAGR of 6.8% from 2025 to 2035. Increasing regulatory encouragement for sustainable, non-GMO ingredients has created favorable conditions for microbial lipid penetration across food, beauty, and clinical sectors. Algae- and yeast-derived lipids have been prioritized in novel food filings and are being supported by retailer commitments to clean-label sourcing. UK-based bio manufacturing clusters have enabled localized pilot-scale fermentation, particularly for cosmetic-grade phospholipids and sterols.

  • Microbial lipids are being integrated into omega-3 enriched infant formulas and wellness beverages.
  • Clean-label beauty brands are adopting microbial oils for cruelty-free emollient systems.
  • UK FSA’s acceptance of fermentation-derived lipids has de-risked product innovation.
  • Government support through the Bioeconomy Strategy is enabling scale-up investments.

Growth and Expansion Outlook for Microbial Lipids in India

The microbial lipids market in India is forecasted to grow at a CAGR of 6.4% over 2025-2035, fueled by domestic demand for functional health supplements and dairy alternatives. Urban consumer preference for vegan omega-3s and cholesterol-free oils has been supported by Ayurveda-aligned innovation. Indian contract fermentation facilities are increasingly being used for microbial lipid production under export-grade quality systems. Cost-effective algal fermentation models are being localized, creating competitive alternatives to marine and palm-based oils.

  • Domestic supplement brands are using microbial DHA in brain and prenatal formulations.
  • Partnerships with European biotech firms are accelerating tech transfer and joint ventures.
  • The Cosmetics Rules 2020 have driven demand for ethical lipid sourcing in skin care.
  • Fermentation hubs in Telangana and Gujarat are expanding capacity for lipid biosynthesis.

Sales Outlook for Microbial Lipids in China

In China, the microbial lipids market is expected to register a CAGR of 5.9% through 2035, supported by government-led industrial biotechnology programs and a robust nutraceutical manufacturing base. Functional food players have prioritized fermentation-based EPA/DHA sources to meet domestic omega-3 demand with lower import dependency. Regulatory harmonization under the “Healthy China 2030” policy has accelerated GRAS-equivalent approvals for microbially derived ingredients. Innovation zones in Jiangsu and Guangdong are scaling precision fermentation infrastructure.

  • Algae-based lipids are used in fortified baby formulas and senior nutrition products.
  • Leading nutraceutical firms are co-developing lipid strains with synthetic biology labs.
  • “Dual circulation” policy favors local production of strategic nutrition ingredients.
  • Food safety compliance is enabling microbial lipids to replace fish oil in OTC products.

In-depth Analysis of Microbial Lipids in Germany

Countries 2025
UK 19.9%
Germany 20.8%
Italy 10.0%
France 14.1%
Spain 10.3%
BENELUX 7.0%
Nordic 5.3%
Rest of Europe 12.7%
Countries 2035
UK 19.1%
Germany 21.8%
Italy 10.3%
France 13.7%
Spain 11.1%
BENELUX 5.6%
Nordic 5.8%
Rest of Europe 12.6%

Germany’s microbial lipids market is projected to expand at a CAGR of 6.1% from 2025 to 2035, driven by regulatory leadership in food safety, traceability, and biotech acceptance. Fermentation-based omega fatty acids and phospholipids are being integrated into fortified foods, cosmeceuticals, and prescription-grade nutrition solutions. Germany’s precision fermentation R&D ecosystem, supported by EU Green Deal funding, has catalyzed lipid strain innovation and bioprocess scale-up.

  • German nutraceutical companies are launching microbially enriched brain and heart health SKUs.
  • Ingredient importers are shifting toward EU-made lipids for compliance and carbon labeling.
  • Fermentation platforms are being deployed in Bavaria and North Rhine-Westphalia with public R&D grants.
  • Lipid applications in medical foods and elderly nutrition are being prioritized amid demographic shifts.

Growth Outlook for Microbial Lipids in Japan

Microorganism Source Market Value Share, 2025
Yeast Derived Lipids 27.0%
Fungal Derived Lipids 17.0%
Algae Derived Lipids 44.0%
Bacterial Derived Lipids 12.0%

The microbial lipids market in Japan is projected to reach approximately USD 35.1 million in 2025, supported by strong adoption of algae-based and yeast-derived lipid systems. Algae-derived lipids are expected to dominate with a 44.0% share, owing to their clean-label omega-3 content and alignment with Japan’s functional food innovation ecosystem. Yeast-derived oils follow with 27.0%, benefiting from robust application in cosmeceuticals and biopharmaceutical carriers. The segment’s leadership reflects Japan’s investment in marine biotechnology and sustainable aquaculture, where algae-based DHA and EPA have been integrated into nutritional guidelines.

Growth is being driven by the inclusion of microbial lipids in FOSHU-approved products and the rise of personalized nutrition targeting the aging population. The Ministry of Health, Labour and Welfare has encouraged the development of fermentation-derived ingredients through regulatory fast-tracking and R&D incentives. Meanwhile, leading Japanese conglomerates have formed joint ventures with synthetic biology startups to localize strain optimization and downstream lipid purification processes.

  • Japan is expected to hold a notable share of APAC microbial lipid revenue in 2025.
  • Algae-derived lipid production is being scaled through photobioreactor platforms in coastal regions.
  • Applications in elderly nutrition and cosmeceuticals are strengthening domestic demand.
  • Government-led biotech funding is reinforcing strain development and GMP-compliant fermentation.

Opportunity Analysis of South Korea Microbial Lipids

Application Market Value Share, 2025
Nutraceuticals & Dietary Supplements 31.0%
Functional Foods & Beverages 23.0%
Pharmaceuticals 14.0%
Cosmetics & Personal Care 12.0%
Animal & Aquaculture Feed 11.0%
Biofuels & Industrial Uses 9.0%

The microbial lipids market in South Korea is projected to expand steadily through 2035, driven by robust growth across wellness nutrition, food innovation, and sustainable cosmetics. Nutraceutical applications are anticipated to lead with a 31.0% share in 2025, owing to strong consumer preference for algae-based omega-3 supplements and cholesterol-free functional oils. Functional foods and beverages follow at 23.0%, supported by the country’s well-established F&B innovation ecosystem and active demand for clean-label, fortified products.

Government incentives under Korea’s bioeconomy strategy have accelerated local production and R&D in microbial fermentation, particularly within health-focused biotech clusters. Industrial partnerships are being forged between local conglomerates and global synthetic biology platforms to optimize lipid yield and processing efficiency.
  • Microbial lipids are being used in probiotic yogurts, fortified beverages, and senior nutrition SKUs.
  • Korean cosmetic brands are integrating microbial sterols into K-beauty formulations.
  • Strategic government funding is enabling bioprocess localization in Daegu and Daejeon hubs.
  • Biofuel-grade microbial oils are being explored in renewable energy pilots by industrial OEMs.

Competitive Landscape of Microbial Lipids

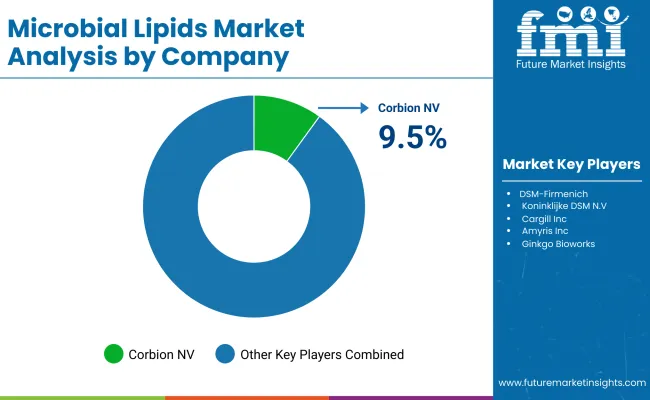
Microbial Lipids Market Analysis By Company

The microbial lipids market is moderately fragmented, with global leaders, mid-sized innovators, and specialized biotechnology firms competing across nutrition, personal care, and industrial applications. Industry leaders such as Corbion NV, DSM-Firmenich, and Cargill, Incorporated have been positioned at the forefront, leveraging fermentation platforms, robust supply chains, and multi-sector regulatory reach. These players have been observed to prioritize expansion into omega-3 formulations, clean-label alternatives, and sustainable lipid portfolios through joint ventures and proprietary strain development.

Mid-sized players including Amyris, Inc., Ginkgo Bioworks, and Roquette Frères have focused on modular production capabilities and synthetic biology toolkits, enabling agile customization across cosmetics, pharmaceuticals, and vegan nutrition. Their capabilities are being expanded through AI-driven pathway optimization and fermentation-as-a-service models. Strategic positioning is being reinforced by downstream partnerships with CPG brands and specialty formulators.

Specialist companies such as TerraVia and Solazyme (both under Corbion) are targeting niche use cases in infant formula lipids, biopolymer intermediates, and microalgae-derived skincare actives. Their core advantage has been established around targeted functionality, feedstock flexibility, and regionalized production models.

Competitive advantage in this market is shifting toward strain IP, platform interoperability, and lifecycle sustainability metrics. Subscription-based ingredient innovation pipelines, carbon-intelligent lipid sourcing, and integration into food-tech ecosystems are expected to define long-term leadership.

Key Developments in Microbial Lipids

  • In May 2025, Amyris, Inc. assumed full ownership of its precision fermentation plant in Barra Bonita, Brazil, following joint‑venture divestment by Ingredion. This consolidation into Amyris’s production infrastructure was finalized by late May and is being leveraged to scale microbial lipid biosynthesis for global clean‑label ingredients.

Scope of the Report

Item Value
Quantitative Units USD 835.6 million
Microorganism Source Yeast-Derived, Fungal-Derived, Algae-Derived, Bacterial-Derived
Lipid Type Omega-3 Fatty Acids (EPA, DHA), Omega-6 Fatty Acids, Saturated Fatty Acids, Monounsaturated Fatty Acids, Polyunsaturated Fatty Acids, Phospholipids, Sterols
Product Form Microbial Oils, Powders & Concentrates, Emulsions & Encapsulated Forms
Application Nutraceuticals & Dietary Supplements, Functional Foods & Beverages, Pharmaceuticals, Cosmetics & Personal Care, Animal & Aquaculture Feed, Biofuels & Industrial Uses
End User General Consumers, Medical & Clinical Nutrition Patients, Cosmetic Formulators, Animal Nutrition Industry
Sales Channel B2B Ingredient Suppliers, Direct-to-Consumer (D2C), Pharmacies & Drugstores, Food & Beverage Manufacturers, Online Retail
Regions Covered North America, Europe, Asia-Pacific, Latin America, Middle East & Africa
Country Covered United States, Canada, Germany, France, United Kingdom, China, Japan, India, Brazil, South Africa
Key Companies Profiled Corbion NV, DSM-Firmenich, Koninklijke DSM N.V., Cargill Inc., Amyris Inc., Ginkgo Bioworks, TerraVia, Solazyme, Roquette Frères, BASF SE
Additional Attributes Global sales by lipid type and application segment; competitive intensity among biotech and fermentation players; omega-3 demand in infant and senior nutrition; shift toward algae-based DHA; growth of vegan and halal lipid platforms; regulatory fast-tracki ng in EU, US, and APAC regions.

Key Segmentation

By Microorganism Source:

  • Yeast-Derived Lipids
  • Fungal-Derived Lipids
  • Algae-Derived Lipids
  • Bacterial-Derived Lipids

By Lipid Type:

  • Omega-3 Fatty Acids (EPA, DHA)
  • Omega-6 Fatty Acids
  • Saturated Fatty Acids
  • Monounsaturated Fatty Acids
  • Polyunsaturated Fatty Acids
  • Phospholipids
  • Sterols

By Application:

  • Nutraceuticals & Dietary Supplements
  • Functional Foods & Beverages
  • Pharmaceuticals
  • Cosmetics & Personal Care
  • Animal & Aquaculture Feed
  • Biofuels & Industrial Uses

By Product Form:

  • Oils & Oil Blends
  • Powders & Concentrates
  • Emulsions & Encapsulated Forms

By Sales Channel:

  • B2B Ingredient Suppliers
  • Direct-to-Consumer (D2C)
  • Pharmacies & Drugstores
  • Food & Beverage Manufacturers
  • Online Retail

By End User:

  • General Consumers
  • Medical & Clinical Nutrition Patients
  • Cosmetic Formulators
  • Animal Nutrition Industry

By Region:

  • North America
  • Latin America
  • Europe
  • East Asia
  • South Asia & Pacific
  • Middle East and Africa

Table of Content

  1. Executive Summary
    • Global Market Outlook
    • Demand-side Trends
    • Supply-side Trends
    • Technology Roadmap Analysis
    • Analysis and Recommendations
  2. Market Overview
    • Market Coverage / Taxonomy
    • Market Definition / Scope / Limitations
  3. Market Background
    • Market Dynamics
      • Drivers
      • Restraints
      • Opportunity
      • Trends
    • Scenario Forecast
      • Demand in Optimistic Scenario
      • Demand in Likely Scenario
      • Demand in Conservative Scenario
    • Opportunity Map Analysis
    • Product Life Cycle Analysis
    • Supply Chain Analysis
    • Investment Feasibility Matrix
    • Value Chain Analysis
    • PESTLE and Porter’s Analysis
    • Regulatory Landscape
    • Regional Parent Market Outlook
    • Production and Consumption Statistics
    • Import and Export Statistics
  4. Global Analysis 2020 to 2024 and Forecast, 2025 to 2035
    • Historical Market Size Value (USD Million) & Volume(MT) Analysis, 2020 to 2024
    • Current and Future Market Size Value (USD Million) & Volume(MT) Projections, 2025 to 2035
      • Y-o-Y Growth Trend Analysis
      • Absolute $ Opportunity Analysis
  5. Global Pricing Analysis 2020 to 2024 and Forecast 2025 to 2035
  6. Global Analysis 2020 to 2024 and Forecast 2025 to 2035, By Microorganism Source
    • Introduction / Key Findings
    • Historical Market Size Value (USD Million) & Volume(MT) Analysis By Microorganism Source, 2020 to 2024
    • Current and Future Market Size Value (USD Million) & Volume(MT) Analysis and Forecast By Microorganism Source, 2025 to 2035
      • Yeast-Derived Lipids
      • Fungal-Derived Lipids
      • Algae-Derived Lipids
      • Bacterial-Derived Lipids
    • Y-o-Y Growth Trend Analysis By Microorganism Source, 2020 to 2024
    • Absolute $ Opportunity Analysis By Microorganism Source, 2025 to 2035
  7. Global Analysis 2020 to 2024 and Forecast 2025 to 2035, By Lipid Type
    • Introduction / Key Findings
    • Historical Market Size Value (USD Million) & Volume(MT) Analysis By Lipid Type, 2020 to 2024
    • Current and Future Market Size Value (USD Million) & Volume(MT) Analysis and Forecast By Lipid Type, 2025 to 2035
      • Omega-3 Fatty Acids (EPA, DHA)
      • Omega-6 Fatty Acids
      • Saturated Fatty Acids
      • Monounsaturated Fatty Acids
      • Polyunsaturated Fatty Acids
      • Phospholipids
      • Sterols
    • Y-o-Y Growth Trend Analysis By Lipid Type, 2020 to 2024
    • Absolute $ Opportunity Analysis By Lipid Type, 2025 to 2035
  8. Global Analysis 2020 to 2024 and Forecast 2025 to 2035, By Application
    • Introduction / Key Findings
    • Historical Market Size Value (USD Million) & Volume(MT) Analysis By Application, 2020 to 2024
    • Current and Future Market Size Value (USD Million) & Volume(MT) Analysis and Forecast By Application, 2025 to 2035
      • Nutraceuticals & Dietary Supplements
      • Functional Foods & Beverages
      • Pharmaceuticals
      • Cosmetics & Personal Care
      • Animal & Aquaculture Feed
      • Biofuels & Industrial Uses
    • Y-o-Y Growth Trend Analysis By Application, 2020 to 2024
    • Absolute $ Opportunity Analysis By Application, 2025 to 2035
  9. Global Analysis 2020 to 2024 and Forecast 2025 to 2035, By Product Form
    • Introduction / Key Findings
    • Historical Market Size Value (USD Million) & Volume(MT) Analysis By Product Form, 2020 to 2024
    • Current and Future Market Size Value (USD Million) & Volume(MT) Analysis and Forecast By Product Form, 2025 to 2035
      • Oils & Oil Blends
      • Powders & Concentrates
      • Emulsions & Encapsulated Forms
    • Y-o-Y Growth Trend Analysis By Product Form, 2020 to 2024
    • Absolute $ Opportunity Analysis By Product Form, 2025 to 2035
  10. Global Analysis 2020 to 2024 and Forecast 2025 to 2035, By Sales Channel
    • Introduction / Key Findings
    • Historical Market Size Value (USD Million) & Volume(MT) Analysis By Sales Channel, 2020 to 2024
    • Current and Future Market Size Value (USD Million) & Volume(MT) Analysis and Forecast By Sales Channel, 2025 to 2035
      • B2B Ingredient Suppliers
      • Direct-to-Consumer (D2C)
      • Pharmacies & Drugstores
      • Food & Beverage Manufacturers
      • Online Retail
    • Y-o-Y Growth Trend Analysis By Sales Channel, 2020 to 2024
    • Absolute $ Opportunity Analysis By Sales Channel, 2025 to 2035
  11. Global Analysis 2020 to 2024 and Forecast 2025 to 2035, By End User
    • Introduction / Key Findings
    • Historical Market Size Value (USD Million) & Volume(MT) Analysis By End User, 2020 to 2024
    • Current and Future Market Size Value (USD Million) & Volume(MT) Analysis and Forecast By End User, 2025 to 2035
      • General Consumers
      • Medical & Clinical Nutrition Patients
      • Cosmetic Formulators
      • Animal Nutrition Industry
    • Y-o-Y Growth Trend Analysis By End User, 2020 to 2024
    • Absolute $ Opportunity Analysis By End User, 2025 to 2035
  12. Global Analysis 2020 to 2024 and Forecast 2025 to 2035, By Region
    • Introduction
    • Historical Market Size Value (USD Million) & Volume(MT) Analysis By Region, 2020 to 2024
    • Current Market Size Value (USD Million) & Volume(MT) Analysis and Forecast By Region, 2025 to 2035
      • North America
      • Latin America
      • Europe
      • East Asia
      • South Asia & Pacific
      • Middle East and Africa
    • Market Attractiveness Analysis By Region
  13. North America Analysis 2020 to 2024 and Forecast 2025 to 2035, By Country
    • Historical Market Size Value (USD Million) & Volume(MT) Trend Analysis By Market Taxonomy, 2020 to 2024
    • Market Size Value (USD Million) & Volume(MT) Forecast By Market Taxonomy, 2025 to 2035
      • By Country
        • USA
        • Canada
      • By Microorganism Source
      • By Lipid Type
      • By Application
      • By Product Form
      • By Sales Channel
      • By End User
    • Market Attractiveness Analysis
      • By Country
      • By Microorganism Source
      • By Lipid Type
      • By Application
      • By Product Form
      • By Sales Channel
      • By End User
    • Key Takeaways
  14. Latin America Analysis 2020 to 2024 and Forecast 2025 to 2035, By Country
    • Historical Market Size Value (USD Million) & Volume(MT) Trend Analysis By Market Taxonomy, 2020 to 2024
    • Market Size Value (USD Million) & Volume(MT) Forecast By Market Taxonomy, 2025 to 2035
      • By Country
        • Brazil
        • Mexico
        • Colombia
        • Rest of Latin America
      • By Microorganism Source
      • By Lipid Type
      • By Application
      • By Product Form
      • By Sales Channel
      • By End User
    • Market Attractiveness Analysis
      • By Country
      • By Microorganism Source
      • By Lipid Type
      • By Application
      • By Product Form
      • By Sales Channel
      • By End User
    • Key Takeaways
  15. Europe Analysis 2020 to 2024 and Forecast 2025 to 2035, By Country
    • Historical Market Size Value (USD Million) & Volume(MT) Trend Analysis By Market Taxonomy, 2020 to 2024
    • Market Size Value (USD Million) & Volume(MT) Forecast By Market Taxonomy, 2025 to 2035
      • By Country
        • Germany
        • UK
        • France
        • Italy
        • Spain
        • Belgium
        • Netherlands
        • Nordic
        • Switzerland
        • Russia
        • Poland
        • Rest of Europe
      • By Microorganism Source
      • By Lipid Type
      • By Application
      • By Product Form
      • By Sales Channel
      • By End User
    • Market Attractiveness Analysis
      • By Country
      • By Microorganism Source
      • By Lipid Type
      • By Application
      • By Product Form
      • By Sales Channel
      • By End User
    • Key Takeaways
  16. East Asia Analysis 2020 to 2024 and Forecast 2025 to 2035, By Country
    • Historical Market Size Value (USD Million) & Volume(MT) Trend Analysis By Market Taxonomy, 2020 to 2024
    • Market Size Value (USD Million) & Volume(MT) Forecast By Market Taxonomy, 2025 to 2035
      • By Country
        • China
        • Japan
        • South Korea
      • By Microorganism Source
      • By Lipid Type
      • By Application
      • By Product Form
      • By Sales Channel
      • By End User
    • Market Attractiveness Analysis
      • By Country
      • By Microorganism Source
      • By Lipid Type
      • By Application
      • By Product Form
      • By Sales Channel
      • By End User
    • Key Takeaways
  17. South Asia & Pacific Analysis 2020 to 2024 and Forecast 2025 to 2035, By Country
    • Historical Market Size Value (USD Million) & Volume(MT) Trend Analysis By Market Taxonomy, 2020 to 2024
    • Market Size Value (USD Million) & Volume(MT) Forecast By Market Taxonomy, 2025 to 2035
      • By Country
        • India
        • Thailand
        • Malaysia
        • Indonesia
        • Singapore
        • Vietnam
        • Australia
        • New Zealand
        • Rest of South Asia & Pacific
      • By Microorganism Source
      • By Lipid Type
      • By Application
      • By Product Form
      • By Sales Channel
      • By End User
    • Market Attractiveness Analysis
      • By Country
      • By Microorganism Source
      • By Lipid Type
      • By Application
      • By Product Form
      • By Sales Channel
      • By End User
    • Key Takeaways
  18. Middle East and Africa Analysis 2020 to 2024 and Forecast 2025 to 2035, By Country
    • Historical Market Size Value (USD Million) & Volume(MT) Trend Analysis By Market Taxonomy, 2020 to 2024
    • Market Size Value (USD Million) & Volume(MT) Forecast By Market Taxonomy, 2025 to 2035
      • By Country
        • Turkey
        • UAE
        • Saudi Arabia
        • Israel
        • Other GCC Countries
        • North Africa
        • South Africa
      • By Microorganism Source
      • By Lipid Type
      • By Application
      • By Product Form
      • By Sales Channel
      • By End User
    • Market Attractiveness Analysis
      • By Country
      • By Microorganism Source
      • By Lipid Type
      • By Application
      • By Product Form
      • By Sales Channel
      • By End User
    • Key Takeaways
  19. Key Countries Analysis
    • USA
      • Pricing Analysis
      • Market Share Analysis, 2024
        • By Microorganism Source
        • By Lipid Type
        • By Application
        • By Product Form
        • By Sales Channel
        • By End User
    • Canada
      • Pricing Analysis
      • Market Share Analysis, 2024
        • By Microorganism Source
        • By Lipid Type
        • By Application
        • By Product Form
        • By Sales Channel
        • By End User
    • Brazil
      • Pricing Analysis
      • Market Share Analysis, 2024
        • By Microorganism Source
        • By Lipid Type
        • By Application
        • By Product Form
        • By Sales Channel
        • By End User
    • Mexico
      • Pricing Analysis
      • Market Share Analysis, 2024
        • By Microorganism Source
        • By Lipid Type
        • By Application
        • By Product Form
        • By Sales Channel
        • By End User
    • Germany
      • Pricing Analysis
      • Market Share Analysis, 2024
        • By Microorganism Source
        • By Lipid Type
        • By Application
        • By Product Form
        • By Sales Channel
        • By End User
    • UK
      • Pricing Analysis
      • Market Share Analysis, 2024
        • By Microorganism Source
        • By Lipid Type
        • By Application
        • By Product Form
        • By Sales Channel
        • By End User
    • France
      • Pricing Analysis
      • Market Share Analysis, 2024
        • By Microorganism Source
        • By Lipid Type
        • By Application
        • By Product Form
        • By Sales Channel
        • By End User
    • Italy
      • Pricing Analysis
      • Market Share Analysis, 2024
        • By Microorganism Source
        • By Lipid Type
        • By Application
        • By Product Form
        • By Sales Channel
        • By End User
    • Spain
      • Pricing Analysis
      • Market Share Analysis, 2024
        • By Microorganism Source
        • By Lipid Type
        • By Application
        • By Product Form
        • By Sales Channel
        • By End User
    • Belgium
      • Pricing Analysis
      • Market Share Analysis, 2024
        • By Microorganism Source
        • By Lipid Type
        • By Application
        • By Product Form
        • By Sales Channel
        • By End User
    • Netherlands
      • Pricing Analysis
      • Market Share Analysis, 2024
        • By Microorganism Source
        • By Lipid Type
        • By Application
        • By Product Form
        • By Sales Channel
        • By End User
    • Nordic
      • Pricing Analysis
      • Market Share Analysis, 2024
        • By Microorganism Source
        • By Lipid Type
        • By Application
        • By Product Form
        • By Sales Channel
        • By End User
    • Switzerland
      • Pricing Analysis
      • Market Share Analysis, 2024
        • By Microorganism Source
        • By Lipid Type
        • By Application
        • By Product Form
        • By Sales Channel
        • By End User
    • Russia
      • Pricing Analysis
      • Market Share Analysis, 2024
        • By Microorganism Source
        • By Lipid Type
        • By Application
        • By Product Form
        • By Sales Channel
        • By End User
    • Poland
      • Pricing Analysis
      • Market Share Analysis, 2024
        • By Microorganism Source
        • By Lipid Type
        • By Application
        • By Product Form
        • By Sales Channel
        • By End User
    • China
      • Pricing Analysis
      • Market Share Analysis, 2024
        • By Microorganism Source
        • By Lipid Type
        • By Application
        • By Product Form
        • By Sales Channel
        • By End User
    • Japan
      • Pricing Analysis
      • Market Share Analysis, 2024
        • By Microorganism Source
        • By Lipid Type
        • By Application
        • By Product Form
        • By Sales Channel
        • By End User
    • South Korea
      • Pricing Analysis
      • Market Share Analysis, 2024
        • By Microorganism Source
        • By Lipid Type
        • By Application
        • By Product Form
        • By Sales Channel
        • By End User
    • India
      • Pricing Analysis
      • Market Share Analysis, 2024
        • By Microorganism Source
        • By Lipid Type
        • By Application
        • By Product Form
        • By Sales Channel
        • By End User
    • Thailand
      • Pricing Analysis
      • Market Share Analysis, 2024
        • By Microorganism Source
        • By Lipid Type
        • By Application
        • By Product Form
        • By Sales Channel
        • By End User
    • Malaysia
      • Pricing Analysis
      • Market Share Analysis, 2024
        • By Microorganism Source
        • By Lipid Type
        • By Application
        • By Product Form
        • By Sales Channel
        • By End User
    • Indonesia
      • Pricing Analysis
      • Market Share Analysis, 2024
        • By Microorganism Source
        • By Lipid Type
        • By Application
        • By Product Form
        • By Sales Channel
        • By End User
    • Singapore
      • Pricing Analysis
      • Market Share Analysis, 2024
        • By Microorganism Source
        • By Lipid Type
        • By Application
        • By Product Form
        • By Sales Channel
        • By End User
    • Vietnam
      • Pricing Analysis
      • Market Share Analysis, 2024
        • By Microorganism Source
        • By Lipid Type
        • By Application
        • By Product Form
        • By Sales Channel
        • By End User
    • Australia
      • Pricing Analysis
      • Market Share Analysis, 2024
        • By Microorganism Source
        • By Lipid Type
        • By Application
        • By Product Form
        • By Sales Channel
        • By End User
    • New Zealand
      • Pricing Analysis
      • Market Share Analysis, 2024
        • By Microorganism Source
        • By Lipid Type
        • By Application
        • By Product Form
        • By Sales Channel
        • By End User
    • Turkey
      • Pricing Analysis
      • Market Share Analysis, 2024
        • By Microorganism Source
        • By Lipid Type
        • By Application
        • By Product Form
        • By Sales Channel
        • By End User
    • UAE
      • Pricing Analysis
      • Market Share Analysis, 2024
        • By Microorganism Source
        • By Lipid Type
        • By Application
        • By Product Form
        • By Sales Channel
        • By End User
    • Saudi Arabia
      • Pricing Analysis
      • Market Share Analysis, 2024
        • By Microorganism Source
        • By Lipid Type
        • By Application
        • By Product Form
        • By Sales Channel
        • By End User
    • Israel
      • Pricing Analysis
      • Market Share Analysis, 2024
        • By Microorganism Source
        • By Lipid Type
        • By Application
        • By Product Form
        • By Sales Channel
        • By End User
  20. Market Structure Analysis
    • Competition Dashboard
    • Competition Benchmarking
    • Market Share Analysis of Top Players
      • By Regional
      • By Microorganism Source
      • By Lipid Type
      • By Application
      • By Product Form
      • By Sales Channel
      • By End User
  21. Competition Analysis
    • Competition Deep Dive
      • Corbion NV
        • Overview
        • Product Portfolio
        • Profitability by Market Segments (Product/Age /Sales Channel/Region)
        • Sales Footprint
        • Strategy Overview
        • DSM-Firmenich
        • Koninklijke DSM N.V.
        • Cargill, Incorporated
        • Amyris, Inc.
        • Ginkgo Bioworks
        • TerraVia (Corbion subsidiary)
        • Solazyme (Corbion)
        • Roquette Frères
        • BASF SE
    • Assumptions & Acronyms Used
    • Research Methodology

List of Tables

  • Table 1: Global Value (USD Million) Forecast by Region, 2020-2035
  • Table 2: Global Volume(MT) Forecast by Region, 2020-2035
  • Table 3: Global Value (USD Million) Forecast by Microorganism Source, 2020-2035
  • Table 4: Global Volume(MT) Forecast by Microorganism Source, 2020-2035
  • Table 5: Global Value (USD Million) Forecast by Lipid Type, 2020-2035
  • Table 6: Global Volume(MT) Forecast by Lipid Type, 2020-2035
  • Table 7: Global Value (USD Million) Forecast by Application, 2020-2035
  • Table 8: Global Volume(MT) Forecast by Application, 2020-2035
  • Table 9: Global Value (USD Million) Forecast by Product Form, 2020-2035
  • Table 10: Global Volume(MT) Forecast by Product Form, 2020-2035
  • Table 11: Global Value (USD Million) Forecast by Sales Channel, 2020-2035
  • Table 12: Global Volume(MT) Forecast by Sales Channel, 2020-2035
  • Table 13: Global Value (USD Million) Forecast by End User, 2020-2035
  • Table 14: Global Volume(MT) Forecast by End User, 2020-2035
  • Table 15: North America Value (USD Million) Forecast by Country, 2020-2035
  • Table 16: North America Volume(MT) Forecast by Country, 2020-2035
  • Table 17: North America Value (USD Million) Forecast by Microorganism Source, 2020-2035
  • Table 18: North America Volume(MT) Forecast by Microorganism Source, 2020-2035
  • Table 19: North America Value (USD Million) Forecast by Lipid Type, 2020-2035
  • Table 20: North America Volume(MT) Forecast by Lipid Type, 2020-2035
  • Table 21: North America Value (USD Million) Forecast by Application, 2020-2035
  • Table 22: North America Volume(MT) Forecast by Application, 2020-2035
  • Table 23: North America Value (USD Million) Forecast by Product Form, 2020-2035
  • Table 24: North America Volume(MT) Forecast by Product Form, 2020-2035
  • Table 25: North America Value (USD Million) Forecast by Sales Channel, 2020-2035
  • Table 26: North America Volume(MT) Forecast by Sales Channel, 2020-2035
  • Table 27: North America Value (USD Million) Forecast by End User, 2020-2035
  • Table 28: North America Volume(MT) Forecast by End User, 2020-2035
  • Table 29: Latin America Value (USD Million) Forecast by Country, 2020-2035
  • Table 30: Latin America Volume(MT) Forecast by Country, 2020-2035
  • Table 31: Latin America Value (USD Million) Forecast by Microorganism Source, 2020-2035
  • Table 32: Latin America Volume(MT) Forecast by Microorganism Source, 2020-2035
  • Table 33: Latin America Value (USD Million) Forecast by Lipid Type, 2020-2035
  • Table 34: Latin America Volume(MT) Forecast by Lipid Type, 2020-2035
  • Table 35: Latin America Value (USD Million) Forecast by Application, 2020-2035
  • Table 36: Latin America Volume(MT) Forecast by Application, 2020-2035
  • Table 37: Latin America Value (USD Million) Forecast by Product Form, 2020-2035
  • Table 38: Latin America Volume(MT) Forecast by Product Form, 2020-2035
  • Table 39: Latin America Value (USD Million) Forecast by Sales Channel, 2020-2035
  • Table 40: Latin America Volume(MT) Forecast by Sales Channel, 2020-2035
  • Table 41: Latin America Value (USD Million) Forecast by End User, 2020-2035
  • Table 42: Latin America Volume(MT) Forecast by End User, 2020-2035
  • Table 43: Europe Value (USD Million) Forecast by Country, 2020-2035
  • Table 44: Europe Volume(MT) Forecast by Country, 2020-2035
  • Table 45: Europe Value (USD Million) Forecast by Microorganism Source, 2020-2035
  • Table 46: Europe Volume(MT) Forecast by Microorganism Source, 2020-2035
  • Table 47: Europe Value (USD Million) Forecast by Lipid Type, 2020-2035
  • Table 48: Europe Volume(MT) Forecast by Lipid Type, 2020-2035
  • Table 49: Europe Value (USD Million) Forecast by Application, 2020-2035
  • Table 50: Europe Volume(MT) Forecast by Application, 2020-2035
  • Table 51: Europe Value (USD Million) Forecast by Product Form, 2020-2035
  • Table 52: Europe Volume(MT) Forecast by Product Form, 2020-2035
  • Table 53: Europe Value (USD Million) Forecast by Sales Channel, 2020-2035
  • Table 54: Europe Volume(MT) Forecast by Sales Channel, 2020-2035
  • Table 55: Europe Value (USD Million) Forecast by End User, 2020-2035
  • Table 56: Europe Volume(MT) Forecast by End User, 2020-2035
  • Table 57: East Asia Value (USD Million) Forecast by Country, 2020-2035
  • Table 58: East Asia Volume(MT) Forecast by Country, 2020-2035
  • Table 59: East Asia Value (USD Million) Forecast by Microorganism Source, 2020-2035
  • Table 60: East Asia Volume(MT) Forecast by Microorganism Source, 2020-2035
  • Table 61: East Asia Value (USD Million) Forecast by Lipid Type, 2020-2035
  • Table 62: East Asia Volume(MT) Forecast by Lipid Type, 2020-2035
  • Table 63: East Asia Value (USD Million) Forecast by Application, 2020-2035
  • Table 64: East Asia Volume(MT) Forecast by Application, 2020-2035
  • Table 65: East Asia Value (USD Million) Forecast by Product Form, 2020-2035
  • Table 66: East Asia Volume(MT) Forecast by Product Form, 2020-2035
  • Table 67: East Asia Value (USD Million) Forecast by Sales Channel, 2020-2035
  • Table 68: East Asia Volume(MT) Forecast by Sales Channel, 2020-2035
  • Table 69: East Asia Value (USD Million) Forecast by End User, 2020-2035
  • Table 70: East Asia Volume(MT) Forecast by End User, 2020-2035
  • Table 71: South Asia & Pacific Value (USD Million) Forecast by Country, 2020-2035
  • Table 72: South Asia & Pacific Volume(MT) Forecast by Country, 2020-2035
  • Table 73: South Asia & Pacific Value (USD Million) Forecast by Microorganism Source, 2020-2035
  • Table 74: South Asia & Pacific Volume(MT) Forecast by Microorganism Source, 2020-2035
  • Table 75: South Asia & Pacific Value (USD Million) Forecast by Lipid Type, 2020-2035
  • Table 76: South Asia & Pacific Volume(MT) Forecast by Lipid Type, 2020-2035
  • Table 77: South Asia & Pacific Value (USD Million) Forecast by Application, 2020-2035
  • Table 78: South Asia & Pacific Volume(MT) Forecast by Application, 2020-2035
  • Table 79: South Asia & Pacific Value (USD Million) Forecast by Product Form, 2020-2035
  • Table 80: South Asia & Pacific Volume(MT) Forecast by Product Form, 2020-2035
  • Table 81: South Asia & Pacific Value (USD Million) Forecast by Sales Channel, 2020-2035
  • Table 82: South Asia & Pacific Volume(MT) Forecast by Sales Channel, 2020-2035
  • Table 83: South Asia & Pacific Value (USD Million) Forecast by End User, 2020-2035
  • Table 84: South Asia & Pacific Volume(MT) Forecast by End User, 2020-2035
  • Table 85: Middle East and Africa Value (USD Million) Forecast by Country, 2020-2035
  • Table 86: Middle East and Africa Volume(MT) Forecast by Country, 2020-2035
  • Table 87: Middle East and Africa Value (USD Million) Forecast by Microorganism Source, 2020-2035
  • Table 88: Middle East and Africa Volume(MT) Forecast by Microorganism Source, 2020-2035
  • Table 89: Middle East and Africa Value (USD Million) Forecast by Lipid Type, 2020-2035
  • Table 90: Middle East and Africa Volume(MT) Forecast by Lipid Type, 2020-2035
  • Table 91: Middle East and Africa Value (USD Million) Forecast by Application, 2020-2035
  • Table 92: Middle East and Africa Volume(MT) Forecast by Application, 2020-2035
  • Table 93: Middle East and Africa Value (USD Million) Forecast by Product Form, 2020-2035
  • Table 94: Middle East and Africa Volume(MT) Forecast by Product Form, 2020-2035
  • Table 95: Middle East and Africa Value (USD Million) Forecast by Sales Channel, 2020-2035
  • Table 96: Middle East and Africa Volume(MT) Forecast by Sales Channel, 2020-2035
  • Table 97: Middle East and Africa Value (USD Million) Forecast by End User, 2020-2035
  • Table 98: Middle East and Africa Volume(MT) Forecast by End User, 2020-2035

List of Figures

  • Figure 1: Global Volume(MT) Forecast 2020-2035
  • Figure 2: Global Pricing Analysis
  • Figure 3: Global Value (USD Million) Forecast 2020-2035
  • Figure 4: Global Value Share and BPS Analysis by Microorganism Source, 2025 and 2035
  • Figure 5: Global Y-o-Y Growth Comparison by Microorganism Source, 2025-2035
  • Figure 6: Global Attractiveness Analysis by Microorganism Source
  • Figure 7: Global Value Share and BPS Analysis by Lipid Type, 2025 and 2035
  • Figure 8: Global Y-o-Y Growth Comparison by Lipid Type, 2025-2035
  • Figure 9: Global Attractiveness Analysis by Lipid Type
  • Figure 10: Global Value Share and BPS Analysis by Application, 2025 and 2035
  • Figure 11: Global Y-o-Y Growth Comparison by Application, 2025-2035
  • Figure 12: Global Attractiveness Analysis by Application
  • Figure 13: Global Value Share and BPS Analysis by Product Form, 2025 and 2035
  • Figure 14: Global Y-o-Y Growth Comparison by Product Form, 2025-2035
  • Figure 15: Global Attractiveness Analysis by Product Form
  • Figure 16: Global Value Share and BPS Analysis by Sales Channel, 2025 and 2035
  • Figure 17: Global Y-o-Y Growth Comparison by Sales Channel, 2025-2035
  • Figure 18: Global Attractiveness Analysis by Sales Channel
  • Figure 19: Global Value Share and BPS Analysis by End User, 2025 and 2035
  • Figure 20: Global Y-o-Y Growth Comparison by End User, 2025-2035
  • Figure 21: Global Attractiveness Analysis by End User
  • Figure 22: Global Value (USD Million) Share and BPS Analysis by Region, 2025 and 2035
  • Figure 23: Global Y-o-Y Growth Comparison by Region, 2025-2035
  • Figure 24: Global Attractiveness Analysis by Region
  • Figure 25: North America Incremental $ Opportunity, 2025-2035
  • Figure 26: Latin America Incremental $ Opportunity, 2025-2035
  • Figure 27: Europe Incremental $ Opportunity, 2025-2035
  • Figure 28: East Asia Incremental $ Opportunity, 2025-2035
  • Figure 29: South Asia & Pacific Incremental $ Opportunity, 2025-2035
  • Figure 30: Middle East and Africa Incremental $ Opportunity, 2025-2035
  • Figure 31: North America Value Share and BPS Analysis by Country, 2025 and 2035
  • Figure 32: North America Value Share and BPS Analysis by Microorganism Source, 2025 and 2035
  • Figure 33: North America Y-o-Y Growth Comparison by Microorganism Source, 2025-2035
  • Figure 34: North America Attractiveness Analysis by Microorganism Source
  • Figure 35: North America Value Share and BPS Analysis by Lipid Type, 2025 and 2035
  • Figure 36: North America Y-o-Y Growth Comparison by Lipid Type, 2025-2035
  • Figure 37: North America Attractiveness Analysis by Lipid Type
  • Figure 38: North America Value Share and BPS Analysis by Application, 2025 and 2035
  • Figure 39: North America Y-o-Y Growth Comparison by Application, 2025-2035
  • Figure 40: North America Attractiveness Analysis by Application
  • Figure 41: North America Value Share and BPS Analysis by Product Form, 2025 and 2035
  • Figure 42: North America Y-o-Y Growth Comparison by Product Form, 2025-2035
  • Figure 43: North America Attractiveness Analysis by Product Form
  • Figure 44: North America Value Share and BPS Analysis by Sales Channel, 2025 and 2035
  • Figure 45: North America Y-o-Y Growth Comparison by Sales Channel, 2025-2035
  • Figure 46: North America Attractiveness Analysis by Sales Channel
  • Figure 47: North America Value Share and BPS Analysis by End User, 2025 and 2035
  • Figure 48: North America Y-o-Y Growth Comparison by End User, 2025-2035
  • Figure 49: North America Attractiveness Analysis by End User
  • Figure 50: Latin America Value Share and BPS Analysis by Country, 2025 and 2035
  • Figure 51: Latin America Value Share and BPS Analysis by Microorganism Source, 2025 and 2035
  • Figure 52: Latin America Y-o-Y Growth Comparison by Microorganism Source, 2025-2035
  • Figure 53: Latin America Attractiveness Analysis by Microorganism Source
  • Figure 54: Latin America Value Share and BPS Analysis by Lipid Type, 2025 and 2035
  • Figure 55: Latin America Y-o-Y Growth Comparison by Lipid Type, 2025-2035
  • Figure 56: Latin America Attractiveness Analysis by Lipid Type
  • Figure 57: Latin America Value Share and BPS Analysis by Application, 2025 and 2035
  • Figure 58: Latin America Y-o-Y Growth Comparison by Application, 2025-2035
  • Figure 59: Latin America Attractiveness Analysis by Application
  • Figure 60: Latin America Value Share and BPS Analysis by Product Form, 2025 and 2035
  • Figure 61: Latin America Y-o-Y Growth Comparison by Product Form, 2025-2035
  • Figure 62: Latin America Attractiveness Analysis by Product Form
  • Figure 63: Latin America Value Share and BPS Analysis by Sales Channel, 2025 and 2035
  • Figure 64: Latin America Y-o-Y Growth Comparison by Sales Channel, 2025-2035
  • Figure 65: Latin America Attractiveness Analysis by Sales Channel
  • Figure 66: Latin America Value Share and BPS Analysis by End User, 2025 and 2035
  • Figure 67: Latin America Y-o-Y Growth Comparison by End User, 2025-2035
  • Figure 68: Latin America Attractiveness Analysis by End User
  • Figure 69: Europe Value Share and BPS Analysis by Country, 2025 and 2035
  • Figure 70: Europe Value Share and BPS Analysis by Microorganism Source, 2025 and 2035
  • Figure 71: Europe Y-o-Y Growth Comparison by Microorganism Source, 2025-2035
  • Figure 72: Europe Attractiveness Analysis by Microorganism Source
  • Figure 73: Europe Value Share and BPS Analysis by Lipid Type, 2025 and 2035
  • Figure 74: Europe Y-o-Y Growth Comparison by Lipid Type, 2025-2035
  • Figure 75: Europe Attractiveness Analysis by Lipid Type
  • Figure 76: Europe Value Share and BPS Analysis by Application, 2025 and 2035
  • Figure 77: Europe Y-o-Y Growth Comparison by Application, 2025-2035
  • Figure 78: Europe Attractiveness Analysis by Application
  • Figure 79: Europe Value Share and BPS Analysis by Product Form, 2025 and 2035
  • Figure 80: Europe Y-o-Y Growth Comparison by Product Form, 2025-2035
  • Figure 81: Europe Attractiveness Analysis by Product Form
  • Figure 82: Europe Value Share and BPS Analysis by Sales Channel, 2025 and 2035
  • Figure 83: Europe Y-o-Y Growth Comparison by Sales Channel, 2025-2035
  • Figure 84: Europe Attractiveness Analysis by Sales Channel
  • Figure 85: Europe Value Share and BPS Analysis by End User, 2025 and 2035
  • Figure 86: Europe Y-o-Y Growth Comparison by End User, 2025-2035
  • Figure 87: Europe Attractiveness Analysis by End User
  • Figure 88: East Asia Value Share and BPS Analysis by Country, 2025 and 2035
  • Figure 89: East Asia Value Share and BPS Analysis by Microorganism Source, 2025 and 2035
  • Figure 90: East Asia Y-o-Y Growth Comparison by Microorganism Source, 2025-2035
  • Figure 91: East Asia Attractiveness Analysis by Microorganism Source
  • Figure 92: East Asia Value Share and BPS Analysis by Lipid Type, 2025 and 2035
  • Figure 93: East Asia Y-o-Y Growth Comparison by Lipid Type, 2025-2035
  • Figure 94: East Asia Attractiveness Analysis by Lipid Type
  • Figure 95: East Asia Value Share and BPS Analysis by Application, 2025 and 2035
  • Figure 96: East Asia Y-o-Y Growth Comparison by Application, 2025-2035
  • Figure 97: East Asia Attractiveness Analysis by Application
  • Figure 98: East Asia Value Share and BPS Analysis by Product Form, 2025 and 2035
  • Figure 99: East Asia Y-o-Y Growth Comparison by Product Form, 2025-2035
  • Figure 100: East Asia Attractiveness Analysis by Product Form
  • Figure 101: East Asia Value Share and BPS Analysis by Sales Channel, 2025 and 2035
  • Figure 102: East Asia Y-o-Y Growth Comparison by Sales Channel, 2025-2035
  • Figure 103: East Asia Attractiveness Analysis by Sales Channel
  • Figure 104: East Asia Value Share and BPS Analysis by End User, 2025 and 2035
  • Figure 105: East Asia Y-o-Y Growth Comparison by End User, 2025-2035
  • Figure 106: East Asia Attractiveness Analysis by End User
  • Figure 107: South Asia & Pacific Value Share and BPS Analysis by Country, 2025 and 2035
  • Figure 108: South Asia & Pacific Value Share and BPS Analysis by Microorganism Source, 2025 and 2035
  • Figure 109: South Asia & Pacific Y-o-Y Growth Comparison by Microorganism Source, 2025-2035
  • Figure 110: South Asia & Pacific Attractiveness Analysis by Microorganism Source
  • Figure 111: South Asia & Pacific Value Share and BPS Analysis by Lipid Type, 2025 and 2035
  • Figure 112: South Asia & Pacific Y-o-Y Growth Comparison by Lipid Type, 2025-2035
  • Figure 113: South Asia & Pacific Attractiveness Analysis by Lipid Type
  • Figure 114: South Asia & Pacific Value Share and BPS Analysis by Application, 2025 and 2035
  • Figure 115: South Asia & Pacific Y-o-Y Growth Comparison by Application, 2025-2035
  • Figure 116: South Asia & Pacific Attractiveness Analysis by Application
  • Figure 117: South Asia & Pacific Value Share and BPS Analysis by Product Form, 2025 and 2035
  • Figure 118: South Asia & Pacific Y-o-Y Growth Comparison by Product Form, 2025-2035
  • Figure 119: South Asia & Pacific Attractiveness Analysis by Product Form
  • Figure 120: South Asia & Pacific Value Share and BPS Analysis by Sales Channel, 2025 and 2035
  • Figure 121: South Asia & Pacific Y-o-Y Growth Comparison by Sales Channel, 2025-2035
  • Figure 122: South Asia & Pacific Attractiveness Analysis by Sales Channel
  • Figure 123: South Asia & Pacific Value Share and BPS Analysis by End User, 2025 and 2035
  • Figure 124: South Asia & Pacific Y-o-Y Growth Comparison by End User, 2025-2035
  • Figure 125: South Asia & Pacific Attractiveness Analysis by End User
  • Figure 126: Middle East and Africa Value Share and BPS Analysis by Country, 2025 and 2035
  • Figure 127: Middle East and Africa Value Share and BPS Analysis by Microorganism Source, 2025 and 2035
  • Figure 128: Middle East and Africa Y-o-Y Growth Comparison by Microorganism Source, 2025-2035
  • Figure 129: Middle East and Africa Attractiveness Analysis by Microorganism Source
  • Figure 130: Middle East and Africa Value Share and BPS Analysis by Lipid Type, 2025 and 2035
  • Figure 131: Middle East and Africa Y-o-Y Growth Comparison by Lipid Type, 2025-2035
  • Figure 132: Middle East and Africa Attractiveness Analysis by Lipid Type
  • Figure 133: Middle East and Africa Value Share and BPS Analysis by Application, 2025 and 2035
  • Figure 134: Middle East and Africa Y-o-Y Growth Comparison by Application, 2025-2035
  • Figure 135: Middle East and Africa Attractiveness Analysis by Application
  • Figure 136: Middle East and Africa Value Share and BPS Analysis by Product Form, 2025 and 2035
  • Figure 137: Middle East and Africa Y-o-Y Growth Comparison by Product Form, 2025-2035
  • Figure 138: Middle East and Africa Attractiveness Analysis by Product Form
  • Figure 139: Middle East and Africa Value Share and BPS Analysis by Sales Channel, 2025 and 2035
  • Figure 140: Middle East and Africa Y-o-Y Growth Comparison by Sales Channel, 2025-2035
  • Figure 141: Middle East and Africa Attractiveness Analysis by Sales Channel
  • Figure 142: Middle East and Africa Value Share and BPS Analysis by End User, 2025 and 2035
  • Figure 143: Middle East and Africa Y-o-Y Growth Comparison by End User, 2025-2035
  • Figure 144: Middle East and Africa Attractiveness Analysis by End User
  • Figure 145: Global - Tier Structure Analysis
  • Figure 146: Global - Company Share Analysis

Frequently Asked Questions

How big is the Microbial Lipids in 2025?

The global Microbial Lipids is estimated to be valued at USD 835.6 million in 2025.

What will be the size of Microbial Lipids in 2035?

The market size for the Microbial Lipids is projected to reach USD 1,487.0 million by 2035.

How much will be the Microbial Lipids growth between 2025 and 2035?

The Microbial Lipids is expected to grow at a 5.9% CAGR between 2025 and 2035.

What are the key lipid type in the Microbial Lipids?

The key lipid type in the Microbial Lipids Market are microbial oils, powders & concentrates, and emulsions & encapsulated forms, catering to varied formulation needs in food, pharma, and personal care.

Which application segment to contribute significant share in the Microbial Lipids in 2025?

In terms of application, the nutraceuticals & dietary supplements segment is projected to contribute the largest share, at 30.0% in 2025, owing to strong adoption of omega-3 enriched microbial oils in heart and brain health products.

Explore Similar Insights

Future Market Insights

Microbial Lipids Market