The Microlearning Market is estimated to be valued at USD 1.8 billion in 2025 and is projected to reach USD 6.2 billion by 2035, registering a compound annual growth rate (CAGR) of 13.5% over the forecast period.
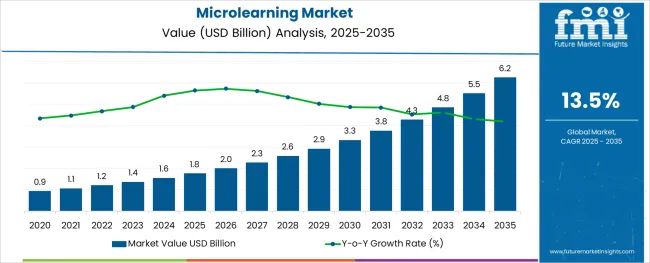
The microlearning market is experiencing sustained growth as organizations prioritize agile, accessible, and cost-effective training solutions that align with modern workforce preferences.
Increasing digital adoption, combined with shrinking employee attention spans and demand for flexible, on-demand content, has positioned microlearning as a preferred method for corporate training and skill development.
Enterprises are actively shifting from traditional learning management systems toward microlearning platforms that offer bite-sized, targeted learning modules capable of delivering measurable outcomes.
The market is segmented by Organization Size, Industry, Deployment Type, and Component and region. By Organization Size, the market is divided into SMEs and Large Enterprises. In terms of Industry, the market is classified into Retail, Manufacturing and Logistics, BFSI, Telecom and IT, Healthcare and Life Sciences, and Others.
Based on Deployment Type, the market is segmented into On-premises and Cloud. By Component, the market is divided into Solution and Services. Regionally, the market is classified into North America, Latin America, Western Europe, Eastern Europe, Balkan & Baltic Countries, Russia & Belarus, Central Asia, East Asia, South Asia & Pacific, and the Middle East & Africa.
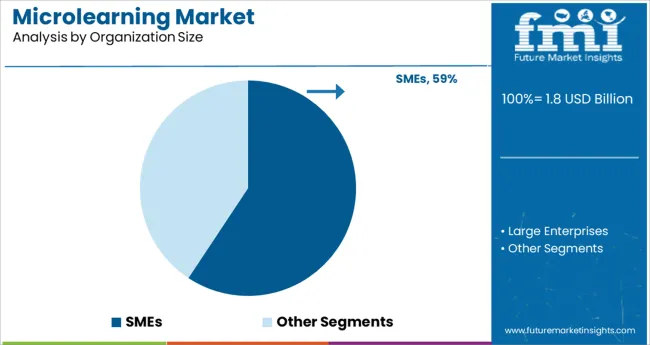
The SMEs segment accounted for approximately 59.3% of the total microlearning market share by organization size, driven by the growing need for scalable, affordable, and easily deployable training solutions that suit the operational structures of small and medium-sized enterprises.
These organizations increasingly rely on microlearning platforms to rapidly onboard employees, disseminate product updates, and deliver continuous skill development without disrupting workflows.
The flexibility offered by modular, mobile-friendly content formats has made microlearning particularly attractive to SMEs operating with limited training budgets and resource constraints.
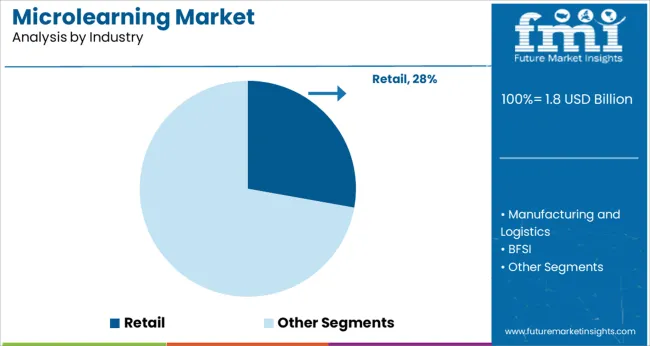
Within the industry category, the retail segment led with a 27.8% market share, supported by the sector’s inherent need for high-volume, high-frequency employee training cycles.
The rapid pace of retail operations, combined with high staff turnover rates and evolving product assortments, has made microlearning an essential tool for ensuring workforce readiness and customer engagement.
Retailers have increasingly adopted microlearning platforms to deliver product knowledge, sales techniques, and customer service modules in concise, easily digestible formats accessible via mobile devices.
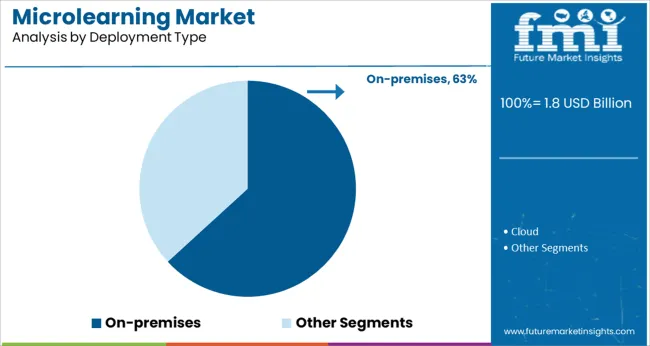
In terms of deployment type, the on-premises segment dominated the market with a 63.2% share, attributed to the preference of several large and regulated industries for enhanced data security, system control, and compliance management.
Despite the growing adoption of cloud-based learning solutions, on-premises microlearning deployments remain prevalent in sectors such as finance, government, and healthcare, where strict data governance and confidentiality protocols necessitate in-house infrastructure.
Organizations opting for on-premises solutions benefit from greater customization capabilities and seamless integration with existing enterprise systems, enabling more controlled user access and content management.
The below table presents the expected CAGR for the global microlearning market over several semi-annual periods spanning from 2025 to 2035. In the first half (H1) of the year from 2025 to 2035, the business is predicted to surge at a CAGR of 10.9%, followed by a slightly higher growth rate of 11.2% in the second half (H2) of the same year.
| Particular | Value CAGR |
|---|---|
| H1, 2025 | 10.9% (2025 to 2035) |
| H2, 2025 | 11.2% (2025 to 2035) |
| H1, 2025 | 13.5% (2025 to 2035) |
| H2, 2025 | 13.8% (2025 to 2035) |
Moving into the subsequent period, from H1 2025 to H2 2035, the CAGR is projected to increase slightly to 13.5% in the first half and remain relatively moderate at 12.8% in the second half. In the first half (H1) the market witnessed a decrease of 60 BPS while in the second half (H2), an increase of 90 BPS.
Technological Advancements and Mobile Accessibility Benefits the Business
Extensive usage of smartphones, tablets, and other portable electronic devices have spur the demand for microlearning services. Learning has become flexible and with these technologies. These service providers give students access to engaging, bite-sized knowledge accessible any time and from any location.
Personalization of learning experiences with developments in artificial intelligence and data analytics have guaranteed precise and concise knowledge follow. Students receive pertinent and interesting content catered to their unique requirements and preferences. Microlearning can be seamlessly incorporated into regular activities that raise engagement and retention rates.
Growing Demand for Continuous and Lifelong Learning Helps Trend to grow wider
Necessity for lifetime learning and ongoing skill development has grown with economic shift driven to be knowledge-based. Companies are realizing importance of maintaining a staff with newest information and abilities in stay competitive. Microlearning offers concise, easily assimilated knowledge that can be used right away. This strategy is especially helpful in sectors that are changing quickly. It is critical to keep up with emerging trends and innovations.
Microlearning offers a Cost-Effectiveness and Scalability Proven Boon to changing Economic Status
Microlearning presents an economical option for both educational institutions and students. Microlearning is modular and can be easily updated and scaled. It is typically less expensive to develop and deliver than standard training programmes.
Companies ensure knowledgeable workforce and competent, updating their training materials to reflect new information or developments in the sector. Microlearning is a desirable choice for remote workers due to its scalability. Dispersed teams can access training materials without a physical location or sophisticated infrastructure is key advantage and help in expansion.
Content Quality and Engagement Challenges hamper growth of Microlearning Market
Key challenges in this industry are ensuring the quality and engagement of information. Creating effective microlearning modules necessitates striking a balance between brevity and depth. There is a risk that overly simplistic or generic content will lack the requisite depth of knowledge or skills. This results in superficial learning. All these hurdles block growth of this sector
Learner engagement must be maintain throughout time, as the repeated nature of microlearning modules can cause learner fatigue. Ensuring content is both high-quality and engaging necessitates ongoing work and creativity. This may be costly for organizations.
The microlearning market saw notable fluctuations due to various international events and technological advancements. Supply chain disruptions and economic instability impacted the growth of this industry. The microlearning industry was set to a valuation of USD 0.9 million in 2020 with a CAGR of 11.7% from 2020 to 2025.
Upsurge in smart phones and an increasing desire for adaptable and effective training programmes profits this services. The company across various sectors have adopted microlearning to meet the needs of a rapidly changing workforce. They are emphasizing the importance of continual and personalized learning opportunities.
They are highlighting the need for scalable and accessible training methods. To suit the diverse demands of learners and organizations, the microlearning area experienced a surge in the development of platforms, tools, and content libraries.
Continuing technology advancements and growing emphasis on upskilling and lifetime learning have triggered the expansion of microlearning in current scenario. Delivering highly personalized and adaptive learning experiences will improve learner engagement and outcomes. Artificial intelligence and data analytics are integrated into microlearning systems proving to be guardrails in the progress of this landscape.
The emergence of immersive technologies like virtual and augmented reality will enhance microlearning content by offering more engaging and lifelike learning settings. The demand for scalable, on-demand learning solutions will fuel the ongoing trend towards remote work and globally integrated teams.
Tier 1 Companies that comprise leaders with the largest revenue also hold a sizable share in the worldwide landscape. These industry giants stand out due to their broad range of products and well-known brands. These industry leaders stand out due to their wide global reach, depth of experience, and active customer base. They use the newest technology to offer a wide range of series, including different microlearning solutions. Prominent companies within tier 1 include Cornerstone OnDemand Inc., IBM Corporation (IBM Talent Management), Saba Software (now part of LRN).
Tier 2 Companies are mid-sized enterprises with a presence in specific regions and a strong influence on the industry in those locations. These are distinguished by a strong presence abroad and extensive understanding. These giants have advanced technologies and a broad worldwide reach. Prominent companies in tier 2 include CrossKnowledge, ELB Learning, Epignosis, Gnowbe Group Ltd, GoSkills Ltd, Inkling, Axonify Inc., Bigtincan.
Tier 3 includes the majority of small-scale companies operating at the local presence and serving niche markets having revenue below USD 50 million. These companies are remarkably oriented towards fulfilling local demands and are consequently classified within the tier 3 share segment. They are small-scale players and have limited geographical reach. Tier 3, within this context, is recognized as an unorganized space, representing a sector characterized by a lack of extensive structure and formalization when compared to organized competitors. This tier includes the Inkling, Mindtree Limited and SwissVBS
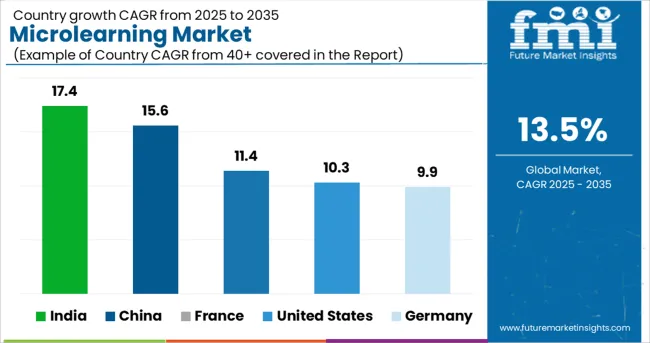
| Countries | Value CAGR (2025 to 2035) |
|---|---|
| India | 17.4% |
| China | 15.6% |
| France | 11.4% |
| United States | 10.3% |
| Germany | 9.9% |
The section below covers the industry analysis for the microlearning market for different countries. The demand analysis on key countries in several countries of the globe, including United States, Germany, France, China and India is given.
The United States is anticipated to remain at the forefront in North America, with a value share of 62.5% through 2035. In South Asia and Pacific, India is projected to witness a CAGR of 17.4% by 2035.
South Asia and Pacific, spearheaded by the India currently holds around 32.1% market share of the microlearning industry.
India has increased demand for skill development and pervasive mobile device use are driving growth in the microlearning market in that country. To meet the demands of a dynamic job, there is a strong need for ongoing skill upgrading in a workforce that is young and expanding quickly.
Microlearning offers a productive and adaptable means of delivering focused training and upskilling programmes, assisting people in rapidly picking up new abilities and information. This is especially crucial in India, where conventional educational institutions might not always be able to keep up with the changing demands of the business.
Moreover, India has a substantial and growing population of smartphone users, which promotes the uptake of microlearning. Because mobile learning solutions can reach a wide audience in India, including those in remote and rural locations, they are especially well-suited for the Indian space.
Microlearning is an effective and scalable approach for training and education because mobile devices are accessible and affordable. Microlearning services are broadening in India as businesses and educational institutions become more aware of its advantages.
East asia, led by the china currently holds around 58.1% market share of the microlearning industry. China is anticipated to grow at a CAGR of 15.6% throughout the forecast period.
The microlearning is growing rapidly in China as a result of swift technical adoption and robust government assistance. As part of a larger plan to improve human capital and competitiveness, the chinese government has been aggressively pushing lifelong learning and digital education.
The expansion of e-learning and microlearning platforms is encouraged by initiatives like the "Internet Plus Education" policy, which promotes the integration of internet technology into education. This support from the government creates an atmosphere that is favorable for the spread of microlearning programmes throughout the country.
Furthermore, internet and smartphone usage are expanding at rapid pace in China, especially in metropolitan areas. Because of this digital infrastructure, microlearning is widely used and learners can access instructional materials from any location at any time.
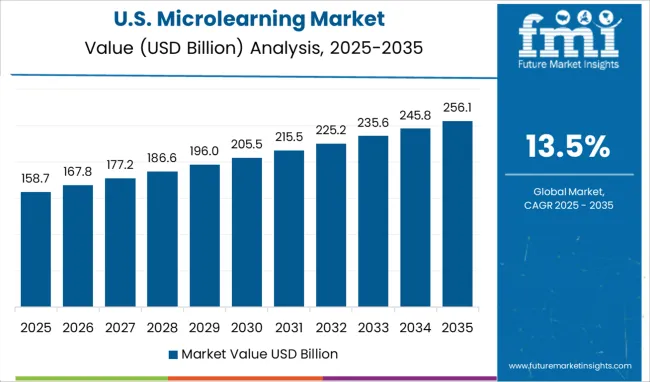
The United States microlearning space is poised to exhibit a CAGR of 10.3% between 2025 and 2035.
The United States has significant emphasis on workforce development and technical innovation is driving the country's microlearning sector rapid growth. The development and dissemination of microlearning content are accessible by the broad availability and use of leading-edge technologies. Artificial intelligence (AI), big data, and mobile platforms bodes well with propulsion of this landscape.
The United States based companies are using these technologies to offer highly customized and interesting learning opportunities. This services cater to the individual demands of their staff members. This strategy keeps companies competitive by guaranteeing that their personnel is constantly reskilled and upskilled to meet changing demands.
The section contains information about the leading segments in the industry. By component, the services segment is estimated to grow at a CAGR of 14.9% throughout 2035. Additionally, by deployment type, the cloud segment is projected to expand at a CAGR of 16.9% during forecasted period.
| Component | Solution |
|---|---|
| Value Share (2025) | 58.8% |
The solution segment dominates the market in terms of revenue, accounting for almost 58.8% of the market share in 2025.
The solutions segment holds the highest share in the microlearning market and dominates it thanks to its wide range of platforms, tools, and content libraries that meet a variety of learning requirements.
The specialized software and applications in this section are made to provide bite-sized, interactive learning modules, which are essential for meeting the changing needs of contemporary organizations and learners.
The solutions provided are highly adaptable and customizable, allowing organizations to personalize material to individual jobs, talents, and interests, hence increasing engagement and effectiveness.
| Deployment type | On-premises |
|---|---|
| Value Share (2025) | 63.2% |
The on-premises segment is forecast to account for a market shares of 63.2% over in the microlearning market by 2025 end.
It is projected that on-premises deployment will hold the largest share in the microlearning sector by 2025 as a result of multiple important considerations. Organizations frequently choose on-premises solutions for better control over data security and compliance, especially in industries like manufacturing and logistics, BFSI, telecom and IT, healthcare, and life sciences.
Furthermore, larger companies that have made significant investments in their IT infrastructure tend to favor on-premises solutions in order to make the most of their current systems and easily incorporate microlearning platforms into their already-established ecosystems.
Enhancing customization and scalability is another benefit of this technique, which guarantees that the microlearning solutions may be adjusted to fit certain organizational requirements and growth paths. Because of this, enterprises that priorities security, compliance, and integration find that on-premises microlearning systems offer a strong value proposition.
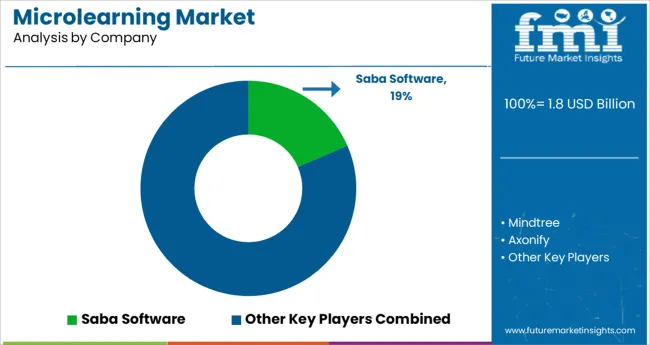
Key players in the microlearning market are investing in innovative reconditioning facilities while also forming collaborations. Key microlearning vendors have also been purchasing small vendors to expand their footprint and penetrate the market in multiple regions.
Recent Industry Developments in Microlearning Market
In terms of type, the industry is divided into solution and services.
In terms of platform, the industry is segregated into on-premises and cloud.
The device type is classified by industries as retail, manufacturing and logistics, BFSI, telecom and IT, healthcare and life sciences and others.
The sector is distributed into SMEs and large enterprises.
Key countries of North America, Latin America, Western Europe, Eastern Europe, East Asia, South Asia & pacific, Middle East and Africa (MEA) have been covered in the report.
The global microlearning market is estimated to be valued at USD 1.8 billion in 2025.
It is projected to reach USD 6.2 billion by 2035.
The market is expected to grow at a 13.5% CAGR between 2025 and 2035.
The key product types are smes and large enterprises.
retail segment is expected to dominate with a 27.8% industry share in 2025.


Full Research Suite comprises of:
Market outlook & trends analysis
Interviews & case studies
Strategic recommendations
Vendor profiles & capabilities analysis
5-year forecasts
8 regions and 60+ country-level data splits
Market segment data splits
12 months of continuous data updates
DELIVERED AS:
PDF EXCEL ONLINE
Microlearning Platforms Market Size and Share Forecast Outlook 2025 to 2035

Thank you!
You will receive an email from our Business Development Manager. Please be sure to check your SPAM/JUNK folder too.
Chat With
MaRIA