Reports

- Global Locations -

Headquarters

Future Market Insights, Inc.

Christiana Corporate, 200
Continental Drive, Suite 401,
Newark, Delaware - 19713,
United States

T: +1-845-579-5705

Americas

Future Market Insights, Inc.

616 Corporate Way, Suite 2-9018,
Valley Cottage, NY 10989, United States

T: +1-347-918-3531

MEA

Future Market Insights

1602-6 Jumeirah Bay X2 Tower, Plot No: JLT-PH2-X2A,
Jumeirah Lakes Towers, Dubai,
United Arab Emirates

Europe

Future Market Insights

3rd Floor, 207 Regent Street,
W1B 3HH London
United Kingdom

T: + 44 (0) 20 8123 9659
D: +44 (0) 20 3287 4268

Asia Pacific

Future Market Insights

IndiaLand Global Tech Park, Unit UG-1, Behind Grand HighStreet, Phase 1, Hinjawadi, MH, Pune – 411057, India

Microlearning Platforms Market Outlook (2023 to 2033)

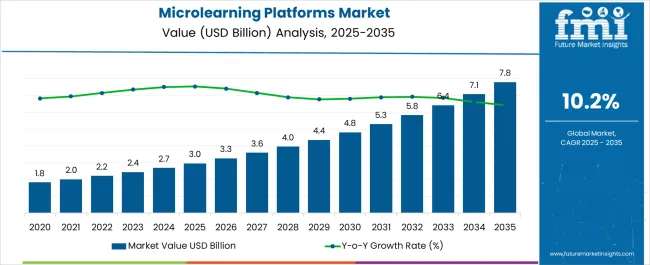
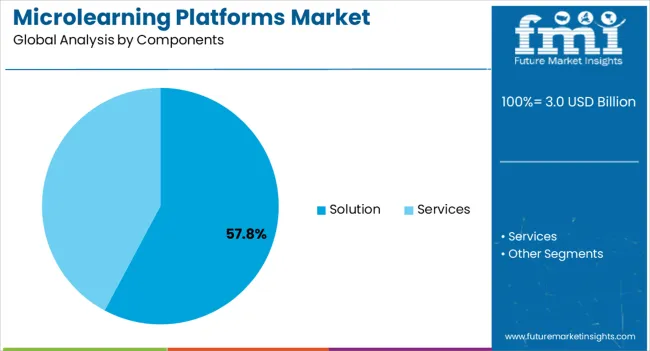
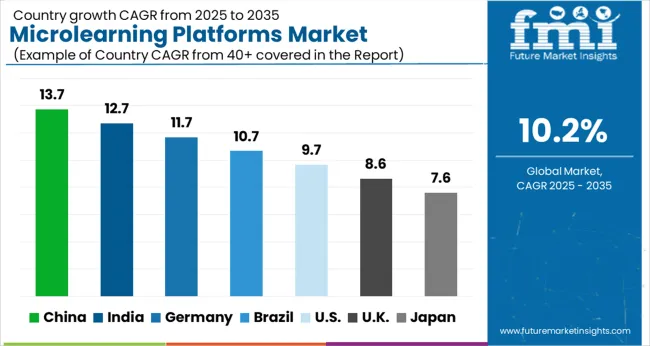
The global microlearning platforms market is estimated to be valued at US$ 2,412.6 million in 2023. With a CAGR of 10.7% projected growth during 2023 to 2033, the market is expected to reach a valuation of US$ 6,687.6 million by 2033. The services segment is expected to be the highest revenue generating category in category insights, projected to register a CAGR of 10.4% during 2023 to 2033.

Attributes Details
Global Microlearning Platforms Market Size (2023) US$ 2,412.6 million
Global Microlearning Platforms Market Size (2033) US$ 6,687.6 million
Global Microlearning Platforms Market CAGR (2023 to 2033) 10.7%
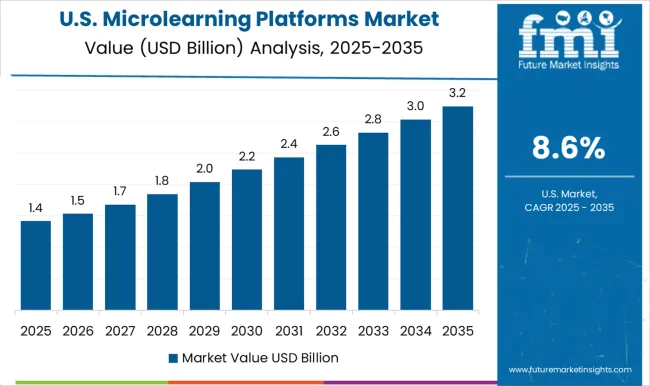
United States Microlearning Platforms Market Size (2033) US$ 2 billion
United States Microlearning Platforms Market CAGR (2023 to 2033) 10.4%

Don't pay for what you don't need

Customize your report by selecting specific countries or regions and save 30%!

Revenue of Microlearning Platforms Market from 2018 to 2022 Compared to Demand Outlook for 2023 to 2033

As per the Microlearning Platforms Market research by Future Market Insights - a market research and competitive intelligence provider, historically, from 2018 to 2023, market value of the microlearning platforms increased at around 8.6% CAGR. With an absolute dollar opportunity of US$ 3.5 billion during 2023 to 2033, the market is projected to reach a valuation of US$ 5.5 billion by 2033, at a CAGR of 10.6%.

The market is being driven by the increasing adoption and availability of the cloud, which provides the platform and infrastructure to address the scalability limitations of on-premise microlearning experiences. Microlearning is also becoming more widely used in gamification for customer engagement and value creation. Furthermore, millennials' increasing demand for high flexibility and a variety of jobs has resulted in half of the workforce being made up of freelancers who change jobs frequently and combine different projects at different organizations rather than working long hours. As a result, microlearning solution providers are increasingly targeting these freelancers.

Microlearning platforms are used as corporate learning solutions by HR and learning and development departments. These training solutions provide employees with short bursts of targeted instructional information that fit into a daily workflow and are accessible on any device. Companies can either create their own learning materials or use a pre-existing library of video, animation, and text-based learning materials. Corporate learning management systems (LMS) and learning experience platform (LEP) software are not the same as microlearning platforms. LEPs and micro-learning platforms assist organizations with a variety of challenges, as well as their target audiences. LEPs frequently provide employee-driven, computer- or desk-based instructional content.

Microlearning provides businesses with a centralized solution for providing effective training and education to the stakeholders including employees, workers, and channel partners. The learning methodologies used in corporate training programs are changing.

Traditional classroom training is gradually being surpassed by online learning methods that provide learners with greater flexibility. Businesses are focusing on providing employees with a better learning experience through a variety of engaging learning and development activities. As a result, businesses are eager to adopt training methods that are directly oriented toward a learning objective, such as specific skills or compliance understanding.

Region-wise Analysis

North America Predicted to Dominate Microlearning Platforms Market.

In 2022, North America was the largest regional segment of the microlearning market. The significant increase in the adoption of technology by numerous organizations to provide adequate training to their employees is largely responsible for the region's growth. In North America, the United States and Canada are the most important markets for microlearning. The market in the region will grow at a faster rate than the market in Europe.

In North America, the demand for education technologies started with schools and colleges converting traditional classrooms to digital classrooms by investing in basic hardware and software solutions. Advances in information technology have transformed communication and educational practices. Technology is transforming K-12 and higher education by offering teachers the ability to reject distracting educational technologies. Schools use personalized learning and job-embedded professional learning to meet the demands of teaching schedules and to support teachers' learning styles.

The number of smartphone subscribers in North America is expected to reach 328 Mn by 2025, according to the GSMA. Furthermore, by 2025, the region's mobile subscribers with 86% and internet penetration rates of 80% may rise to the second highest in the world. The virtual reality market in the region will benefit from increased device penetration. According to an IBM study, 75% of Gen-Zers prefer to use a smartphone over other mobile devices. As a result, a mobile-focused microlearning training strategy will become more popular in the future to keep them interested in learning.
Sudip Saha
Sudip Saha

Principal Consultant

Talk to Analyst

Find your sweet spots for generating winning opportunities in this market.

Country-wise Analysis

United States Lies at the CenterStage for Microlearning Platforms Revenue

The United States is expected to account for the highest market share of US$ 2 billion by the end of 2033 with an absolute dollar growth opportunity of US$ 1.3 billion. By 2033, the United States is likely to account for nearly 40% of the global microlearning market. It is rising as a result of many organizations’ rapid technological adoption and failure to provide adequate training to their employees. Microlearning providers in the country will benefit largely from the growth of e-learning.

Gamification's ability to increase engagement and loyalty by an average of 30% in time, on-site, repeat visits, and viral distribution attracted organizations in the United States. Apart from participation, the revenue effects of gamification are also impressive. Autodesk, an American multinational software company, increased trial usage by 40% and conversion rates by 15%, while Extraco Bank increased customer acquisitions by 700%.

Category-wise Insights

IT & Telecommunication Industries Dominates Other Application Segments in the Market

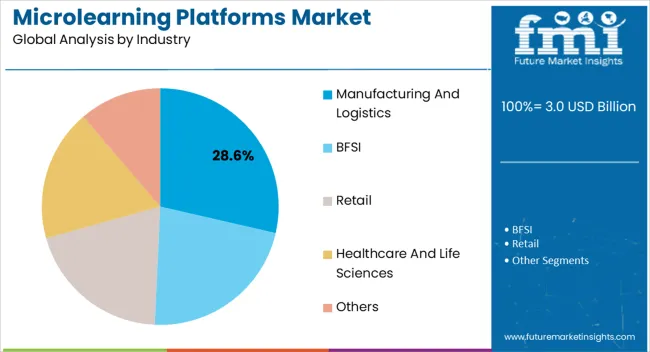
IT & telecom industries dominated the other sub-segments with a CAGR of 10.2% during the forecast period 2023 to 2033. Microlearning's rapid growth is due to an increase in the number of smartphones and mobile devices, which has created a large base for gamification in the microlearning market.

The high recognition of gamification systems as a method to architect human behavior to induce innovation, productivity, or engagement is fueling growth. According to an article published in Harvard Business Review, gamification improves customer retention by 5%, increases profits by 25% to 95%, and can help businesses achieve better results. Scanning codes on products can be provided by brands, and customers can receive a certain number of loyalty points by scanning the code.

During the forecast period, enterprise gamification in training, productivity, and skill enhancement is expected to grow significantly. Collaboration systems, which do not create a competitive environment and are widely considered counterproductive, have shown a strong preference among organizations. Gamification in microlearning solutions also serves as a useful tool for increasing employee overall productivity through a variety of methods, such as rewards for task completion in project management or data contribution or access in knowledge management.

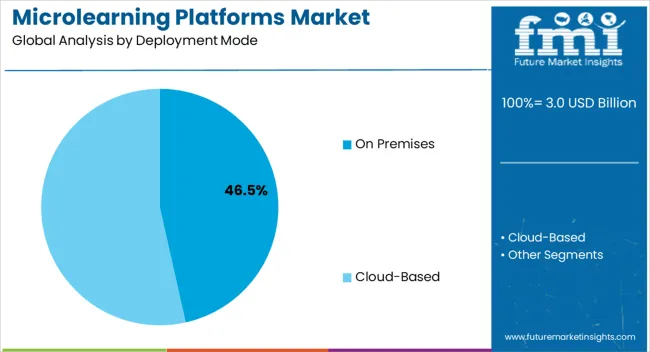
On-premises Deployment Segment to Lead Microlearning Platforms Market

The client organization's server hosts the on-premises microlearning solution, however, the user or buyer must purchase a license to use the microlearning solution, which is also customizable. The buyer's internal IT staff handles the setup and maintenance, and the buyer has complete control over the microlearning solution.

Enterprises can use the on-premises microlearning solution to create, store, and deliver business-critical data while also controlling access to training programs. On-premises microlearning solutions are losing market share as these applications require large upfront investments and long-term developer commitment. Enterprises that rely on the continuous availability of a learning system for the success of their business processes use on-premises microlearning solution.

By deploying an on-premises microlearning solution, businesses gain more control over the infrastructure investments they make, as well as lower overall network costs.

However, cloud-based microlearning is expected to gain traction across industries as the demand for scalable and cost-effective solutions grows. Users log into the service provider's site to access cloud-based microlearning solutions, which are hosted over an internet connection. Trainers can use their web browsers to upload course content, create new courses, and interact with students without having to install any management software.
Get the data you need at a Fraction of the cost

Personalize your report by choosing insights you need
and save 40%!

Competitive Analysis

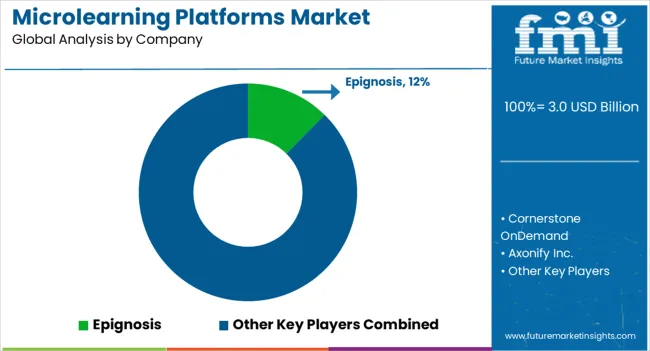
In a fast-growing education sector, the market is fragmented, with many local and regional players competing with one another. Players in the microlearning market are working to deliver their content in an interactive format that will pique learners' interest in these training platforms. Microlearning platform providers are also focusing on innovation and strategic partnerships with other vendors to expand their service offerings and meet the demands of an expanding customer base. Some of the leading players include Epignosis, Cornerstone OnDemand, Axonify Inc., iSpring Solutions Inc., and Bigtincan.

Some of the recent developments of microlearning platforms market are as follows :

  • In January 2021, Bigtincan announced that it will create training and development programs for small businesses with the goal of helping them grow. Training and development help to avoid breakdowns and prepares employees for the future.
  • In December 2021, Larsen and Toubro Ltd. partnered with Kemroc Ink to distribute the latter's products in India. The company and the Tamil Nadu government signed an agreement in November 2021 to build a data center in Kanchipuram.
  • In December 2021, Cornerstone OnDemand Inc partnered with WaitWhat, which brings masters of scale podcasts and courses to cornerstone customers.
  • In January 2020, Cornerstone OnDemand, Inc. announced the acquisition of Cluster, a French technology firm that developed an AI-powered skills engine and extensive skills ontology that is used by key global brands such as Carrefour and SNCF.

Market Segments Covered in Microlearning Platforms Market Analysis

By Deployment Mode :

  • On Premises
  • Cloud-based

By Components :

  • Solution
  • Services

By Industry :

  • Manufacturing and Logistics
  • BFSI
  • Retail
  • Healthcare and Life Sciences
  • Others

By Region :

  • North America
  • Europe
  • Asia Pacific
  • Middle East and Africa
  • Latin America

Frequently Asked Questions

How big is the Microlearning Platforms Market?

The market is valued at US$ 2.4 billion in 2023. 

Who are the Key Market Players? 

Epignosis, Cornerstone OnDemand, Axonify Inc.,are key market players. 

What is the growth forecast for the Market? 

The market is forecast to register a CAGR of 10.7% through 2033. 

How is the historical performance of the market? 

From 2018 to 2022, the market registered a CAGR of 8.6%. 

What is the expected share of the market in the United States in 2033? 

The United States to hold a market share of 40% in 2033.

Table of Content

1. Executive Summary

    1.1. Global Market Outlook

    1.2. Demand-side Trends

    1.3. Supply-side Trends

    1.4. Technology Roadmap Analysis

    1.5. Analysis and Recommendations

2. Market Overview

    2.1. Market Coverage / Taxonomy

    2.2. Market Definition / Scope / Limitations

3. Market Background

    3.1. Market Dynamics

        3.1.1. Drivers

        3.1.2. Restraints

        3.1.3. Opportunity

        3.1.4. Trends

    3.2. Scenario Forecast

        3.2.1. Demand in Optimistic Scenario

        3.2.2. Demand in Likely Scenario

        3.2.3. Demand in Conservative Scenario

    3.3. Opportunity Map Analysis

    3.4. Investment Feasibility Matrix

    3.5. PESTLE and Porter’s Analysis

    3.6. Regulatory Landscape

        3.6.1. By Key Regions

        3.6.2. By Key Countries

    3.7. Regional Parent Market Outlook

4. Global Market Analysis 2018 to 2022 and Forecast, 2023 to 2033

    4.1. Historical Market Size Value (US$ Million) Analysis, 2018 to 2022

    4.2. Current and Future Market Size Value (US$ Million) Projections, 2023 to 2033

        4.2.1. Y-o-Y Growth Trend Analysis

        4.2.2. Absolute $ Opportunity Analysis

5. Global Market Analysis 2018 to 2022 and Forecast 2023 to 2033, By Deployment Mode

    5.1. Introduction / Key Findings

    5.2. Historical Market Size Value (US$ Million) Analysis By Deployment Mode, 2018 to 2022

    5.3. Current and Future Market Size Value (US$ Million) Analysis and Forecast By Deployment Mode, 2023 to 2033

        5.3.1. On Premises

        5.3.2. Cloud-based

    5.4. Y-o-Y Growth Trend Analysis By Deployment Mode, 2018 to 2022

    5.5. Absolute $ Opportunity Analysis By Deployment Mode, 2023 to 2033

6. Global Market Analysis 2018 to 2022 and Forecast 2023 to 2033, By Components

    6.1. Introduction / Key Findings

    6.2. Historical Market Size Value (US$ Million) Analysis By Components, 2018 to 2022

    6.3. Current and Future Market Size Value (US$ Million) Analysis and Forecast By Components, 2023 to 2033

        6.3.1. Solution

        6.3.2. Services

    6.4. Y-o-Y Growth Trend Analysis By Components, 2018 to 2022

    6.5. Absolute $ Opportunity Analysis By Components, 2023 to 2033

7. Global Market Analysis 2018 to 2022 and Forecast 2023 to 2033, By Industry

    7.1. Introduction / Key Findings

    7.2. Historical Market Size Value (US$ Million) Analysis By Industry , 2018 to 2022

    7.3. Current and Future Market Size Value (US$ Million) Analysis and Forecast By Industry , 2023 to 2033

        7.3.1. Manufacturing and Logistics

        7.3.2. BFSI

        7.3.3. Retail

        7.3.4. Healthcare and Life Sciences

        7.3.5. Others

    7.4. Y-o-Y Growth Trend Analysis By Industry , 2018 to 2022

    7.5. Absolute $ Opportunity Analysis By Industry , 2023 to 2033

8. Global Market Analysis 2018 to 2022 and Forecast 2023 to 2033, By Region

    8.1. Introduction

    8.2. Historical Market Size Value (US$ Million) Analysis By Region, 2018 to 2022

    8.3. Current Market Size Value (US$ Million) Analysis and Forecast By Region, 2023 to 2033

        8.3.1. North America

        8.3.2. Latin America

        8.3.3. Western Europe

        8.3.4. Eastern Europe

        8.3.5. South Asia and Pacific

        8.3.6. East Asia

        8.3.7. Middle East and Africa

    8.4. Market Attractiveness Analysis By Region

9. North America Market Analysis 2018 to 2022 and Forecast 2023 to 2033, By Country

    9.1. Historical Market Size Value (US$ Million) Trend Analysis By Market Taxonomy, 2018 to 2022

    9.2. Market Size Value (US$ Million) Forecast By Market Taxonomy, 2023 to 2033

        9.2.1. By Country

            9.2.1.1. USA

            9.2.1.2. Canada

        9.2.2. By Deployment Mode

        9.2.3. By Components

        9.2.4. By Industry

    9.3. Market Attractiveness Analysis

        9.3.1. By Country

        9.3.2. By Deployment Mode

        9.3.3. By Components

        9.3.4. By Industry

    9.4. Key Takeaways

10. Latin America Market Analysis 2018 to 2022 and Forecast 2023 to 2033, By Country

    10.1. Historical Market Size Value (US$ Million) Trend Analysis By Market Taxonomy, 2018 to 2022

    10.2. Market Size Value (US$ Million) Forecast By Market Taxonomy, 2023 to 2033

        10.2.1. By Country

            10.2.1.1. Brazil

            10.2.1.2. Mexico

            10.2.1.3. Rest of Latin America

        10.2.2. By Deployment Mode

        10.2.3. By Components

        10.2.4. By Industry

    10.3. Market Attractiveness Analysis

        10.3.1. By Country

        10.3.2. By Deployment Mode

        10.3.3. By Components

        10.3.4. By Industry

    10.4. Key Takeaways

11. Western Europe Market Analysis 2018 to 2022 and Forecast 2023 to 2033, By Country

    11.1. Historical Market Size Value (US$ Million) Trend Analysis By Market Taxonomy, 2018 to 2022

    11.2. Market Size Value (US$ Million) Forecast By Market Taxonomy, 2023 to 2033

        11.2.1. By Country

            11.2.1.1. Germany

            11.2.1.2. UK

            11.2.1.3. France

            11.2.1.4. Spain

            11.2.1.5. Italy

            11.2.1.6. Rest of Western Europe

        11.2.2. By Deployment Mode

        11.2.3. By Components

        11.2.4. By Industry

    11.3. Market Attractiveness Analysis

        11.3.1. By Country

        11.3.2. By Deployment Mode

        11.3.3. By Components

        11.3.4. By Industry

    11.4. Key Takeaways

12. Eastern Europe Market Analysis 2018 to 2022 and Forecast 2023 to 2033, By Country

    12.1. Historical Market Size Value (US$ Million) Trend Analysis By Market Taxonomy, 2018 to 2022

    12.2. Market Size Value (US$ Million) Forecast By Market Taxonomy, 2023 to 2033

        12.2.1. By Country

            12.2.1.1. Poland

            12.2.1.2. Russia

            12.2.1.3. Czech Republic

            12.2.1.4. Romania

            12.2.1.5. Rest of Eastern Europe

        12.2.2. By Deployment Mode

        12.2.3. By Components

        12.2.4. By Industry

    12.3. Market Attractiveness Analysis

        12.3.1. By Country

        12.3.2. By Deployment Mode

        12.3.3. By Components

        12.3.4. By Industry

    12.4. Key Takeaways

13. South Asia and Pacific Market Analysis 2018 to 2022 and Forecast 2023 to 2033, By Country

    13.1. Historical Market Size Value (US$ Million) Trend Analysis By Market Taxonomy, 2018 to 2022

    13.2. Market Size Value (US$ Million) Forecast By Market Taxonomy, 2023 to 2033

        13.2.1. By Country

            13.2.1.1. India

            13.2.1.2. Bangladesh

            13.2.1.3. Australia

            13.2.1.4. New Zealand

            13.2.1.5. Rest of South Asia and Pacific

        13.2.2. By Deployment Mode

        13.2.3. By Components

        13.2.4. By Industry

    13.3. Market Attractiveness Analysis

        13.3.1. By Country

        13.3.2. By Deployment Mode

        13.3.3. By Components

        13.3.4. By Industry

    13.4. Key Takeaways

14. East Asia Market Analysis 2018 to 2022 and Forecast 2023 to 2033, By Country

    14.1. Historical Market Size Value (US$ Million) Trend Analysis By Market Taxonomy, 2018 to 2022

    14.2. Market Size Value (US$ Million) Forecast By Market Taxonomy, 2023 to 2033

        14.2.1. By Country

            14.2.1.1. China

            14.2.1.2. Japan

            14.2.1.3. South Korea

        14.2.2. By Deployment Mode

        14.2.3. By Components

        14.2.4. By Industry

    14.3. Market Attractiveness Analysis

        14.3.1. By Country

        14.3.2. By Deployment Mode

        14.3.3. By Components

        14.3.4. By Industry

    14.4. Key Takeaways

15. Middle East and Africa Market Analysis 2018 to 2022 and Forecast 2023 to 2033, By Country

    15.1. Historical Market Size Value (US$ Million) Trend Analysis By Market Taxonomy, 2018 to 2022

    15.2. Market Size Value (US$ Million) Forecast By Market Taxonomy, 2023 to 2033

        15.2.1. By Country

            15.2.1.1. GCC Countries

            15.2.1.2. South Africa

            15.2.1.3. Israel

            15.2.1.4. Rest of MEA

        15.2.2. By Deployment Mode

        15.2.3. By Components

        15.2.4. By Industry

    15.3. Market Attractiveness Analysis

        15.3.1. By Country

        15.3.2. By Deployment Mode

        15.3.3. By Components

        15.3.4. By Industry

    15.4. Key Takeaways

16. Key Countries Market Analysis

    16.1. USA

        16.1.1. Pricing Analysis

        16.1.2. Market Share Analysis, 2022

            16.1.2.1. By Deployment Mode

            16.1.2.2. By Components

            16.1.2.3. By Industry

    16.2. Canada

        16.2.1. Pricing Analysis

        16.2.2. Market Share Analysis, 2022

            16.2.2.1. By Deployment Mode

            16.2.2.2. By Components

            16.2.2.3. By Industry

    16.3. Brazil

        16.3.1. Pricing Analysis

        16.3.2. Market Share Analysis, 2022

            16.3.2.1. By Deployment Mode

            16.3.2.2. By Components

            16.3.2.3. By Industry

    16.4. Mexico

        16.4.1. Pricing Analysis

        16.4.2. Market Share Analysis, 2022

            16.4.2.1. By Deployment Mode

            16.4.2.2. By Components

            16.4.2.3. By Industry

    16.5. Germany

        16.5.1. Pricing Analysis

        16.5.2. Market Share Analysis, 2022

            16.5.2.1. By Deployment Mode

            16.5.2.2. By Components

            16.5.2.3. By Industry

    16.6. UK

        16.6.1. Pricing Analysis

        16.6.2. Market Share Analysis, 2022

            16.6.2.1. By Deployment Mode

            16.6.2.2. By Components

            16.6.2.3. By Industry

    16.7. France

        16.7.1. Pricing Analysis

        16.7.2. Market Share Analysis, 2022

            16.7.2.1. By Deployment Mode

            16.7.2.2. By Components

            16.7.2.3. By Industry

    16.8. Spain

        16.8.1. Pricing Analysis

        16.8.2. Market Share Analysis, 2022

            16.8.2.1. By Deployment Mode

            16.8.2.2. By Components

            16.8.2.3. By Industry

    16.9. Italy

        16.9.1. Pricing Analysis

        16.9.2. Market Share Analysis, 2022

            16.9.2.1. By Deployment Mode

            16.9.2.2. By Components

            16.9.2.3. By Industry

    16.10. Poland

        16.10.1. Pricing Analysis

        16.10.2. Market Share Analysis, 2022

            16.10.2.1. By Deployment Mode

            16.10.2.2. By Components

            16.10.2.3. By Industry

    16.11. Russia

        16.11.1. Pricing Analysis

        16.11.2. Market Share Analysis, 2022

            16.11.2.1. By Deployment Mode

            16.11.2.2. By Components

            16.11.2.3. By Industry

    16.12. Czech Republic

        16.12.1. Pricing Analysis

        16.12.2. Market Share Analysis, 2022

            16.12.2.1. By Deployment Mode

            16.12.2.2. By Components

            16.12.2.3. By Industry

    16.13. Romania

        16.13.1. Pricing Analysis

        16.13.2. Market Share Analysis, 2022

            16.13.2.1. By Deployment Mode

            16.13.2.2. By Components

            16.13.2.3. By Industry

    16.14. India

        16.14.1. Pricing Analysis

        16.14.2. Market Share Analysis, 2022

            16.14.2.1. By Deployment Mode

            16.14.2.2. By Components

            16.14.2.3. By Industry

    16.15. Bangladesh

        16.15.1. Pricing Analysis

        16.15.2. Market Share Analysis, 2022

            16.15.2.1. By Deployment Mode

            16.15.2.2. By Components

            16.15.2.3. By Industry

    16.16. Australia

        16.16.1. Pricing Analysis

        16.16.2. Market Share Analysis, 2022

            16.16.2.1. By Deployment Mode

            16.16.2.2. By Components

            16.16.2.3. By Industry

    16.17. New Zealand

        16.17.1. Pricing Analysis

        16.17.2. Market Share Analysis, 2022

            16.17.2.1. By Deployment Mode

            16.17.2.2. By Components

            16.17.2.3. By Industry

    16.18. China

        16.18.1. Pricing Analysis

        16.18.2. Market Share Analysis, 2022

            16.18.2.1. By Deployment Mode

            16.18.2.2. By Components

            16.18.2.3. By Industry

    16.19. Japan

        16.19.1. Pricing Analysis

        16.19.2. Market Share Analysis, 2022

            16.19.2.1. By Deployment Mode

            16.19.2.2. By Components

            16.19.2.3. By Industry

    16.20. South Korea

        16.20.1. Pricing Analysis

        16.20.2. Market Share Analysis, 2022

            16.20.2.1. By Deployment Mode

            16.20.2.2. By Components

            16.20.2.3. By Industry

    16.21. GCC Countries

        16.21.1. Pricing Analysis

        16.21.2. Market Share Analysis, 2022

            16.21.2.1. By Deployment Mode

            16.21.2.2. By Components

            16.21.2.3. By Industry

    16.22. South Africa

        16.22.1. Pricing Analysis

        16.22.2. Market Share Analysis, 2022

            16.22.2.1. By Deployment Mode

            16.22.2.2. By Components

            16.22.2.3. By Industry

    16.23. Israel

        16.23.1. Pricing Analysis

        16.23.2. Market Share Analysis, 2022

            16.23.2.1. By Deployment Mode

            16.23.2.2. By Components

            16.23.2.3. By Industry

17. Market Structure Analysis

    17.1. Competition Dashboard

    17.2. Competition Benchmarking

    17.3. Market Share Analysis of Top Players

        17.3.1. By Regional

        17.3.2. By Deployment Mode

        17.3.3. By Components

        17.3.4. By Industry

18. Competition Analysis

    18.1. Competition Deep Dive

        18.1.1. Epignosis

            18.1.1.1. Overview

            18.1.1.2. Product Portfolio

            18.1.1.3. Profitability by Market Segments

            18.1.1.4. Sales Footprint

            18.1.1.5. Strategy Overview

                18.1.1.5.1. Marketing Strategy

        18.1.2. Cornerstone OnDemand

            18.1.2.1. Overview

            18.1.2.2. Product Portfolio

            18.1.2.3. Profitability by Market Segments

            18.1.2.4. Sales Footprint

            18.1.2.5. Strategy Overview

                18.1.2.5.1. Marketing Strategy

        18.1.3. Axonify Inc.

            18.1.3.1. Overview

            18.1.3.2. Product Portfolio

            18.1.3.3. Profitability by Market Segments

            18.1.3.4. Sales Footprint

            18.1.3.5. Strategy Overview

                18.1.3.5.1. Marketing Strategy

        18.1.4. iSpring Solutions Inc.

            18.1.4.1. Overview

            18.1.4.2. Product Portfolio

            18.1.4.3. Profitability by Market Segments

            18.1.4.4. Sales Footprint

            18.1.4.5. Strategy Overview

                18.1.4.5.1. Marketing Strategy

        18.1.5. Bigtincan

            18.1.5.1. Overview

            18.1.5.2. Product Portfolio

            18.1.5.3. Profitability by Market Segments

            18.1.5.4. Sales Footprint

            18.1.5.5. Strategy Overview

                18.1.5.5.1. Marketing Strategy

        18.1.6. IBM Corporation

            18.1.6.1. Overview

            18.1.6.2. Product Portfolio

            18.1.6.3. Profitability by Market Segments

            18.1.6.4. Sales Footprint

            18.1.6.5. Strategy Overview

                18.1.6.5.1. Marketing Strategy

        18.1.7. Mindtree

            18.1.7.1. Overview

            18.1.7.2. Product Portfolio

            18.1.7.3. Profitability by Market Segments

            18.1.7.4. Sales Footprint

            18.1.7.5. Strategy Overview

                18.1.7.5.1. Marketing Strategy

        18.1.8. Qstream Inc.

            18.1.8.1. Overview

            18.1.8.2. Product Portfolio

            18.1.8.3. Profitability by Market Segments

            18.1.8.4. Sales Footprint

            18.1.8.5. Strategy Overview

                18.1.8.5.1. Marketing Strategy

        18.1.9. Saba Software

            18.1.9.1. Overview

            18.1.9.2. Product Portfolio

            18.1.9.3. Profitability by Market Segments

            18.1.9.4. Sales Footprint

            18.1.9.5. Strategy Overview

                18.1.9.5.1. Marketing Strategy

        18.1.10. SwissVBS

            18.1.10.1. Overview

            18.1.10.2. Product Portfolio

            18.1.10.3. Profitability by Market Segments

            18.1.10.4. Sales Footprint

            18.1.10.5. Strategy Overview

                18.1.10.5.1. Marketing Strategy

19. Assumptions & Acronyms Used

20. Research Methodology

List of Tables

Table 01: Global Market Value (US$ Million) Forecast by Region, 2018 to 2033

Table 02: Global Market Value (US$ Million) Forecast by Deployment Mode, 2018 to 2033

Table 03: Global Market Value (US$ Million) Forecast by Components, 2018 to 2033

Table 04: Global Market Value (US$ Million) Forecast by Industry , 2018 to 2033

Table 05: North America Market Value (US$ Million) Forecast by Country, 2018 to 2033

Table 06: North America Market Value (US$ Million) Forecast by Deployment Mode, 2018 to 2033

Table 07: North America Market Value (US$ Million) Forecast by Components, 2018 to 2033

Table 08: North America Market Value (US$ Million) Forecast by Industry , 2018 to 2033

Table 09: Latin America Market Value (US$ Million) Forecast by Country, 2018 to 2033

Table 10: Latin America Market Value (US$ Million) Forecast by Deployment Mode, 2018 to 2033

Table 11: Latin America Market Value (US$ Million) Forecast by Components, 2018 to 2033

Table 12: Latin America Market Value (US$ Million) Forecast by Industry , 2018 to 2033

Table 13: Western Europe Market Value (US$ Million) Forecast by Country, 2018 to 2033

Table 14: Western Europe Market Value (US$ Million) Forecast by Deployment Mode, 2018 to 2033

Table 15: Western Europe Market Value (US$ Million) Forecast by Components, 2018 to 2033

Table 16: Western Europe Market Value (US$ Million) Forecast by Industry , 2018 to 2033

Table 17: Eastern Europe Market Value (US$ Million) Forecast by Country, 2018 to 2033

Table 18: Eastern Europe Market Value (US$ Million) Forecast by Deployment Mode, 2018 to 2033

Table 19: Eastern Europe Market Value (US$ Million) Forecast by Components, 2018 to 2033

Table 20: Eastern Europe Market Value (US$ Million) Forecast by Industry , 2018 to 2033

Table 21: South Asia and Pacific Market Value (US$ Million) Forecast by Country, 2018 to 2033

Table 22: South Asia and Pacific Market Value (US$ Million) Forecast by Deployment Mode, 2018 to 2033

Table 23: South Asia and Pacific Market Value (US$ Million) Forecast by Components, 2018 to 2033

Table 24: South Asia and Pacific Market Value (US$ Million) Forecast by Industry , 2018 to 2033

Table 25: East Asia Market Value (US$ Million) Forecast by Country, 2018 to 2033

Table 26: East Asia Market Value (US$ Million) Forecast by Deployment Mode, 2018 to 2033

Table 27: East Asia Market Value (US$ Million) Forecast by Components, 2018 to 2033

Table 28: East Asia Market Value (US$ Million) Forecast by Industry , 2018 to 2033

Table 29: Middle East and Africa Market Value (US$ Million) Forecast by Country, 2018 to 2033

Table 30: Middle East and Africa Market Value (US$ Million) Forecast by Deployment Mode, 2018 to 2033

Table 31: Middle East and Africa Market Value (US$ Million) Forecast by Components, 2018 to 2033

Table 32: Middle East and Africa Market Value (US$ Million) Forecast by Industry , 2018 to 2033

List of Charts

Figure 01: Global Market Value (US$ Million) by Deployment Mode, 2023 to 2033

Figure 02: Global Market Value (US$ Million) by Components, 2023 to 2033

Figure 03: Global Market Value (US$ Million) by Industry , 2023 to 2033

Figure 04: Global Market Value (US$ Million) by Region, 2023 to 2033

Figure 05: Global Market Value (US$ Million) Analysis by Region, 2018 to 2033

Figure 06: Global Market Value Share (%) and BPS Analysis by Region, 2023 to 2033

Figure 07: Global Market Y-o-Y Growth (%) Projections by Region, 2023 to 2033

Figure 08: Global Market Value (US$ Million) Analysis by Deployment Mode, 2018 to 2033

Figure 09: Global Market Value Share (%) and BPS Analysis by Deployment Mode, 2023 to 2033

Figure 10: Global Market Y-o-Y Growth (%) Projections by Deployment Mode, 2023 to 2033

Figure 11: Global Market Value (US$ Million) Analysis by Components, 2018 to 2033

Figure 12: Global Market Value Share (%) and BPS Analysis by Components, 2023 to 2033

Figure 13: Global Market Y-o-Y Growth (%) Projections by Components, 2023 to 2033

Figure 14: Global Market Value (US$ Million) Analysis by Industry , 2018 to 2033

Figure 15: Global Market Value Share (%) and BPS Analysis by Industry , 2023 to 2033

Figure 16: Global Market Y-o-Y Growth (%) Projections by Industry , 2023 to 2033

Figure 17: Global Market Attractiveness by Deployment Mode, 2023 to 2033

Figure 18: Global Market Attractiveness by Components, 2023 to 2033

Figure 19: Global Market Attractiveness by Industry , 2023 to 2033

Figure 20: Global Market Attractiveness by Region, 2023 to 2033

Figure 21: North America Market Value (US$ Million) by Deployment Mode, 2023 to 2033

Figure 22: North America Market Value (US$ Million) by Components, 2023 to 2033

Figure 23: North America Market Value (US$ Million) by Industry , 2023 to 2033

Figure 24: North America Market Value (US$ Million) by Country, 2023 to 2033

Figure 25: North America Market Value (US$ Million) Analysis by Country, 2018 to 2033

Figure 26: North America Market Value Share (%) and BPS Analysis by Country, 2023 to 2033

Figure 27: North America Market Y-o-Y Growth (%) Projections by Country, 2023 to 2033

Figure 28: North America Market Value (US$ Million) Analysis by Deployment Mode, 2018 to 2033

Figure 29: North America Market Value Share (%) and BPS Analysis by Deployment Mode, 2023 to 2033

Figure 30: North America Market Y-o-Y Growth (%) Projections by Deployment Mode, 2023 to 2033

Figure 31: North America Market Value (US$ Million) Analysis by Components, 2018 to 2033

Figure 32: North America Market Value Share (%) and BPS Analysis by Components, 2023 to 2033

Figure 33: North America Market Y-o-Y Growth (%) Projections by Components, 2023 to 2033

Figure 34: North America Market Value (US$ Million) Analysis by Industry , 2018 to 2033

Figure 35: North America Market Value Share (%) and BPS Analysis by Industry , 2023 to 2033

Figure 36: North America Market Y-o-Y Growth (%) Projections by Industry , 2023 to 2033

Figure 37: North America Market Attractiveness by Deployment Mode, 2023 to 2033

Figure 38: North America Market Attractiveness by Components, 2023 to 2033

Figure 39: North America Market Attractiveness by Industry , 2023 to 2033

Figure 40: North America Market Attractiveness by Country, 2023 to 2033

Figure 41: Latin America Market Value (US$ Million) by Deployment Mode, 2023 to 2033

Figure 42: Latin America Market Value (US$ Million) by Components, 2023 to 2033

Figure 43: Latin America Market Value (US$ Million) by Industry , 2023 to 2033

Figure 44: Latin America Market Value (US$ Million) by Country, 2023 to 2033

Figure 45: Latin America Market Value (US$ Million) Analysis by Country, 2018 to 2033

Figure 46: Latin America Market Value Share (%) and BPS Analysis by Country, 2023 to 2033

Figure 47: Latin America Market Y-o-Y Growth (%) Projections by Country, 2023 to 2033

Figure 48: Latin America Market Value (US$ Million) Analysis by Deployment Mode, 2018 to 2033

Figure 49: Latin America Market Value Share (%) and BPS Analysis by Deployment Mode, 2023 to 2033

Figure 50: Latin America Market Y-o-Y Growth (%) Projections by Deployment Mode, 2023 to 2033

Figure 51: Latin America Market Value (US$ Million) Analysis by Components, 2018 to 2033

Figure 52: Latin America Market Value Share (%) and BPS Analysis by Components, 2023 to 2033

Figure 53: Latin America Market Y-o-Y Growth (%) Projections by Components, 2023 to 2033

Figure 54: Latin America Market Value (US$ Million) Analysis by Industry , 2018 to 2033

Figure 55: Latin America Market Value Share (%) and BPS Analysis by Industry , 2023 to 2033

Figure 56: Latin America Market Y-o-Y Growth (%) Projections by Industry , 2023 to 2033

Figure 57: Latin America Market Attractiveness by Deployment Mode, 2023 to 2033

Figure 58: Latin America Market Attractiveness by Components, 2023 to 2033

Figure 59: Latin America Market Attractiveness by Industry , 2023 to 2033

Figure 60: Latin America Market Attractiveness by Country, 2023 to 2033

Figure 61: Western Europe Market Value (US$ Million) by Deployment Mode, 2023 to 2033

Figure 62: Western Europe Market Value (US$ Million) by Components, 2023 to 2033

Figure 63: Western Europe Market Value (US$ Million) by Industry , 2023 to 2033

Figure 64: Western Europe Market Value (US$ Million) by Country, 2023 to 2033

Figure 65: Western Europe Market Value (US$ Million) Analysis by Country, 2018 to 2033

Figure 66: Western Europe Market Value Share (%) and BPS Analysis by Country, 2023 to 2033

Figure 67: Western Europe Market Y-o-Y Growth (%) Projections by Country, 2023 to 2033

Figure 68: Western Europe Market Value (US$ Million) Analysis by Deployment Mode, 2018 to 2033

Figure 69: Western Europe Market Value Share (%) and BPS Analysis by Deployment Mode, 2023 to 2033

Figure 70: Western Europe Market Y-o-Y Growth (%) Projections by Deployment Mode, 2023 to 2033

Figure 71: Western Europe Market Value (US$ Million) Analysis by Components, 2018 to 2033

Figure 72: Western Europe Market Value Share (%) and BPS Analysis by Components, 2023 to 2033

Figure 73: Western Europe Market Y-o-Y Growth (%) Projections by Components, 2023 to 2033

Figure 74: Western Europe Market Value (US$ Million) Analysis by Industry , 2018 to 2033

Figure 75: Western Europe Market Value Share (%) and BPS Analysis by Industry , 2023 to 2033

Figure 76: Western Europe Market Y-o-Y Growth (%) Projections by Industry , 2023 to 2033

Figure 77: Western Europe Market Attractiveness by Deployment Mode, 2023 to 2033

Figure 78: Western Europe Market Attractiveness by Components, 2023 to 2033

Figure 79: Western Europe Market Attractiveness by Industry , 2023 to 2033

Figure 80: Western Europe Market Attractiveness by Country, 2023 to 2033

Figure 81: Eastern Europe Market Value (US$ Million) by Deployment Mode, 2023 to 2033

Figure 82: Eastern Europe Market Value (US$ Million) by Components, 2023 to 2033

Figure 83: Eastern Europe Market Value (US$ Million) by Industry , 2023 to 2033

Figure 84: Eastern Europe Market Value (US$ Million) by Country, 2023 to 2033

Figure 85: Eastern Europe Market Value (US$ Million) Analysis by Country, 2018 to 2033

Figure 86: Eastern Europe Market Value Share (%) and BPS Analysis by Country, 2023 to 2033

Figure 87: Eastern Europe Market Y-o-Y Growth (%) Projections by Country, 2023 to 2033

Figure 88: Eastern Europe Market Value (US$ Million) Analysis by Deployment Mode, 2018 to 2033

Figure 89: Eastern Europe Market Value Share (%) and BPS Analysis by Deployment Mode, 2023 to 2033

Figure 90: Eastern Europe Market Y-o-Y Growth (%) Projections by Deployment Mode, 2023 to 2033

Figure 91: Eastern Europe Market Value (US$ Million) Analysis by Components, 2018 to 2033

Figure 92: Eastern Europe Market Value Share (%) and BPS Analysis by Components, 2023 to 2033

Figure 93: Eastern Europe Market Y-o-Y Growth (%) Projections by Components, 2023 to 2033

Figure 94: Eastern Europe Market Value (US$ Million) Analysis by Industry , 2018 to 2033

Figure 95: Eastern Europe Market Value Share (%) and BPS Analysis by Industry , 2023 to 2033

Figure 96: Eastern Europe Market Y-o-Y Growth (%) Projections by Industry , 2023 to 2033

Figure 97: Eastern Europe Market Attractiveness by Deployment Mode, 2023 to 2033

Figure 98: Eastern Europe Market Attractiveness by Components, 2023 to 2033

Figure 99: Eastern Europe Market Attractiveness by Industry , 2023 to 2033

Figure 100: Eastern Europe Market Attractiveness by Country, 2023 to 2033

Figure 101: South Asia and Pacific Market Value (US$ Million) by Deployment Mode, 2023 to 2033

Figure 102: South Asia and Pacific Market Value (US$ Million) by Components, 2023 to 2033

Figure 103: South Asia and Pacific Market Value (US$ Million) by Industry , 2023 to 2033

Figure 104: South Asia and Pacific Market Value (US$ Million) by Country, 2023 to 2033

Figure 105: South Asia and Pacific Market Value (US$ Million) Analysis by Country, 2018 to 2033

Figure 106: South Asia and Pacific Market Value Share (%) and BPS Analysis by Country, 2023 to 2033

Figure 107: South Asia and Pacific Market Y-o-Y Growth (%) Projections by Country, 2023 to 2033

Figure 108: South Asia and Pacific Market Value (US$ Million) Analysis by Deployment Mode, 2018 to 2033

Figure 109: South Asia and Pacific Market Value Share (%) and BPS Analysis by Deployment Mode, 2023 to 2033

Figure 110: South Asia and Pacific Market Y-o-Y Growth (%) Projections by Deployment Mode, 2023 to 2033

Figure 111: South Asia and Pacific Market Value (US$ Million) Analysis by Components, 2018 to 2033

Figure 112: South Asia and Pacific Market Value Share (%) and BPS Analysis by Components, 2023 to 2033

Figure 113: South Asia and Pacific Market Y-o-Y Growth (%) Projections by Components, 2023 to 2033

Figure 114: South Asia and Pacific Market Value (US$ Million) Analysis by Industry , 2018 to 2033

Figure 115: South Asia and Pacific Market Value Share (%) and BPS Analysis by Industry , 2023 to 2033

Figure 116: South Asia and Pacific Market Y-o-Y Growth (%) Projections by Industry , 2023 to 2033

Figure 117: South Asia and Pacific Market Attractiveness by Deployment Mode, 2023 to 2033

Figure 118: South Asia and Pacific Market Attractiveness by Components, 2023 to 2033

Figure 119: South Asia and Pacific Market Attractiveness by Industry , 2023 to 2033

Figure 120: South Asia and Pacific Market Attractiveness by Country, 2023 to 2033

Figure 121: East Asia Market Value (US$ Million) by Deployment Mode, 2023 to 2033

Figure 122: East Asia Market Value (US$ Million) by Components, 2023 to 2033

Figure 123: East Asia Market Value (US$ Million) by Industry , 2023 to 2033

Figure 124: East Asia Market Value (US$ Million) by Country, 2023 to 2033

Figure 125: East Asia Market Value (US$ Million) Analysis by Country, 2018 to 2033

Figure 126: East Asia Market Value Share (%) and BPS Analysis by Country, 2023 to 2033

Figure 127: East Asia Market Y-o-Y Growth (%) Projections by Country, 2023 to 2033

Figure 128: East Asia Market Value (US$ Million) Analysis by Deployment Mode, 2018 to 2033

Figure 129: East Asia Market Value Share (%) and BPS Analysis by Deployment Mode, 2023 to 2033

Figure 130: East Asia Market Y-o-Y Growth (%) Projections by Deployment Mode, 2023 to 2033

Figure 131: East Asia Market Value (US$ Million) Analysis by Components, 2018 to 2033

Figure 132: East Asia Market Value Share (%) and BPS Analysis by Components, 2023 to 2033

Figure 133: East Asia Market Y-o-Y Growth (%) Projections by Components, 2023 to 2033

Figure 134: East Asia Market Value (US$ Million) Analysis by Industry , 2018 to 2033

Figure 135: East Asia Market Value Share (%) and BPS Analysis by Industry , 2023 to 2033

Figure 136: East Asia Market Y-o-Y Growth (%) Projections by Industry , 2023 to 2033

Figure 137: East Asia Market Attractiveness by Deployment Mode, 2023 to 2033

Figure 138: East Asia Market Attractiveness by Components, 2023 to 2033

Figure 139: East Asia Market Attractiveness by Industry , 2023 to 2033

Figure 140: East Asia Market Attractiveness by Country, 2023 to 2033

Figure 141: Middle East and Africa Market Value (US$ Million) by Deployment Mode, 2023 to 2033

Figure 142: Middle East and Africa Market Value (US$ Million) by Components, 2023 to 2033

Figure 143: Middle East and Africa Market Value (US$ Million) by Industry , 2023 to 2033

Figure 144: Middle East and Africa Market Value (US$ Million) by Country, 2023 to 2033

Figure 145: Middle East and Africa Market Value (US$ Million) Analysis by Country, 2018 to 2033

Figure 146: Middle East and Africa Market Value Share (%) and BPS Analysis by Country, 2023 to 2033

Figure 147: Middle East and Africa Market Y-o-Y Growth (%) Projections by Country, 2023 to 2033

Figure 148: Middle East and Africa Market Value (US$ Million) Analysis by Deployment Mode, 2018 to 2033

Figure 149: Middle East and Africa Market Value Share (%) and BPS Analysis by Deployment Mode, 2023 to 2033

Figure 150: Middle East and Africa Market Y-o-Y Growth (%) Projections by Deployment Mode, 2023 to 2033

Figure 151: Middle East and Africa Market Value (US$ Million) Analysis by Components, 2018 to 2033

Figure 152: Middle East and Africa Market Value Share (%) and BPS Analysis by Components, 2023 to 2033

Figure 153: Middle East and Africa Market Y-o-Y Growth (%) Projections by Components, 2023 to 2033

Figure 154: Middle East and Africa Market Value (US$ Million) Analysis by Industry , 2018 to 2033

Figure 155: Middle East and Africa Market Value Share (%) and BPS Analysis by Industry , 2023 to 2033

Figure 156: Middle East and Africa Market Y-o-Y Growth (%) Projections by Industry , 2023 to 2033

Figure 157: Middle East and Africa Market Attractiveness by Deployment Mode, 2023 to 2033

Figure 158: Middle East and Africa Market Attractiveness by Components, 2023 to 2033

Figure 159: Middle East and Africa Market Attractiveness by Industry , 2023 to 2033

Figure 160: Middle East and Africa Market Attractiveness by Country, 2023 to 2033

Recommendations

Technology

Smart Education and Learning Market

Published : February 2023

Technology

E-Learning Solutions Market

Published : January 2023

Explore Technology Insights

View Reports

Microlearning Platforms Market