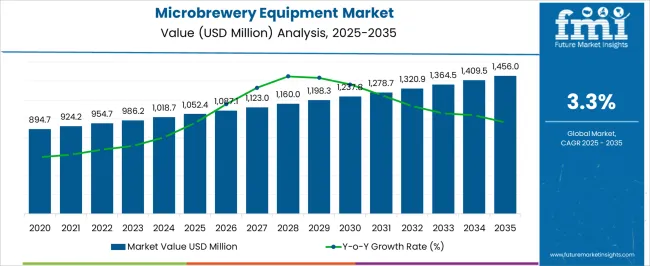
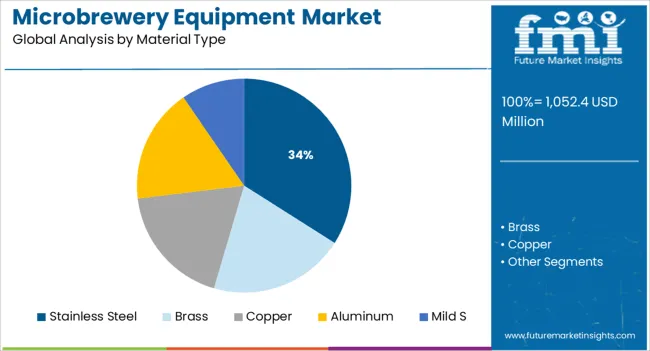
The global Microbrewery Equipment Market is estimated to be valued at USD 986.2 Million in 2023. Furthermore, with the rising consumption of craft beer across the world, the overall demand for microbrewery equipment is poised to surge at 3.3% CAGR between 2023 and 2033, exceeding a market valuation of USD 1,364.5 Million by 2033.
Microbrewery equipment refers to tools or state-of-art equipment used to brew beer on a small scale. This equipment is usually used by home brewers and small breweries to produce high-quality beer.
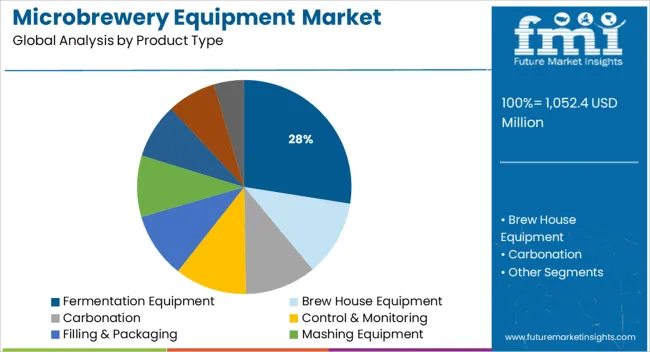
They include milling and mashing equipment, fermentation equipment, filtration system, brew house equipment, control & monitoring tools, filling and packaging solutions, etc.
The market is driven by the rising consumer demand for craft beer, which is prompting breweries to invest in microbrewery equipment. In addition, the growing popularity of home brewing is also driving the market for microbrewery equipment.
Beer is one of the world’s oldest alcoholic beverages and the third most consumed beverage after water and tea, in the world. People are increasingly consuming beer due to its various health benefits.
For instance, it is believed that nutrients and antioxidants present in beer can promote heart health, lower cholesterol, and prevent kidney stones, besides several other benefits. This has resulted in the expansion of breweries and pubs across the world, which in turn will positively influence microbrewery equipment sales.
Beer-making equipment manufacturers are implementing novel strategies to increase sales and market penetration.
Microbrewery equipment market participants carry out a variety of tasks, such as the liquor store's growth, improved yeast management, a greater emphasis on the ingredients in the barrels, energy sources, and external expansion to strengthen their market presence
Another factor that is expected to foster the growth of the microbrewery equipment market is the increased acquisition activity between craft breweries and large multinational breweries. Various manufacturers are now focusing on developing new flavors and tastes for high-quality beverages.
Additionally, growing sales through company websites and e-commerce retailers including Amazon, and Flipkart will expand the global market for microbrewery equipment over the next ten years.
Regionally, Asia Pacific is expected to emerge as the most lucrative microbrewery equipment market owing to the significant growth in the number of microbreweries due to the growing demand for craft beer.
Moreover, countries such as China and India are investing heavily in research and development activities related to beer brewing, which is expected to fuel the growth of the Asia-Pacific market.
Attributes | Key Insights |
---|---|
Microbrewery Equipment Market Value (2023) | USD 986.2 Million |
Projected Market Value (2033) | USD 1,364.5 Million |
Value-based CAGR (2023 to 2033) | 3.3% |
Market Share of USA | 38.3% |
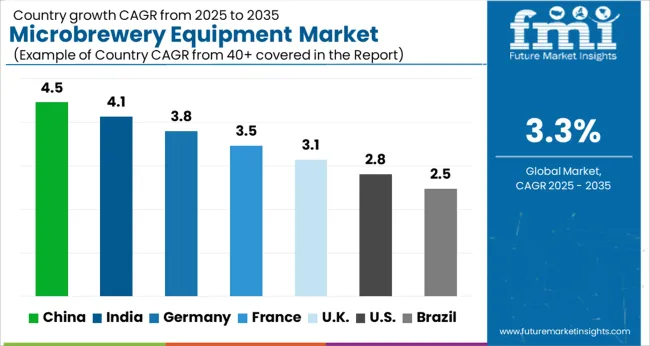
The global microbrewery equipment market is anticipated to grow by 3.3% CAGR between 2023 and 2033, in comparison to the 4.5% CAGR registered during the historical period from 2018 to 2022.
Growing demand for craft beer and the increasing number of microbreweries globally are some of the key factors driving sales of microbrewery equipment in the global market.
Similarly, the rising popularity of craft beer culture, especially across developed and developing nations like the USAIndia, Japan, China, Germany, France, and the UK is expected to bolster sales of microbrewery equipment during the forecast period.
A number of influential factors have been identified that are expected to spur growth in the global microbrewery equipment market during the projection period (2023 to 2033).
Besides the proliferating aspects prevailing in the market, the analysts at FMI have also analyzed the restraining elements, lucrative opportunities, and upcoming threats that can somehow influence microbrewery equipment sales.
The drivers, restraints, opportunities, and threats (DROTs) identified are as follows:
DRIVERS:
RESTRAINTS:
OPPORTUNITIES:
THREATS:
Growing Number of Craft Breweries Pushing Demand in the USA Market
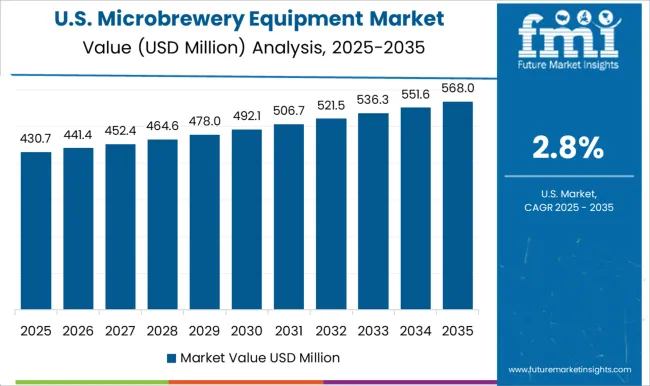
Currently, the USA dominates the global microbrewery equipment market and it is expected to grow at a steady pace during the next ten years (2023 to 2033).
Growth in the USA microbrewery equipment market is driven by the rising popularity of craft beer, the increasing number of microbreweries, and the availability of advanced beer-making equipment.
As the craft beer industry continues to grow in North America, so too does the market for microbrewery equipment. This includes both small-scale brewing systems for home and hobbyists, as well as larger commercial setups for professional brewers.
The demand for such equipment is being driven by both existing breweries expanding their operations and new entrants to the market.
According to the Brewers Association Annual Growth Report (2019), around 8,275 craft breweries were operating in 2019, including 2,058 microbreweries, 2,966 taproom breweries, 3,011 brewpubs, and 240 regional craft breweries.
This number is expected to further surge during the next few decades and will generate high demand for microbrewery equipment in the country.
Increasing Beer Consumption Boosting Microbrewery Equipment Market in China
As per FMI, China’s microbrewing equipment market is anticipated to expand at 5.7% CAGR during the forecast period (2023 to 2033), making it one of the most lucrative markets across East Asia.
Rising consumption of beer due to changing lifestyles, rising disposable income, and growing awareness about the potential benefits of beer are key factors driving the demand for microbrewery equipment across China.
In recent years, beer consumption has gained immense traction across China and the trend is likely to continue during the forecast period. According to the World Population Review, total beer consumption in China reached 9,533,441 gallons in 2020. This is playing a key role in elevating demand for microbrewery equipment.
China presents a huge opportunity for businesses that are looking to expand their operations due to several reasons. Firstly, the nation has a large population which creates a significant demand for goods and services.
Secondly, the country is experiencing strong economic growth, which is boosting household incomes and increasing consumer spending power. Finally, China has a young and dynamic workforce that is eager to embrace new technologies and ideas.
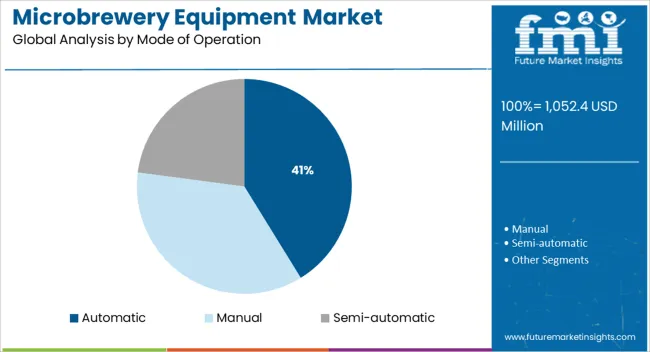
The microbrewing industry is rapidly expanding its use of automated beer-handling equipment to reduce production time and costs for greater efficiency and productivity.
The complex beverage production process necessitates constant monitoring, governance, and evaluation, which is easily accomplished with an automated brewing company setup. Although automatic equipment requires a large initial investment, it pays off quickly in the long run.
Beer-making equipment manufacturers are implementing novel strategies to increase sales and market penetration.
They are adopting a variety of strategies such as new product launches, mergers, collaborations, long-term partnerships, and facility expansions to increase their sales and solidify their positions in the global market. For instance,
Attributes | Details |
---|---|
Estimated Market Size (2023) | USD 986.2 Million |
Projected Market Size (2033) | USD 1,364.5 Million |
Anticipated Growth Rate (2023 to 2033) | 3.3% CAGR |
Forecast Period | 2023 to 2033 |
Historical Data Available for | 2018 to 2022 |
Market Analysis | USD Million for Value and Units for Volume |
Key Regions Covered | North America; Latin America; Europe;Asia Pacific; Oceania; Middle East and Africa (MEA) |
Key Countries Covered | USA,Canada, Mexico,Germany, UK,France, Italy,Spain, China, Japan, India,South Korea, Australia, Brazil, Argentina, South Africa, UAE |
Key Segments Covered | Product Type, Application, Mode of Operation, Region |
Key Companies Profiled | Alfa Laval; Kaspar SCHULZ; Krones AG; Praj industries; LEHUI; INTERPUMP GROUP S.P.A; Criveller Group; Della Toffola Spa |
Report Coverage | Market Forecast, Company Share Analysis, Competitive Landscape, Drivers, Restraints, Opportunities and Threats Analysis, Market Dynamics and Challenges, and Strategic Growth Initiatives |
Table 1: Global Market Value (US$ Million) Forecast by Region, 2018 to 2033
Table 2: Global Market Volume (MT) Forecast by Region, 2018 to 2033
Table 3: Global Market Value (US$ Million) Forecast by Product Type, 2018 to 2033
Table 4: Global Market Volume (MT) Forecast by Product Type, 2018 to 2033
Table 5: Global Market Value (US$ Million) Forecast by Material Type, 2018 to 2033
Table 6: Global Market Volume (MT) Forecast by Material Type, 2018 to 2033
Table 7: Global Market Value (US$ Million) Forecast by Mode of Operation, 2018 to 2033
Table 8: Global Market Volume (MT) Forecast by Mode of Operation, 2018 to 2033
Table 9: North America Market Value (US$ Million) Forecast by Country, 2018 to 2033
Table 10: North America Market Volume (MT) Forecast by Country, 2018 to 2033
Table 11: North America Market Value (US$ Million) Forecast by Product Type, 2018 to 2033
Table 12: North America Market Volume (MT) Forecast by Product Type, 2018 to 2033
Table 13: North America Market Value (US$ Million) Forecast by Material Type, 2018 to 2033
Table 14: North America Market Volume (MT) Forecast by Material Type, 2018 to 2033
Table 15: North America Market Value (US$ Million) Forecast by Mode of Operation, 2018 to 2033
Table 16: North America Market Volume (MT) Forecast by Mode of Operation, 2018 to 2033
Table 17: Latin America Market Value (US$ Million) Forecast by Country, 2018 to 2033
Table 18: Latin America Market Volume (MT) Forecast by Country, 2018 to 2033
Table 19: Latin America Market Value (US$ Million) Forecast by Product Type, 2018 to 2033
Table 20: Latin America Market Volume (MT) Forecast by Product Type, 2018 to 2033
Table 21: Latin America Market Value (US$ Million) Forecast by Material Type, 2018 to 2033
Table 22: Latin America Market Volume (MT) Forecast by Material Type, 2018 to 2033
Table 23: Latin America Market Value (US$ Million) Forecast by Mode of Operation, 2018 to 2033
Table 24: Latin America Market Volume (MT) Forecast by Mode of Operation, 2018 to 2033
Table 25: Europe Market Value (US$ Million) Forecast by Country, 2018 to 2033
Table 26: Europe Market Volume (MT) Forecast by Country, 2018 to 2033
Table 27: Europe Market Value (US$ Million) Forecast by Product Type, 2018 to 2033
Table 28: Europe Market Volume (MT) Forecast by Product Type, 2018 to 2033
Table 29: Europe Market Value (US$ Million) Forecast by Material Type, 2018 to 2033
Table 30: Europe Market Volume (MT) Forecast by Material Type, 2018 to 2033
Table 31: Europe Market Value (US$ Million) Forecast by Mode of Operation, 2018 to 2033
Table 32: Europe Market Volume (MT) Forecast by Mode of Operation, 2018 to 2033
Table 33: East Asia Market Value (US$ Million) Forecast by Country, 2018 to 2033
Table 34: East Asia Market Volume (MT) Forecast by Country, 2018 to 2033
Table 35: East Asia Market Value (US$ Million) Forecast by Product Type, 2018 to 2033
Table 36: East Asia Market Volume (MT) Forecast by Product Type, 2018 to 2033
Table 37: East Asia Market Value (US$ Million) Forecast by Material Type, 2018 to 2033
Table 38: East Asia Market Volume (MT) Forecast by Material Type, 2018 to 2033
Table 39: East Asia Market Value (US$ Million) Forecast by Mode of Operation, 2018 to 2033
Table 40: East Asia Market Volume (MT) Forecast by Mode of Operation, 2018 to 2033
Table 41: South Asia Market Value (US$ Million) Forecast by Country, 2018 to 2033
Table 42: South Asia Market Volume (MT) Forecast by Country, 2018 to 2033
Table 43: South Asia Market Value (US$ Million) Forecast by Product Type, 2018 to 2033
Table 44: South Asia Market Volume (MT) Forecast by Product Type, 2018 to 2033
Table 45: South Asia Market Value (US$ Million) Forecast by Material Type, 2018 to 2033
Table 46: South Asia Market Volume (MT) Forecast by Material Type, 2018 to 2033
Table 47: South Asia Market Value (US$ Million) Forecast by Mode of Operation, 2018 to 2033
Table 48: South Asia Market Volume (MT) Forecast by Mode of Operation, 2018 to 2033
Table 49: Oceania Market Value (US$ Million) Forecast by Country, 2018 to 2033
Table 50: Oceania Market Volume (MT) Forecast by Country, 2018 to 2033
Table 51: Oceania Market Value (US$ Million) Forecast by Product Type, 2018 to 2033
Table 52: Oceania Market Volume (MT) Forecast by Product Type, 2018 to 2033
Table 53: Oceania Market Value (US$ Million) Forecast by Material Type, 2018 to 2033
Table 54: Oceania Market Volume (MT) Forecast by Material Type, 2018 to 2033
Table 55: Oceania Market Value (US$ Million) Forecast by Mode of Operation, 2018 to 2033
Table 56: Oceania Market Volume (MT) Forecast by Mode of Operation, 2018 to 2033
Table 57: MEA Market Value (US$ Million) Forecast by Country, 2018 to 2033
Table 58: MEA Market Volume (MT) Forecast by Country, 2018 to 2033
Table 59: MEA Market Value (US$ Million) Forecast by Product Type, 2018 to 2033
Table 60: MEA Market Volume (MT) Forecast by Product Type, 2018 to 2033
Table 61: MEA Market Value (US$ Million) Forecast by Material Type, 2018 to 2033
Table 62: MEA Market Volume (MT) Forecast by Material Type, 2018 to 2033
Table 63: MEA Market Value (US$ Million) Forecast by Mode of Operation, 2018 to 2033
Table 64: MEA Market Volume (MT) Forecast by Mode of Operation, 2018 to 2033
Figure 1: Global Market Value (US$ Million) by Product Type, 2023 to 2033
Figure 2: Global Market Value (US$ Million) by Material Type, 2023 to 2033
Figure 3: Global Market Value (US$ Million) by Mode of Operation, 2023 to 2033
Figure 4: Global Market Value (US$ Million) by Region, 2023 to 2033
Figure 5: Global Market Value (US$ Million) Analysis by Region, 2018 to 2033
Figure 6: Global Market Volume (MT) Analysis by Region, 2018 to 2033
Figure 7: Global Market Value Share (%) and BPS Analysis by Region, 2023 to 2033
Figure 8: Global Market Y-o-Y Growth (%) Projections by Region, 2023 to 2033
Figure 9: Global Market Value (US$ Million) Analysis by Product Type, 2018 to 2033
Figure 10: Global Market Volume (MT) Analysis by Product Type, 2018 to 2033
Figure 11: Global Market Value Share (%) and BPS Analysis by Product Type, 2023 to 2033
Figure 12: Global Market Y-o-Y Growth (%) Projections by Product Type, 2023 to 2033
Figure 13: Global Market Value (US$ Million) Analysis by Material Type, 2018 to 2033
Figure 14: Global Market Volume (MT) Analysis by Material Type, 2018 to 2033
Figure 15: Global Market Value Share (%) and BPS Analysis by Material Type, 2023 to 2033
Figure 16: Global Market Y-o-Y Growth (%) Projections by Material Type, 2023 to 2033
Figure 17: Global Market Value (US$ Million) Analysis by Mode of Operation, 2018 to 2033
Figure 18: Global Market Volume (MT) Analysis by Mode of Operation, 2018 to 2033
Figure 19: Global Market Value Share (%) and BPS Analysis by Mode of Operation, 2023 to 2033
Figure 20: Global Market Y-o-Y Growth (%) Projections by Mode of Operation, 2023 to 2033
Figure 21: Global Market Attractiveness by Product Type, 2023 to 2033
Figure 22: Global Market Attractiveness by Material Type, 2023 to 2033
Figure 23: Global Market Attractiveness by Mode of Operation, 2023 to 2033
Figure 24: Global Market Attractiveness by Region, 2023 to 2033
Figure 25: North America Market Value (US$ Million) by Product Type, 2023 to 2033
Figure 26: North America Market Value (US$ Million) by Material Type, 2023 to 2033
Figure 27: North America Market Value (US$ Million) by Mode of Operation, 2023 to 2033
Figure 28: North America Market Value (US$ Million) by Country, 2023 to 2033
Figure 29: North America Market Value (US$ Million) Analysis by Country, 2018 to 2033
Figure 30: North America Market Volume (MT) Analysis by Country, 2018 to 2033
Figure 31: North America Market Value Share (%) and BPS Analysis by Country, 2023 to 2033
Figure 32: North America Market Y-o-Y Growth (%) Projections by Country, 2023 to 2033
Figure 33: North America Market Value (US$ Million) Analysis by Product Type, 2018 to 2033
Figure 34: North America Market Volume (MT) Analysis by Product Type, 2018 to 2033
Figure 35: North America Market Value Share (%) and BPS Analysis by Product Type, 2023 to 2033
Figure 36: North America Market Y-o-Y Growth (%) Projections by Product Type, 2023 to 2033
Figure 37: North America Market Value (US$ Million) Analysis by Material Type, 2018 to 2033
Figure 38: North America Market Volume (MT) Analysis by Material Type, 2018 to 2033
Figure 39: North America Market Value Share (%) and BPS Analysis by Material Type, 2023 to 2033
Figure 40: North America Market Y-o-Y Growth (%) Projections by Material Type, 2023 to 2033
Figure 41: North America Market Value (US$ Million) Analysis by Mode of Operation, 2018 to 2033
Figure 42: North America Market Volume (MT) Analysis by Mode of Operation, 2018 to 2033
Figure 43: North America Market Value Share (%) and BPS Analysis by Mode of Operation, 2023 to 2033
Figure 44: North America Market Y-o-Y Growth (%) Projections by Mode of Operation, 2023 to 2033
Figure 45: North America Market Attractiveness by Product Type, 2023 to 2033
Figure 46: North America Market Attractiveness by Material Type, 2023 to 2033
Figure 47: North America Market Attractiveness by Mode of Operation, 2023 to 2033
Figure 48: North America Market Attractiveness by Country, 2023 to 2033
Figure 49: Latin America Market Value (US$ Million) by Product Type, 2023 to 2033
Figure 50: Latin America Market Value (US$ Million) by Material Type, 2023 to 2033
Figure 51: Latin America Market Value (US$ Million) by Mode of Operation, 2023 to 2033
Figure 52: Latin America Market Value (US$ Million) by Country, 2023 to 2033
Figure 53: Latin America Market Value (US$ Million) Analysis by Country, 2018 to 2033
Figure 54: Latin America Market Volume (MT) Analysis by Country, 2018 to 2033
Figure 55: Latin America Market Value Share (%) and BPS Analysis by Country, 2023 to 2033
Figure 56: Latin America Market Y-o-Y Growth (%) Projections by Country, 2023 to 2033
Figure 57: Latin America Market Value (US$ Million) Analysis by Product Type, 2018 to 2033
Figure 58: Latin America Market Volume (MT) Analysis by Product Type, 2018 to 2033
Figure 59: Latin America Market Value Share (%) and BPS Analysis by Product Type, 2023 to 2033
Figure 60: Latin America Market Y-o-Y Growth (%) Projections by Product Type, 2023 to 2033
Figure 61: Latin America Market Value (US$ Million) Analysis by Material Type, 2018 to 2033
Figure 62: Latin America Market Volume (MT) Analysis by Material Type, 2018 to 2033
Figure 63: Latin America Market Value Share (%) and BPS Analysis by Material Type, 2023 to 2033
Figure 64: Latin America Market Y-o-Y Growth (%) Projections by Material Type, 2023 to 2033
Figure 65: Latin America Market Value (US$ Million) Analysis by Mode of Operation, 2018 to 2033
Figure 66: Latin America Market Volume (MT) Analysis by Mode of Operation, 2018 to 2033
Figure 67: Latin America Market Value Share (%) and BPS Analysis by Mode of Operation, 2023 to 2033
Figure 68: Latin America Market Y-o-Y Growth (%) Projections by Mode of Operation, 2023 to 2033
Figure 69: Latin America Market Attractiveness by Product Type, 2023 to 2033
Figure 70: Latin America Market Attractiveness by Material Type, 2023 to 2033
Figure 71: Latin America Market Attractiveness by Mode of Operation, 2023 to 2033
Figure 72: Latin America Market Attractiveness by Country, 2023 to 2033
Figure 73: Europe Market Value (US$ Million) by Product Type, 2023 to 2033
Figure 74: Europe Market Value (US$ Million) by Material Type, 2023 to 2033
Figure 75: Europe Market Value (US$ Million) by Mode of Operation, 2023 to 2033
Figure 76: Europe Market Value (US$ Million) by Country, 2023 to 2033
Figure 77: Europe Market Value (US$ Million) Analysis by Country, 2018 to 2033
Figure 78: Europe Market Volume (MT) Analysis by Country, 2018 to 2033
Figure 79: Europe Market Value Share (%) and BPS Analysis by Country, 2023 to 2033
Figure 80: Europe Market Y-o-Y Growth (%) Projections by Country, 2023 to 2033
Figure 81: Europe Market Value (US$ Million) Analysis by Product Type, 2018 to 2033
Figure 82: Europe Market Volume (MT) Analysis by Product Type, 2018 to 2033
Figure 83: Europe Market Value Share (%) and BPS Analysis by Product Type, 2023 to 2033
Figure 84: Europe Market Y-o-Y Growth (%) Projections by Product Type, 2023 to 2033
Figure 85: Europe Market Value (US$ Million) Analysis by Material Type, 2018 to 2033
Figure 86: Europe Market Volume (MT) Analysis by Material Type, 2018 to 2033
Figure 87: Europe Market Value Share (%) and BPS Analysis by Material Type, 2023 to 2033
Figure 88: Europe Market Y-o-Y Growth (%) Projections by Material Type, 2023 to 2033
Figure 89: Europe Market Value (US$ Million) Analysis by Mode of Operation, 2018 to 2033
Figure 90: Europe Market Volume (MT) Analysis by Mode of Operation, 2018 to 2033
Figure 91: Europe Market Value Share (%) and BPS Analysis by Mode of Operation, 2023 to 2033
Figure 92: Europe Market Y-o-Y Growth (%) Projections by Mode of Operation, 2023 to 2033
Figure 93: Europe Market Attractiveness by Product Type, 2023 to 2033
Figure 94: Europe Market Attractiveness by Material Type, 2023 to 2033
Figure 95: Europe Market Attractiveness by Mode of Operation, 2023 to 2033
Figure 96: Europe Market Attractiveness by Country, 2023 to 2033
Figure 97: East Asia Market Value (US$ Million) by Product Type, 2023 to 2033
Figure 98: East Asia Market Value (US$ Million) by Material Type, 2023 to 2033
Figure 99: East Asia Market Value (US$ Million) by Mode of Operation, 2023 to 2033
Figure 100: East Asia Market Value (US$ Million) by Country, 2023 to 2033
Figure 101: East Asia Market Value (US$ Million) Analysis by Country, 2018 to 2033
Figure 102: East Asia Market Volume (MT) Analysis by Country, 2018 to 2033
Figure 103: East Asia Market Value Share (%) and BPS Analysis by Country, 2023 to 2033
Figure 104: East Asia Market Y-o-Y Growth (%) Projections by Country, 2023 to 2033
Figure 105: East Asia Market Value (US$ Million) Analysis by Product Type, 2018 to 2033
Figure 106: East Asia Market Volume (MT) Analysis by Product Type, 2018 to 2033
Figure 107: East Asia Market Value Share (%) and BPS Analysis by Product Type, 2023 to 2033
Figure 108: East Asia Market Y-o-Y Growth (%) Projections by Product Type, 2023 to 2033
Figure 109: East Asia Market Value (US$ Million) Analysis by Material Type, 2018 to 2033
Figure 110: East Asia Market Volume (MT) Analysis by Material Type, 2018 to 2033
Figure 111: East Asia Market Value Share (%) and BPS Analysis by Material Type, 2023 to 2033
Figure 112: East Asia Market Y-o-Y Growth (%) Projections by Material Type, 2023 to 2033
Figure 113: East Asia Market Value (US$ Million) Analysis by Mode of Operation, 2018 to 2033
Figure 114: East Asia Market Volume (MT) Analysis by Mode of Operation, 2018 to 2033
Figure 115: East Asia Market Value Share (%) and BPS Analysis by Mode of Operation, 2023 to 2033
Figure 116: East Asia Market Y-o-Y Growth (%) Projections by Mode of Operation, 2023 to 2033
Figure 117: East Asia Market Attractiveness by Product Type, 2023 to 2033
Figure 118: East Asia Market Attractiveness by Material Type, 2023 to 2033
Figure 119: East Asia Market Attractiveness by Mode of Operation, 2023 to 2033
Figure 120: East Asia Market Attractiveness by Country, 2023 to 2033
Figure 121: South Asia Market Value (US$ Million) by Product Type, 2023 to 2033
Figure 122: South Asia Market Value (US$ Million) by Material Type, 2023 to 2033
Figure 123: South Asia Market Value (US$ Million) by Mode of Operation, 2023 to 2033
Figure 124: South Asia Market Value (US$ Million) by Country, 2023 to 2033
Figure 125: South Asia Market Value (US$ Million) Analysis by Country, 2018 to 2033
Figure 126: South Asia Market Volume (MT) Analysis by Country, 2018 to 2033
Figure 127: South Asia Market Value Share (%) and BPS Analysis by Country, 2023 to 2033
Figure 128: South Asia Market Y-o-Y Growth (%) Projections by Country, 2023 to 2033
Figure 129: South Asia Market Value (US$ Million) Analysis by Product Type, 2018 to 2033
Figure 130: South Asia Market Volume (MT) Analysis by Product Type, 2018 to 2033
Figure 131: South Asia Market Value Share (%) and BPS Analysis by Product Type, 2023 to 2033
Figure 132: South Asia Market Y-o-Y Growth (%) Projections by Product Type, 2023 to 2033
Figure 133: South Asia Market Value (US$ Million) Analysis by Material Type, 2018 to 2033
Figure 134: South Asia Market Volume (MT) Analysis by Material Type, 2018 to 2033
Figure 135: South Asia Market Value Share (%) and BPS Analysis by Material Type, 2023 to 2033
Figure 136: South Asia Market Y-o-Y Growth (%) Projections by Material Type, 2023 to 2033
Figure 137: South Asia Market Value (US$ Million) Analysis by Mode of Operation, 2018 to 2033
Figure 138: South Asia Market Volume (MT) Analysis by Mode of Operation, 2018 to 2033
Figure 139: South Asia Market Value Share (%) and BPS Analysis by Mode of Operation, 2023 to 2033
Figure 140: South Asia Market Y-o-Y Growth (%) Projections by Mode of Operation, 2023 to 2033
Figure 141: South Asia Market Attractiveness by Product Type, 2023 to 2033
Figure 142: South Asia Market Attractiveness by Material Type, 2023 to 2033
Figure 143: South Asia Market Attractiveness by Mode of Operation, 2023 to 2033
Figure 144: South Asia Market Attractiveness by Country, 2023 to 2033
Figure 145: Oceania Market Value (US$ Million) by Product Type, 2023 to 2033
Figure 146: Oceania Market Value (US$ Million) by Material Type, 2023 to 2033
Figure 147: Oceania Market Value (US$ Million) by Mode of Operation, 2023 to 2033
Figure 148: Oceania Market Value (US$ Million) by Country, 2023 to 2033
Figure 149: Oceania Market Value (US$ Million) Analysis by Country, 2018 to 2033
Figure 150: Oceania Market Volume (MT) Analysis by Country, 2018 to 2033
Figure 151: Oceania Market Value Share (%) and BPS Analysis by Country, 2023 to 2033
Figure 152: Oceania Market Y-o-Y Growth (%) Projections by Country, 2023 to 2033
Figure 153: Oceania Market Value (US$ Million) Analysis by Product Type, 2018 to 2033
Figure 154: Oceania Market Volume (MT) Analysis by Product Type, 2018 to 2033
Figure 155: Oceania Market Value Share (%) and BPS Analysis by Product Type, 2023 to 2033
Figure 156: Oceania Market Y-o-Y Growth (%) Projections by Product Type, 2023 to 2033
Figure 157: Oceania Market Value (US$ Million) Analysis by Material Type, 2018 to 2033
Figure 158: Oceania Market Volume (MT) Analysis by Material Type, 2018 to 2033
Figure 159: Oceania Market Value Share (%) and BPS Analysis by Material Type, 2023 to 2033
Figure 160: Oceania Market Y-o-Y Growth (%) Projections by Material Type, 2023 to 2033
Figure 161: Oceania Market Value (US$ Million) Analysis by Mode of Operation, 2018 to 2033
Figure 162: Oceania Market Volume (MT) Analysis by Mode of Operation, 2018 to 2033
Figure 163: Oceania Market Value Share (%) and BPS Analysis by Mode of Operation, 2023 to 2033
Figure 164: Oceania Market Y-o-Y Growth (%) Projections by Mode of Operation, 2023 to 2033
Figure 165: Oceania Market Attractiveness by Product Type, 2023 to 2033
Figure 166: Oceania Market Attractiveness by Material Type, 2023 to 2033
Figure 167: Oceania Market Attractiveness by Mode of Operation, 2023 to 2033
Figure 168: Oceania Market Attractiveness by Country, 2023 to 2033
Figure 169: MEA Market Value (US$ Million) by Product Type, 2023 to 2033
Figure 170: MEA Market Value (US$ Million) by Material Type, 2023 to 2033
Figure 171: MEA Market Value (US$ Million) by Mode of Operation, 2023 to 2033
Figure 172: MEA Market Value (US$ Million) by Country, 2023 to 2033
Figure 173: MEA Market Value (US$ Million) Analysis by Country, 2018 to 2033
Figure 174: MEA Market Volume (MT) Analysis by Country, 2018 to 2033
Figure 175: MEA Market Value Share (%) and BPS Analysis by Country, 2023 to 2033
Figure 176: MEA Market Y-o-Y Growth (%) Projections by Country, 2023 to 2033
Figure 177: MEA Market Value (US$ Million) Analysis by Product Type, 2018 to 2033
Figure 178: MEA Market Volume (MT) Analysis by Product Type, 2018 to 2033
Figure 179: MEA Market Value Share (%) and BPS Analysis by Product Type, 2023 to 2033
Figure 180: MEA Market Y-o-Y Growth (%) Projections by Product Type, 2023 to 2033
Figure 181: MEA Market Value (US$ Million) Analysis by Material Type, 2018 to 2033
Figure 182: MEA Market Volume (MT) Analysis by Material Type, 2018 to 2033
Figure 183: MEA Market Value Share (%) and BPS Analysis by Material Type, 2023 to 2033
Figure 184: MEA Market Y-o-Y Growth (%) Projections by Material Type, 2023 to 2033
Figure 185: MEA Market Value (US$ Million) Analysis by Mode of Operation, 2018 to 2033
Figure 186: MEA Market Volume (MT) Analysis by Mode of Operation, 2018 to 2033
Figure 187: MEA Market Value Share (%) and BPS Analysis by Mode of Operation, 2023 to 2033
Figure 188: MEA Market Y-o-Y Growth (%) Projections by Mode of Operation, 2023 to 2033
Figure 189: MEA Market Attractiveness by Product Type, 2023 to 2033
Figure 190: MEA Market Attractiveness by Material Type, 2023 to 2033
Figure 191: MEA Market Attractiveness by Mode of Operation, 2023 to 2033
Figure 192: MEA Market Attractiveness by Country, 2023 to 2033
The global microbrewery equipment market size is expected to reach USD 986.2 Million in 2023.
The microbrewery equipment market is expected to rise at a CAGR of 3.3% during the forecast period.
The overall market for microbrewery equipment is forecast to surpass USD 1,364.5 Million by 2033.
The USA, China, Canada, Germany, and Mexico are the major countries driving demand for microbrewery equipment.
China’s microbrewery equipment market is projected to grow at 5.7% CAGR throughout the forecast period.
The UK microbrewery equipment market is projected to grow at a CAGR of 5.7% during the forecast period.
The market for microbrewery equipment is projected to grow at 5.8% CAGR between 2023 and 2033.
Demand for microbrewery equipment in Japan is expected to rise at 5.8% CAGR through 2033.
The overall demand for microbrewery equipment is expected to surge at 2.6% CAGR during the assessment period.
Explore Similar Insights
Thank you!
You will receive an email from our Business Development Manager. Please be sure to check your SPAM/JUNK folder too.