The Micro Inverter Market is estimated to be valued at USD 2.3 billion in 2025 and is projected to reach USD 5.7 billion by 2035, registering a compound annual growth rate (CAGR) of 9.6% over the forecast period.
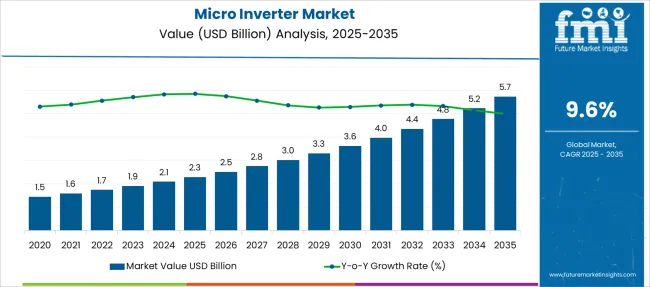
| Metric | Value |
|---|---|
| Micro Inverter Market Estimated Value in (2025 E) | USD 2.3 billion |
| Micro Inverter Market Forecast Value in (2035 F) | USD 5.7 billion |
| Forecast CAGR (2025 to 2035) | 9.6% |
The micro inverter market is growing steadily, supported by increasing adoption of distributed solar energy systems and rising residential solar installations. Market trends have shown that micro inverters provide significant advantages in maximizing energy harvest from individual solar panels, especially in environments with shading or varied panel orientations.
Advances in power electronics and system design have improved micro inverter efficiency and reliability, encouraging wider deployment. Residential consumers have embraced micro inverters due to their ease of installation and ability to enhance overall system performance.
Furthermore, rising awareness about renewable energy and supportive government policies have contributed to market expansion. As the demand for decentralized solar generation grows, so does the need for micro inverter solutions that offer scalability and flexibility. Segmental growth is expected to be driven by Single Phase systems, Standalone connectivity models, and Residential applications due to their compatibility with typical home solar setups.
The market is segmented by Phase, Connectivity, and Application and region. By Phase, the market is divided into Single Phase and Three Phase. In terms of Connectivity, the market is classified into Standalone and On-grid. Based on Application, the market is segmented into Residential and Commercial. Regionally, the market is classified into North America, Latin America, Western Europe, Eastern Europe, Balkan & Baltic Countries, Russia & Belarus, Central Asia, East Asia, South Asia & Pacific, and the Middle East & Africa.
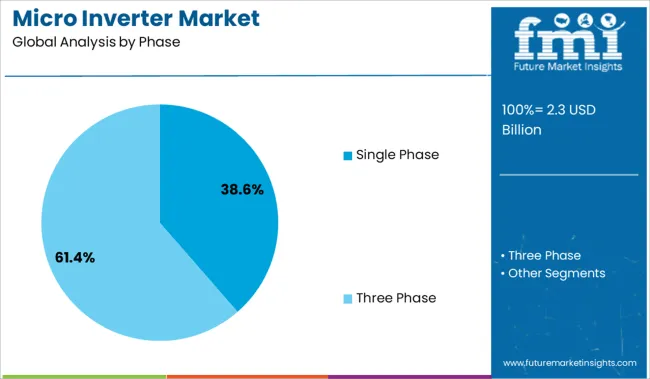
The Single Phase segment is expected to hold 38.6% of the micro inverter market revenue in 2025, maintaining its leadership among phase types. This segment benefits from widespread adoption in residential and small commercial solar systems where single-phase power distribution is common.
Single phase micro inverters are favored for their simpler design and cost-effectiveness, making them suitable for typical household energy needs. The segment growth is further supported by increasing rooftop solar installations in urban and suburban areas.
With the ongoing expansion of distributed energy resources and smart home integration, single phase micro inverters are positioned to remain the preferred choice in smaller scale solar applications.
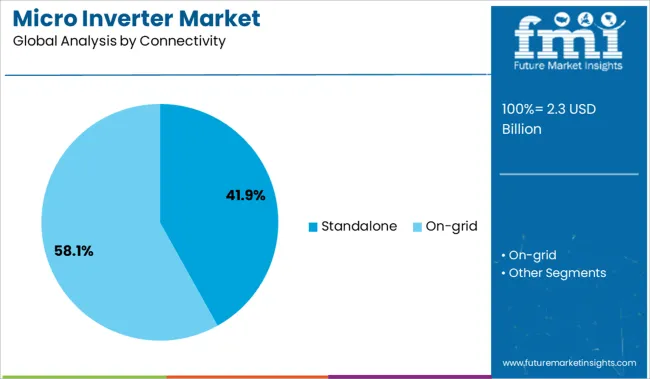
The Standalone connectivity segment is projected to contribute 41.9% of the market revenue in 2025, establishing itself as the leading connectivity type. Growth in this segment has been propelled by micro inverters that operate independently without requiring communication to central controllers or networks.
This simplifies installation and maintenance for residential users and small-scale systems. Standalone micro inverters offer flexibility and reliability, enabling solar panels to function optimally even if some panels are shaded or malfunctioning.
The ease of system expansion and modular setup has appealed to homeowners and installers seeking straightforward, scalable solar solutions. As off-grid and hybrid solar solutions gain traction, standalone connectivity is expected to maintain its dominance.
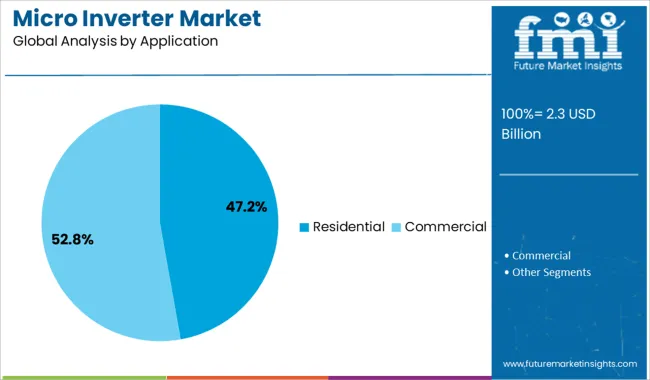
The Residential segment is projected to account for 47.2% of the micro inverter market revenue in 2025, retaining its status as the leading application. Residential solar systems have increasingly adopted micro inverter technology for its benefits in maximizing energy output and simplifying system design.
Homeowners value micro inverters for their ability to optimize individual panel performance and provide detailed monitoring capabilities. Government incentives and sustainability goals have accelerated residential solar adoption, further boosting this segment.
The growth of smart home technologies and integration with energy storage systems has also enhanced the appeal of micro inverters in residential setups. As residential solar continues to expand globally, this segment is expected to remain the primary driver of micro inverter market growth.
The global demand for micro inverters is projected to grow at a healthy CAGR of 9.6% during the forecast period between 2025 to 2035, reaching around USD 5.7 Billion by 2035. Growth in the micro inverter market is driven by the increasing power crisis worldwide, a rise in the number of roof-top solar installations and power backup systems in households, the rising government initiates and investments to strengthen renewable energy infrastructure, innovations in micro inverter technologies, and growing concerns about depletion of fossil fuels.
Micro inverters have become an indispensable part of solar energy systems. They convert the direct current generated by photovoltaic cells (PV cells) into alternating current, which the electrical grid uses. Rising adoption of solar panels across residential and commercial sectors will therefore continue to push the demand for micro inverters dyeing the forecast period. According to a report published by the World Economic Forum, it is estimated that the world will add 70,000 solar panels every hour in the next 5 years.
Consequently, the depletion of fossil fuels at an alarming pace and growing environmental concerns regarding the increasing carbon emission levels will drive the micro inverter market in the future. Besides this, the introduction of advanced and reliable micro inverters that can disseminate high power output and perform multiple applications is expected to create opportunities for micro inverter manufacturers.
Regionally, North America, spearheaded by the USA, is emerging as a promising market for micro inverters owing to the presence of leading market players like Enphase Energy, increasing government investments in expanding solar infrastructure, and availability of advanced micro inverter products.
Over the years, Enphase Energy has made a strong base across major North American countries like the United States and Canada. Most of the people residing in these countries prefer to use Enphase micro inverters like Enphase Iq7 and Enphase IQ8+ as they are more reliable and comply with government standards.
Which Factors Are Limiting the Growth of the Micro Inverter Market?
Despite positive growth projections, the global micro inverter market is facing various challenges that are limiting its growth to a large extent. Some of these factors include high installation costs of solar panels and increased use of string inverters.
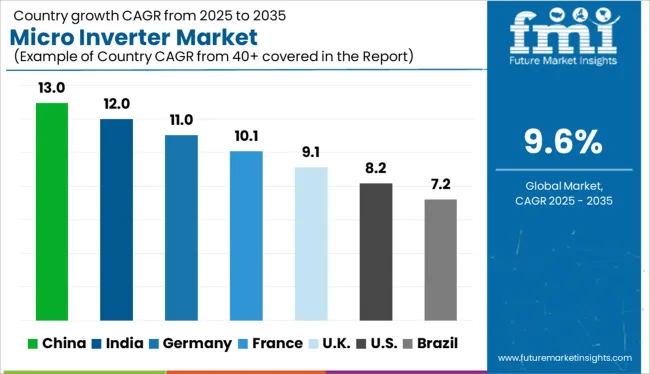
Looming Power Crisis Creating Space for Micro Inverter Market Growth in the United Kingdom
As per FMI, the USA will continue to remain the most lucrative market for micro inverters across Europe, owing to the growing adoption of green technologies, increasing investments in renewable energy infrastructure, rising demand for solar inverters, escalating power crisis, favorable government support, and booming solar panel micro-inverter market.
Growing concerns about the depleting fossil fuels and increasing incidence of power outage across the United Kingdom is prompting people and the government to invest in greener technologies like solar panels and solar micro inverters, which in turn is creating a conducive environment for the growth of micro inverter market.
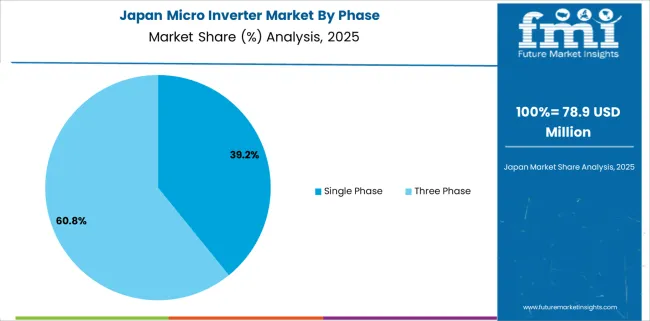
Growing Solar Energy Market Fueling the Demand for Micro Inverters in Japan
With the rapid transition towards renewable energy resources, robust urbanization, the growing popularity of PV inverters, and the heavy presence of leading micro inverter manufacturers, the micro inverter market in Japan is set to grow at a robust pace during the forecast period between 2025 to 2035.
People in Japan are increasingly installing solar panels on the rooftops of their houses, commercial buildings, and farms as a source of electricity. This will continue to provide a strong thrust to the micro inverter market across the country during the forecast period.
Similarly, advancements in solar energy technologies and the availability of reliable micro inverters will further boost the micro inverter market growth in the country.
Single Phase Micro Inverter Remains a Highly Sought-After Power Electronic Device
According to Future Market Insights, the single-phase micro inverters segment will continue to dominate the global micro inverter market, accounting for around 90% revenue share in 2025.
Over the years, single-phase micro inverters have become the most commonly used power electronic device in commercial and residential buildings as they comply with a wide range of standards. These micro inverters enable users to save money by just using one unit instead of two or more.
Demand for Standalone Micro Inverters to Grow at a Higher Pace
Emerging micro inverter market trends indicate that the standalone micro inverter segment will grow at a relatively higher CAGR during the forecast period, owing to their compact size and ability to be installed in remote areas without grid connectivity. In fact, they have become highly sought-after products in residential buildings.
On the other hand, sales of on-grid micro inverters are also expected to rise at a significant pace as a result of their greater flexibility and higher energy conversion ratios. The segment accounted for USD 2.1 Billion in 2024.
Majority of the Micro Inverter Sales Remain Coventrated in the Residential Sector
Based on application, the global micro inverter market is segmented into residential and commercial. Among these, the residential segment will grow at the highest CAGR during the forecast period, owing to the increased usage of both on-grid and off-grid solar panels with micro-inverters built-in by residential units across the world.
Frequent power outages and rising electricity costs are prompting people to adopt electronic power products like micro inverters in their homes. Similarly, rapid urbanization and growing awareness among people about the benefits of micro inverters will further boost segment growth in the future. A robust CAGR of 9.4% has been predicted for the residential segment by FMI.
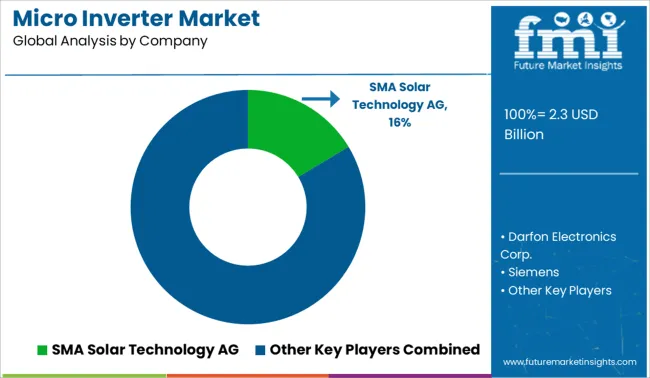
Leading micro inverter manufacturers are continuously adopting various strategies such as new product launches, partnerships, acquisitions, collaborations, mergers, price reduction, and strengthening of distribution channels to gain a competitive edge in the global micro inverter market. Further, they are putting various efforts to educate people about the advantages of using clean energy technologies on the environment.
For instance:
FMI’s latest report uncovers key investment pockets within the global micro inverter market. It provides an in-depth analysis of consumer demands, growth drivers, restraints, and emerging opportunities that somehow affect the market dynamics.
The study offers inclusive details about emerging micro inverter market trends. It illustrates how unscheduled power cuts and rising electricity costs are influencing micro inverter sales.
FMI also offers exhaustive research into factors pushing demand for micro inverters across developed and developing regions. It attempts to explore the growth potential of regions with power outages.
The report breaks down the market into various segments based on phase, connectivity, application, and region, and highlights the leading market segments as well. Besides this, it explains how the growing popularity of power inverters will impact the micro inverter market growth.
The Micro Inverter Market analysis includes:
| Attribute | Details |
|---|---|
| Projected Market Value (2035) | USD 4.36 Billion |
| Estimated Growth Rate (2035) | 9.6% |
| Forecast Period | 2025 to 2035 |
| Historic Data Available for | 2020 to 2024 |
| Market Analysis | USD Million for Value |
| Report Coverage | Market forecast, company share analysis, competition intelligence, Drivers, Restraints, Opportunities and Threats analysis, market dynamics and challenges, and strategic growth initiatives |
| Key Segments Covered | Phase, Connectivity, Application, Region |
| Key regions covered | North America; USA; Canada; Rest of North America; Latin America; Brazil; Argentina; Mexico; Rest of Latin America; Western Europe; Germany; United Kingdom; France; Rest of Western Europe; Eastern Europe; Russia; Spain; Rest of Eastern Europe; South Asia Pacific; China; India; Japan; Malaysia; Thailand; Indonesia; South Korea; Rest of South Asia &Pacific; Middle East & Africa; GCC Countries; Turkey; Israel; Rest of the Middle East and Africa(MEA); Rest of the World; Oceania; Africa; South America |
| Application | Residential, Commercial |
| Key companies profiled | Darfon Electronics Corp., Siemens, Solar Edge Technologies, Inc., Alternative Power System, Inc., Enphase Energy, Sensata Technologies, Inc., TMEIC, Fimer Group, Chilicon Power, LLC, AEconversion GmbH & Co. KG, Sparq Systems, Yotta Energy |
| Customization & pricing | Available upon request |
The global micro inverter market is estimated to be valued at USD 2.3 billion in 2025.
The market size for the micro inverter market is projected to reach USD 5.7 billion by 2035.
The micro inverter market is expected to grow at a 9.6% CAGR between 2025 and 2035.
The key product types in micro inverter market are single phase and three phase.
In terms of connectivity, standalone segment to command 41.9% share in the micro inverter market in 2025.


Full Research Suite comprises of:
Market outlook & trends analysis
Interviews & case studies
Strategic recommendations
Vendor profiles & capabilities analysis
5-year forecasts
8 regions and 60+ country-level data splits
Market segment data splits
12 months of continuous data updates
DELIVERED AS:
PDF EXCEL ONLINE
PV Micro Inverters Market Trends & Forecast 2025 to 2035
Solar Microinverter Market Analysis - Size, Share, and Forecast Outlook 2025 to 2035
Commercial Micro Inverter Market Size and Share Forecast Outlook 2025 to 2035
APAC Solar Micro Inverters Market Analysis – Share, Size, and Forecast 2025 to 2035
Three Phase Micro Inverter Market Size and Share Forecast Outlook 2025 to 2035
Residential Micro Inverter Market Size and Share Forecast Outlook 2025 to 2035
On Grid Residential Micro Inverter Market Size and Share Forecast Outlook 2025 to 2035
Commercial Three Phase Micro Inverter Market Size and Share Forecast Outlook 2025 to 2035
Commercial Single Phase Micro Inverter Market Size and Share Forecast Outlook 2025 to 2035
Microfilm Reader Market Size and Share Forecast Outlook 2025 to 2035
Micro-Dosing Sachet Fillers Market Analysis - Size and Share Forecast Outlook 2025 to 2035
Microbial Growth Monitoring System Market Size and Share Forecast Outlook 2025 to 2035
Micro Hotel Market Forecast and Outlook 2025 to 2035
Microwave Source Market Size and Share Forecast Outlook 2025 to 2035
Micro-energy Harvesting System Market Size and Share Forecast Outlook 2025 to 2035
Micro CHP Market Size and Share Forecast Outlook 2025 to 2035
Micro Irrigation System Market Size and Share Forecast Outlook 2025 to 2035
Micro Flute Paper Market Size and Share Forecast Outlook 2025 to 2035
Microcrystalline Cellulose Market Size and Share Forecast Outlook 2025 to 2035
Micro Balances Market Size and Share Forecast Outlook 2025 to 2035

Thank you!
You will receive an email from our Business Development Manager. Please be sure to check your SPAM/JUNK folder too.
Chat With
MaRIA