Micro-Scale Packaging Machines Market Size and Share Forecast Outlook 2025 to 2035

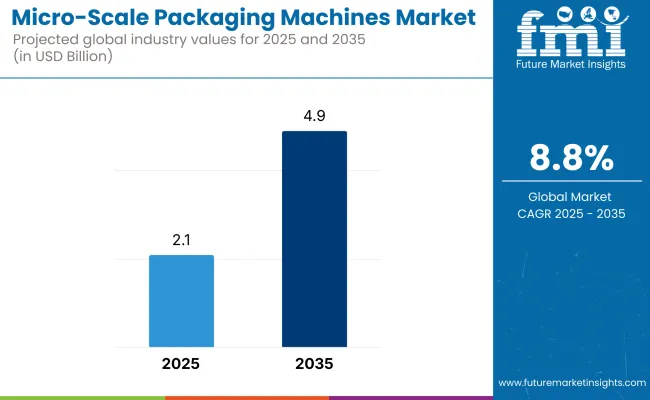
The micro-scale packaging machines market is projected to rise from USD 2.1 billion in 2025 to USD 4.9 billion by 2035, resulting in a total increase of USD 2.8 billion over the decade. This reflects a 133.3% overall market expansion, with a compound annual growth rate (CAGR) of 8.8%. The market will experience a 2.3 increase in size across the forecast period.
Quick Stats for Micro-Scale Packaging Machines

  • Market Value (2025): USD 2.1 billion
  • Market Forecast Value (2035): USD 4.9 billion
  • Market Forecast CAGR: 8.8%
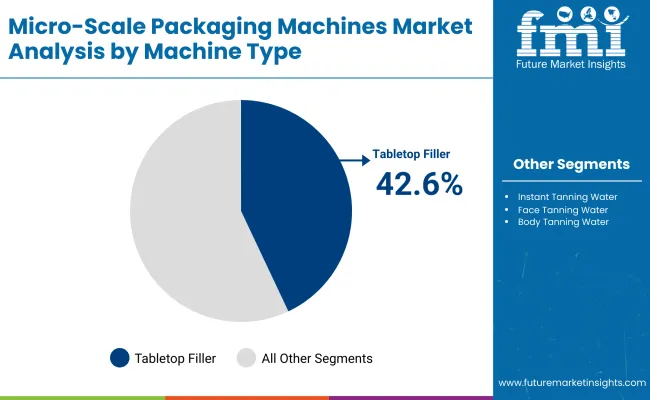
  • Leading Segment in 2025: Tabletop Fillers (42.6%)
  • Key Growth Regions: Asia-Pacific (India is the fastest-growing market with 13.5% CAGR)
  • Top Key Players: Shanghai Ingram Micro Packaging Technology Co., Ltd., E-PAK Machinery, Inc., MaruhoHatsujyo Innovations, Pack’R, Ishida Co., Ltd., Mespack, Pouch Packing Machines Equipment Co., Ltd., IMA S.p.A., Promarksvac Corporation.

Micro Scale Packaging Machines Market

Metric Values
Industry Size (2025E) USD 2.1 billion
Industry Value (2035F) USD 4.9 billion
CAGR (2025 to 2035) 8.8%

In the first five years (2025–2030), the market expands from USD 2.1 billion to USD 3.2 billion, contributing USD 1.1 billion, or 39.3% of the decade’s growth. Growth in this phase is driven by rapid adoption in start-up manufacturing units, laboratory-scale production, and personalized/clinical packaging. Compact formats, plug-and-play functionality, and reduced capital costs position these machines favorably in R&D-intensive industries, nutraceuticals, and emerging regional brands.

In the second half (2030–2035), the market surges from USD 3.2 billion to USD 4.9 billion, generating USD 1.7 billion, or 60.7% of the total growth. Technological advancements such as AI-driven changeovers, modular multi-functionality, and smart HMI interfaces bolster demand for highly agile micro-packaging systems. Their application widens across pharma trials, specialty foods, diagnostics, and on-demand packaging, where customization, traceability, and micro-batch production become essential.

From 2020 to 2024, the micro-scale packaging machines market grew from USD 1.3 billion to USD 1.9 billion, driven by hardware-centric adoption across craft producers, nutraceuticals, diagnostics, and contract manufacturing sectors prioritizing small-batch agility. During this period, the competitive landscape was dominated by compact equipment manufacturers controlling nearly 70% of revenue, with leaders such as Shanghai Ingram Micro Packaging Technology Co., Ltd., E-PAK Machinery, Inc., and MaruhoHatsujyo Innovations delivering high-speed, modular solutions for pouches, vials, ampoules, and specialty formats. Competitive differentiation relied on format flexibility, tool-less changeovers, and GMP compliance, while software integration was typically bundled as part of machine functionality rather than as a standalone monetizable feature.

Demand for micro-scale packaging machines will expand to USD 4.9 billion in 2035, and the revenue mix will shift as SaaS platforms, remote analytics, and design-as-a-service tools grow to over 40% share. Traditional OEMs face competition from automation-native players offering AI-based fill accuracy, cloud-tethered diagnostics, and rapid deployment models. Major equipment vendors are pivoting to hybrid systems that incorporate portable HMI panels, remote configuration interfaces, and small-footprint robotics. Emerging players such as Pack’R, Ishida Co., Ltd., Mespack, Pouch Packing Machines Equipment Co., Ltd., IMA S.p.A., and Promarksvac Corporation are gaining share by specializing in industry-specific packaging cells, subscription-enabled platforms, and modular engineering for scalable micro-production lines.

Why the Micro-Scale Packaging Machines Market is growing?

Growing demand from small-batch producers, startups, and specialty product manufacturers is driving the growth of the micro-scale packaging machines market. These compact systems are designed to handle low to medium output while offering precision, cost-efficiency, and flexibility making them ideal for niche applications in food, cosmetics, nutraceuticals, and artisanal products. The rise of localized production and personalized product formats is encouraging adoption of space-saving, modular packaging equipment.

Tabletop fillers, small-form vertical form-fill-seal (VFFS) machines, and benchtop cappers have gained popularity due to their affordability, ease of operation, and suitability for frequent changeovers. These machines support packaging of powders, liquids, pastes, and solids in pouches, bottles, sachets, and jars with minimal footprint and energy use. The growing presence of e-commerce and direct-to-consumer (DTC) brands has further fueled the need for scalable packaging solutions tailored to small production runs.

Industries such as organic food, beauty & wellness, CBD products, and dietary supplements are driving demand for machines that offer batch flexibility, hygienic contact surfaces, and minimal material wastage. These systems enhance packaging control while lowering barriers for market entry in regulated or artisanal sectors.

Segmental Analysis

The market is segmented by machine type, product type, automation level, packaging format, end-use industry, and region. Machine type includes tabletop fillers, mini flow wrappers, and small-scale vertical form fill seal (VFFS) machines, designed for compact operations with space and volume constraints. Product type segmentation comprises powders, liquids, creams, and solids, addressing diverse handling and dosing requirements across product categories.

Based on automation level, the market includes manual, semi-automatic, and fully automatic systems, enabling varying levels of operational control, efficiency, and investment. Packaging format is categorized into sachets, blisters, tubes, and micro-pouches, offering flexible formats for precise, small-batch packaging needs. End-use industries include startups, R&D labs, specialty food & cosmetics, and craft producers, where scalability, affordability, and product differentiation are key drivers. Regionally, the market is segmented into North America, Europe, Asia-Pacific, Latin America, and the Middle East & Africa.
Tabletop Fillers Segment Leads Owing to Compact Design and Operational Flexibility

Micro Scale Packaging Machines Market By Machine Type

The tabletop fillers segment is expected to account for the highest share of 42.6% in 2025 within the Micro-Scale Packaging Machines Market. This dominance is largely driven by their compact footprint, user-friendly operation, and adaptability across a variety of viscous and non-viscous product types. These machines are especially favored by artisanal producers and small-batch manufacturers seeking precise fill volumes without investing in large industrial systems.

Ideal for startups and pilot lines, tabletop fillers offer consistent fill accuracy and require minimal maintenance. Their modularity and ease of cleaning further appeal to users in regulated sectors such as food and cosmetics. As the demand for flexible packaging formats grows in tandem with shorter production runs and seasonal variants, tabletop fillers are expected to remain a preferred choice among micro and niche producers aiming to scale efficiently.
Specialty Food & Cosmetics Segment Drives Demand Through Small-Batch Customization

Micro Scale Packaging Machines Market By End User

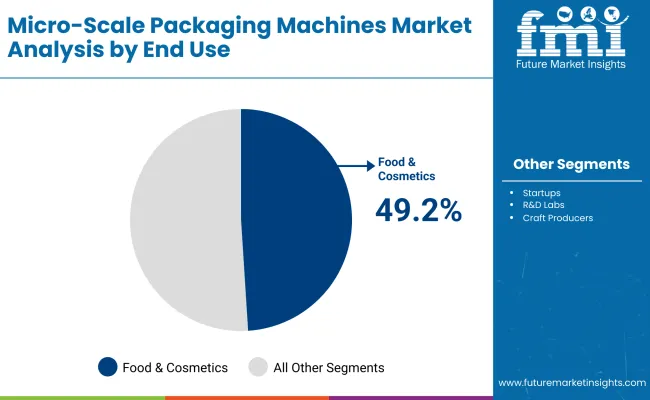
The specialty food & cosmetics segment is projected to lead the end-use industry category with a 49.2% share in 2025. The shift toward organic, artisanal, and personalized products is driving demand for compact packaging solutions that support agile production environments. Micro-scale packaging machines, including tabletop fillers, enable small brands to meet the rising consumer demand for clean-label goods in attractive, retail-ready formats.

In the cosmetics segment, these machines are essential for producing limited-edition skincare, serums, and fragrance units with precise volume and hygienic filling. Similarly, for specialty food producers such as sauce makers, honey producers, or gourmet oil brands these machines offer a cost-effective way to package products in varied sizes for direct-to-consumer and niche retail distribution. As more brands focus on high-margin, small-batch offerings, the segment is likely to drive continued innovation and machine customization in this space.

Powder Applications Dominate Micro-Scale Machines Owing to Expanding Nutraceutical and Food Powder Segments

The powders segment is projected to capture the highest share of 33.2% in 2025 within the micro-scale packaging machines market. This dominance is largely attributed to the increasing consumption of powdered formulations across nutraceuticals, dietary supplements, instant mixes, and specialty health products. These powders often require accurate dosing, contamination-free environments, and compact packaging needs effectively addressed by micro-scale machines.

Compact fillers and volumetric dosing systems integrated into these machines offer precision and consistency essential for packaging protein powders, herbal mixes, and functional foods.

Semi-Automatic Machines Lead in Adoption Due to Balance Between Affordability and Output

The semi-automatic segment is expected to dominate the automation level category with a 48.1% share in 2025. These machines strike a balance between manual labor and automation, making them ideal for small and medium-sized enterprises (SMEs) with budget limitations but growing production needs. Semi-automatic units are particularly favored in artisan food, specialty cosmetics, and nutraceutical packaging.

They offer precision dosing, reduced labor dependency, and consistent sealing capabilities without the high upfront investment of fully automated systems.

Sachets Remain Preferred Format for Cost-Efficient and Portable Unit Dosing

The sachets segment is forecasted to account for the largest share of 36.2% in 2025 in the micro-scale packaging machines market. This prominence stems from sachets' versatility in offering single-use, hygienic, and low-cost packaging across food, cosmetic, pharmaceutical, and personal care applications. They are widely adopted for trial packs, sample distribution, and travel-size products.

Micro-scale machines configured for sachet packaging offer precision form-fill-seal technology, quick changeover, and adaptable sealing mechanisms making them ideal for dynamic SKUs.

What are the Drivers, Restraints, and Key Trends of the Micro-Scale Packaging Machines Market?

Operational throughput limitations and material handling precision restrict scalability, even as demand grows across nutraceuticals, luxury cosmetics, and specialty foods for compact, space-efficient packaging machines that enable high-quality, low-volume, and SKU-diverse product formats.

Growing Demand for Small-batch Flexibility and Niche Product Customization

Micro-scale packaging machines are gaining significant traction in industries where product differentiation, minimal batch runs, and space efficiency are top priorities. In sectors such as premium cosmetics, herbal supplements, diagnostics kits, and gourmet food packaging, brands rely on small-scale machinery for flexible and precise dispensing, filling, and sealing operations.

These machines support highly customized packaging formats such as sample sachets, single-dose vials, or gift-ready pouches that enhance branding and consumer convenience. Their compact design is ideal for pilot production, R&D labs, or startups with limited floor space. As personalization and SKU proliferation increase across global markets, micro-scale packaging machines offer the adaptability required for short-run, high-margin product lines.

Throughput Constraints and Material Handling Challenges

Despite their benefits, micro-scale packaging machines face barriers related to productivity and material compatibility. These systems typically operate at lower speeds and with limited automation features, which can hinder throughput in time-sensitive operations. Their compact size often limits integration of advanced sensors, robotic arms, or inline inspection modules.

Additionally, handling ultra-thin films, biodegradable laminates, or irregular micro-containers requires precise alignment and calibration raising technical demands. Maintenance and changeovers can also be more frequent due to tighter mechanical tolerances. These limitations make them unsuitable for large-scale manufacturing and may deter firms that require high-speed, continuous output or multi-format packaging versatility.

Rise of Plug-and-Play Models and Digital Integration in Compact Designs

A key trend driving innovation in this market is the emergence of plug-and-play micro packaging units equipped with digital interfaces, IoT connectivity, and recipe-based programming. These next-generation machines are tailored for agile manufacturing environments, enabling seamless line integration, remote monitoring, and data logging.

Equipment providers are also focusing on tool-less changeovers, modular component swaps, and built-in self-cleaning to reduce downtime and improve hygiene compliance. Compact machines designed with servo-driven actuators and touch-enabled HMIs are now capable of maintaining precision while offering format flexibility. As the global shift toward localized production, e-commerce sampling, and small-batch launches accelerates, micro-scale packaging machines are poised to become essential tools for innovation-driven brands.
Analysis of Micro-Scale Packaging Machines Market by Key Countries

Micro Scale Packaging Machines Market Country

The global micro-scale packaging machines market is witnessing rapid acceleration, driven by rising adoption among startups, small-batch producers, and niche FMCG brands prioritizing space-efficient, low-cost automation. These compact machines cater to flexible, high-mix, low-volume production needs in cosmetics, nutraceuticals, condiments, pharmaceuticals, and D2C retail.

India and China are leading global growth due to MSME digitization, plug-and-play machine demand, and decentralized manufacturing. Germany and the USA are fueling innovation through modular automation and lab-scale packaging for R&D and specialty production. Japan and the UK are focused on personalization, refillables, and compact pharma lines. South Korea remains a niche but stable growth market, with K-beauty and wellness brands driving adoption for portable filling and sealing units.

Sales Outlook for Micro-Scale Packaging Machines in the United States

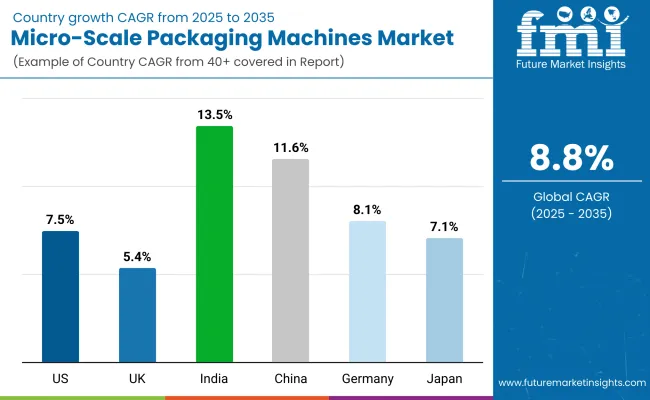
The micro-scale packaging machines market in the United States is expected to grow at a CAGR of 7.5%, driven by demand from small-batch manufacturers, craft brands, and decentralized packaging facilities. Portable filling, pouching, and sealing equipment is being widely adopted across nutraceuticals, personal care, and artisan food categories. R&D labs and test marketing departments are also deploying benchtop machines for pre-commercial product runs.

  • Health and wellness startups are using tabletop fillers for supplements and tinctures.
  • Local food producers are packaging sauces and honey in semi-automatic pouch and bottle lines.
  • Pharma R&D labs are piloting micro-dosing blister lines for clinical test batches.

Growth and Expansion Outlook for Micro-Scale Packaging Machines in the United Kingdom

The micro-scale packaging machines market in the United Kingdom is forecast to grow at a CAGR of 5.4%, supported by growing artisanal and D2C packaging needs. Small-scale manufacturers across skincare, sauces, and beverage shots are adopting compact, plug-and-play units to minimize floor space and capital expenditure. Regulatory-compliant micro lines are gaining traction in pharmacy and nutraceutical use cases.

  • Natural skincare and aromatherapy brands are using benchtop bottling and capping machines.
  • Farm shops and food halls are packaging jams and sauces with entry-level label-and-fill systems.
  • Pharmacies are using micro blister-pack lines for personalized and elderly-targeted dosages.

Growth and Expansion Outlook for Micro-Scale Packaging Machines in India

India is projected to lead globally in the micro-scale packaging machines market, with a CAGR of 13.5% between 2025 and 2035. The surge is fueled by MSME sector automation, rural production hubs, and government-backed programs for decentralized health and nutrition packaging. Compact pouch fillers, tube sealers, and cap applicators are being deployed in small-footprint spaces for Ayurvedic, dairy, personal care, and oral care applications.

  • Rural cooperatives are packaging spices, lentils, and dry snacks using portable FFS units.
  • Ayurvedic brands are filling herbal oils and creams with compact table-mounted fillers.
  • Micro-pharma plants are adopting semi-automatic machines for tablet strip packaging.

Sales Outlook for Micro-Scale Packaging Machines in China

The micro-scale packaging machines market in China is projected to grow at a CAGR of 11.6%, driven by booming e-commerce brands, community food processors, and wellness product manufacturers. Small-footprint automation is being embedded in vertical startups across skincare, herbal products, and meal-prep services. Domestic OEMs are launching pre-configured, entry-level packaging lines with modular upgrades.

  • Douyin and Alibaba micro-brands are packing serum sachets and vitamin kits with compact fillers.
  • Instant tea, soup mix, and supplement brands are adopting benchtop vertical form-fill-seal (VFFS) machines.
  • OEMs are bundling smart IoT modules into mini-machines for order tracking and digital diagnostics.

In-depth Analysis of Micro-Scale Packaging Machines in Germany

Germany’s micro-scale packaging machines market is forecast to grow at a CAGR of 8.1%, led by demand in pharma R&D, batch-specific nutraceuticals, and personalized medical nutrition. Modular machine architectures and GMP compliance are key drivers in hospital compounding and laboratory packaging. German OEMs are producing ultra-compact sealing, de-blistering, and powder dosing systems tailored for high-precision environments.

  • Clinical trial sites are using micro blistering and pouch lines for small-batch formulations.
  • Nutraceuticals and protein supplements are packaged in controlled-dose tubes and capsules.
  • OEMs are developing AI-enabled benchtop machines with programmable fill and cut cycles.

Growth Outlook for Micro-Scale Packaging Machines in Japan

Japan’s micro-scale packaging machines market is projected to grow at a CAGR of 7.1%, driven by strong interest in high-end personalization, OTC compounding, and refillable cosmetics. Minimalist, low-noise, and hygienic benchtop machines are being adopted in specialty wellness stores, boutique skincare outlets, and homeopathic clinics.

  • Boutique beauty shops are using compact airless tube fillers for customized creams.
  • Wellness stores are installing in-store powder dispensers with smart sealers for refill kits.
  • Pharmacies and clinics are piloting point-of-dispense tablet counter-sealers and strip packers.

Opportunity Analysis of South Korea Micro-Scale Packaging Machines Market

The micro-scale packaging machines market in South Korea is forecast to grow at a CAGR of 3.3%, supported by innovations in refill culture, on-demand beauty blending, and functional food startups. K-beauty brands are adopting compact sachet fillers and stick pack units for influencer lines and travel packs. However, wider adoption is moderated by high land cost and central manufacturing preference.

  • K-beauty brands are using micro sachet units for single-use toner, ampoule, and serum lines.
  • Functional snack brands are using micro-pack VFFS machines for ginseng, collagen, and probiotic powders.
  • Startups are collaborating with local OEMs to co-develop aesthetic-friendly, space-saving packaging tools.

Competitive Landscape of Micro-Scale Packaging Machines Market

The micro-scale packaging machines market is moderately fragmented, featuring compact equipment manufacturers, automation system integrators, and multi-format packaging specialists serving niche and small-batch applications across food, pharma, and personal care sectors. Global leaders such as IMA S.p.A., Ishida Co., Ltd., and Mespack hold significant market share, driven by precision dosing systems, cleanroom-ready designs, and compliance with GMP, CE, and FDA guidelines. Their strategies increasingly emphasize digital integration, robotic handling for microformats, and scalable platforms tailored for clinical trials, nutraceuticals, and premium cosmetics.

Established mid-sized players including E-PAK Machinery, Inc., Pack’R, and MaruhoHatsujyo Innovations are addressing demand for low-volume, high-accuracy packaging solutions with servo-driven fillers, flexible pouch handling, and modular cartoning systems. These companies are accelerating adoption in pilot-scale production through hybrid fill-seal designs, intuitive HMIs, and compatibility with various viscosity profiles and dose sizes.

Specialized providers such as Shanghai Ingram Micro Packaging Technology Co., Ltd., Pouch Packing Machines Equipment Co., Ltd., and Promarksvac Corporation focus on cost-effective, application-specific machinery for sachets, stick-packs, and compact liquid or powder formats.

Key Development of Micro-Scale Packaging Machines

  • March July 2025, Ascend Packaging rolled out a series of educational blog posts covering topics such as blister tooling efficiency, leak testing, regulatory compliance, and increasing fill-line accuracy and speed on small-scale pharmaceutical packaging lines.
  • June 4, 2024, Summit Europe expanded its BOV (bag-on-valve) aerosol valve production capacity in Almere, Netherlands by 40%.

Micro-Scale Packaging Machines Companies

  • Shanghai Ingram Micro Packaging Technology Co., Ltd.
  • E-PAK Machinery, Inc.
  • MaruhoHatsujyo Innovations
  • Pack’R
  • Ishida Co., Ltd.
  • Mespack
  • Pouch Packing Machines Equipment Co., Ltd.
  • IMA S.p.A.
  • Promarksvac Corporation.

Scope of the Report

Item Value
Quantitative Units USD 2.1 Billion
By Machine Type Tabletop Fillers, Mini Flow Wrappers, and Small-scale Vertical Form Fill Seal (VFFS)
By Product Type Powders, Liquids, Creams, and Solids
By Automation Level Manual, Semi-Automatic, and Fully Automatic
By Packaging Format Sachets, Blisters, Tubes, and Micro-Pouches
By End-Use Industry Startups, R&D Labs, Specialty Food & Cosmetics, and Craft Producers
Key Companies Profiled Shanghai Ingram Micro Packaging Technology Co., Ltd., E-PAK Machinery, Inc., Maruho Hatsujyo Innovations, Pack’R , Ishida Co., Ltd., Mespack , Pouch Packing Machines Equipment Co., Ltd., IMA S.p.A., Promarksvac Corporation
Additional Attributes Rising demand for ultra-compact machinery in lab and pilot-scale settings, increased preference for modular tabletop units in startup ecosystems, flexible automation for limited-batch production, growing market for artisan and specialty packaging formats, regulatory support for micro-dose pharma testing, integration of cleanroom-friendly designs, adoption in cosmetics sampling and personalized wellness packs, demand for flexible formats like sachets and micro-pouches, use of IoT for precision control in micro-pack lines, and regional growth driven by Asia-Pacific and North American incubator manufacturing hubs

Segment

By Machine Type:

  • Tabletop Fillers
  • Mini Flow Wrappers
  • Small-scale Vertical Form Fill Seal (VFFS)

By Product Type:

  • Powders
  • Liquids
  • Creams
  • Solids

By Automation Level:

  • Manual
  • Semi-Automatic
  • Fully Automatic

By Packaging Format:

  • Sachets
  • Blisters
  • Tubes
  • Micro-Pouches

By End-Use Industry:

  • Startups
  • R&D Labs
  • Specialty Food & Cosmetics
  • Craft Producers
  • By Region
  • North America
  • Europe
  • Asia-Pacific
  • Latin America
  • Middle East & Africa

Table of Content

  1. Executive Summary
    • Global Market Outlook
    • Demand-side Trends
    • Supply-side Trends
    • Technology Roadmap Analysis
    • Analysis and Recommendations
  2. Market Overview
    • Market Coverage / Taxonomy
    • Market Definition / Scope / Limitations
  3. Market Background
    • Market Dynamics
      • Drivers
      • Restraints
      • Opportunity
      • Trends
    • Scenario Forecast
      • Demand in Optimistic Scenario
      • Demand in Likely Scenario
      • Demand in Conservative Scenario
    • Opportunity Map Analysis
    • Product Life Cycle Analysis
    • Supply Chain Analysis
      • Supply Side Participants and their Roles
        • Producers
        • Mid-Level Participants (Traders/ Agents/ Brokers)
        • Wholesalers and Distributors
      • Value Added and Value Created at Node in the Supply Chain
      • List of Raw Material Suppliers
      • List of Existing and Potential Buyer’s
    • Investment Feasibility Matrix
    • Value Chain Analysis
      • Profit Margin Analysis
      • Wholesalers and Distributors
      • Retailers
    • PESTLE and Porter’s Analysis
    • Regulatory Landscape
      • By Key Regions
      • By Key Countries
    • Regional Parent Market Outlook
    • Production and Consumption Statistics
    • Import and Export Statistics
  4. Global Analysis 2020 to 2024 and Forecast, 2025 to 2035
    • Historical Market Size Value (USD Million) & Volume (Units) Analysis, 2020 to 2024
    • Current and Future Market Size Value (USD Million) & Volume (Units) Projections, 2025 to 2035
      • Y-o-Y Growth Trend Analysis
      • Absolute $ Opportunity Analysis
  5. Global Pricing Analysis 2020 to 2024 and Forecast 2025 to 2035
  6. Global Analysis 2020 to 2024 and Forecast 2025 to 2035, By By Machine Type
    • Introduction / Key Findings
    • Historical Market Size Value (USD Million) & Volume (Units) Analysis By By Machine Type, 2020 to 2024
    • Current and Future Market Size Value (USD Million) & Volume (Units) Analysis and Forecast By By Machine Type, 2025 to 2035
      • Tabletop Fillers
      • Mini Flow Wrappers
      • Small-scale Vertical Form Fill Seal (VFFS)
    • Y-o-Y Growth Trend Analysis By By Machine Type, 2020 to 2024
    • Absolute $ Opportunity Analysis By By Machine Type, 2025 to 2035
  7. Global Analysis 2020 to 2024 and Forecast 2025 to 2035, By By Product Type
    • Introduction / Key Findings
    • Historical Market Size Value (USD Million) & Volume (Units) Analysis By By Product Type, 2020 to 2024
    • Current and Future Market Size Value (USD Million) & Volume (Units) Analysis and Forecast By By Product Type, 2025 to 2035
      • Powders
      • Liquids
      • Creams
      • Solids
    • Y-o-Y Growth Trend Analysis By By Product Type, 2020 to 2024
    • Absolute $ Opportunity Analysis By By Product Type, 2025 to 2035
  8. Global Analysis 2020 to 2024 and Forecast 2025 to 2035, By By Automation Level
    • Introduction / Key Findings
    • Historical Market Size Value (USD Million) & Volume (Units) Analysis By By Automation Level, 2020 to 2024
    • Current and Future Market Size Value (USD Million) & Volume (Units) Analysis and Forecast By By Automation Level, 2025 to 2035
      • Manual
      • Semi-Automatic
      • Fully Automatic
    • Y-o-Y Growth Trend Analysis By By Automation Level, 2020 to 2024
    • Absolute $ Opportunity Analysis By By Automation Level, 2025 to 2035
  9. Global Analysis 2020 to 2024 and Forecast 2025 to 2035, By By Packaging Format
    • Introduction / Key Findings
    • Historical Market Size Value (USD Million) & Volume (Units) Analysis By By Packaging Format, 2020 to 2024
    • Current and Future Market Size Value (USD Million) & Volume (Units) Analysis and Forecast By By Packaging Format, 2025 to 2035
      • Sachets
      • Blisters
      • Tubes
      • Micro-Pouches
    • Y-o-Y Growth Trend Analysis By By Packaging Format, 2020 to 2024
    • Absolute $ Opportunity Analysis By By Packaging Format, 2025 to 2035
  10. Global Analysis 2020 to 2024 and Forecast 2025 to 2035, By By End-Use Industry
    • Introduction / Key Findings
    • Historical Market Size Value (USD Million) & Volume (Units) Analysis By By End-Use Industry, 2020 to 2024
    • Current and Future Market Size Value (USD Million) & Volume (Units) Analysis and Forecast By By End-Use Industry, 2025 to 2035
      • Startups
      • R&D Labs
      • Specialty Food & Cosmetics
      • Craft Producers
    • Y-o-Y Growth Trend Analysis By By End-Use Industry, 2020 to 2024
    • Absolute $ Opportunity Analysis By By End-Use Industry, 2025 to 2035
  11. Global Analysis 2020 to 2024 and Forecast 2025 to 2035, By Region
    • Introduction
    • Historical Market Size Value (USD Million) & Volume (Units) Analysis By Region, 2020 to 2024
    • Current Market Size Value (USD Million) & Volume (Units) Analysis and Forecast By Region, 2025 to 2035
      • North America
      • Latin America
      • Europe
      • East Asia
      • South Asia
      • Oceania
      • MEA
    • Market Attractiveness Analysis By Region
  12. North America Analysis 2020 to 2024 and Forecast 2025 to 2035, By Country
    • Historical Market Size Value (USD Million) & Volume (Units) Trend Analysis By Market Taxonomy, 2020 to 2024
    • Market Size Value (USD Million) & Volume (Units) Forecast By Market Taxonomy, 2025 to 2035
      • By Country
        • USA
        • Canada
      • By By Machine Type
      • By By Product Type
      • By By Automation Level
      • By By Packaging Format
      • By By End-Use Industry
    • Market Attractiveness Analysis
      • By Country
      • By By Machine Type
      • By By Product Type
      • By By Automation Level
      • By By Packaging Format
      • By By End-Use Industry
    • Key Takeaways
  13. Latin America Analysis 2020 to 2024 and Forecast 2025 to 2035, By Country
    • Historical Market Size Value (USD Million) & Volume (Units) Trend Analysis By Market Taxonomy, 2020 to 2024
    • Market Size Value (USD Million) & Volume (Units) Forecast By Market Taxonomy, 2025 to 2035
      • By Country
        • Brazil
        • Mexico
        • Argentina
        • Chile
        • Peru
        • Rest of Latin America
      • By By Machine Type
      • By By Product Type
      • By By Automation Level
      • By By Packaging Format
      • By By End-Use Industry
    • Market Attractiveness Analysis
      • By Country
      • By By Machine Type
      • By By Product Type
      • By By Automation Level
      • By By Packaging Format
      • By By End-Use Industry
    • Key Takeaways
  14. Europe Analysis 2020 to 2024 and Forecast 2025 to 2035, By Country
    • Historical Market Size Value (USD Million) & Volume (Units) Trend Analysis By Market Taxonomy, 2020 to 2024
    • Market Size Value (USD Million) & Volume (Units) Forecast By Market Taxonomy, 2025 to 2035
      • By Country
        • Germany
        • Italy
        • France
        • UK
        • Spain
        • Russia
        • BENELUX
        • Rest of Europe
      • By By Machine Type
      • By By Product Type
      • By By Automation Level
      • By By Packaging Format
      • By By End-Use Industry
    • Market Attractiveness Analysis
      • By Country
      • By By Machine Type
      • By By Product Type
      • By By Automation Level
      • By By Packaging Format
      • By By End-Use Industry
    • Key Takeaways
  15. East Asia Analysis 2020 to 2024 and Forecast 2025 to 2035, By Country
    • Historical Market Size Value (USD Million) & Volume (Units) Trend Analysis By Market Taxonomy, 2020 to 2024
    • Market Size Value (USD Million) & Volume (Units) Forecast By Market Taxonomy, 2025 to 2035
      • By Country
        • China
        • Japan
        • South Korea
      • By By Machine Type
      • By By Product Type
      • By By Automation Level
      • By By Packaging Format
      • By By End-Use Industry
    • Market Attractiveness Analysis
      • By Country
      • By By Machine Type
      • By By Product Type
      • By By Automation Level
      • By By Packaging Format
      • By By End-Use Industry
    • Key Takeaways
  16. South Asia Analysis 2020 to 2024 and Forecast 2025 to 2035, By Country
    • Historical Market Size Value (USD Million) & Volume (Units) Trend Analysis By Market Taxonomy, 2020 to 2024
    • Market Size Value (USD Million) & Volume (Units) Forecast By Market Taxonomy, 2025 to 2035
      • By Country
        • India
        • Thailand
        • Malaysia
        • Indonesia
        • Rest of South Asia
      • By By Machine Type
      • By By Product Type
      • By By Automation Level
      • By By Packaging Format
      • By By End-Use Industry
    • Market Attractiveness Analysis
      • By Country
      • By By Machine Type
      • By By Product Type
      • By By Automation Level
      • By By Packaging Format
      • By By End-Use Industry
    • Key Takeaways
  17. Oceania Analysis 2020 to 2024 and Forecast 2025 to 2035, By Country
    • Historical Market Size Value (USD Million) & Volume (Units) Trend Analysis By Market Taxonomy, 2020 to 2024
    • Market Size Value (USD Million) & Volume (Units) Forecast By Market Taxonomy, 2025 to 2035
      • By Country
        • Australia
        • New Zealand
      • By By Machine Type
      • By By Product Type
      • By By Automation Level
      • By By Packaging Format
      • By By End-Use Industry
    • Market Attractiveness Analysis
      • By Country
      • By By Machine Type
      • By By Product Type
      • By By Automation Level
      • By By Packaging Format
      • By By End-Use Industry
    • Key Takeaways
  18. MEA Analysis 2020 to 2024 and Forecast 2025 to 2035, By Country
    • Historical Market Size Value (USD Million) & Volume (Units) Trend Analysis By Market Taxonomy, 2020 to 2024
    • Market Size Value (USD Million) & Volume (Units) Forecast By Market Taxonomy, 2025 to 2035
      • By Country
        • GCC
        • Rest of MEA
      • By By Machine Type
      • By By Product Type
      • By By Automation Level
      • By By Packaging Format
      • By By End-Use Industry
    • Market Attractiveness Analysis
      • By Country
      • By By Machine Type
      • By By Product Type
      • By By Automation Level
      • By By Packaging Format
      • By By End-Use Industry
    • Key Takeaways
  19. Key Countries Analysis
    • USA
      • Pricing Analysis
      • Market Share Analysis, 2024
        • By By Machine Type
        • By By Product Type
        • By By Automation Level
        • By By Packaging Format
        • By By End-Use Industry
    • Canada
      • Pricing Analysis
      • Market Share Analysis, 2024
        • By By Machine Type
        • By By Product Type
        • By By Automation Level
        • By By Packaging Format
        • By By End-Use Industry
    • Brazil
      • Pricing Analysis
      • Market Share Analysis, 2024
        • By By Machine Type
        • By By Product Type
        • By By Automation Level
        • By By Packaging Format
        • By By End-Use Industry
    • Mexico
      • Pricing Analysis
      • Market Share Analysis, 2024
        • By By Machine Type
        • By By Product Type
        • By By Automation Level
        • By By Packaging Format
        • By By End-Use Industry
    • Argentina
      • Pricing Analysis
      • Market Share Analysis, 2024
        • By By Machine Type
        • By By Product Type
        • By By Automation Level
        • By By Packaging Format
        • By By End-Use Industry
  20. Market Structure Analysis
    • Competition Dashboard
    • Competition Benchmarking
    • Market Share Analysis of Top Players
      • By Regional
      • By By Machine Type
      • By By Product Type
      • By By Automation Level
      • By By Packaging Format
      • By By End-Use Industry
  21. Competition Analysis
    • Competition Deep Dive
      • Shanghai Ingram Micro Packaging Technology Co., Ltd.
        • Overview
        • Product Portfolio
        • Profitability by Market Segments (Product/Age /Sales Channel/Region)
        • Sales Footprint
        • Strategy Overview
          • Marketing Strategy
          • Product Strategy
          • Channel Strategy
      • E-PAK Machinery, Inc.
        • Overview
        • Product Portfolio
        • Profitability by Market Segments (Product/Age /Sales Channel/Region)
        • Sales Footprint
        • Strategy Overview
          • Marketing Strategy
          • Product Strategy
          • Channel Strategy
      • Maruho Hatsujyo Innovations
        • Overview
        • Product Portfolio
        • Profitability by Market Segments (Product/Age /Sales Channel/Region)
        • Sales Footprint
        • Strategy Overview
          • Marketing Strategy
          • Product Strategy
          • Channel Strategy
      • Pack’R
        • Overview
        • Product Portfolio
        • Profitability by Market Segments (Product/Age /Sales Channel/Region)
        • Sales Footprint
        • Strategy Overview
          • Marketing Strategy
          • Product Strategy
          • Channel Strategy
      • Ishida Co., Ltd.
        • Overview
        • Product Portfolio
        • Profitability by Market Segments (Product/Age /Sales Channel/Region)
        • Sales Footprint
        • Strategy Overview
          • Marketing Strategy
          • Product Strategy
          • Channel Strategy
      • Mespack
        • Overview
        • Product Portfolio
        • Profitability by Market Segments (Product/Age /Sales Channel/Region)
        • Sales Footprint
        • Strategy Overview
          • Marketing Strategy
          • Product Strategy
          • Channel Strategy
      • Pouch Packing Machines Equipment Co., Ltd.
        • Overview
        • Product Portfolio
        • Profitability by Market Segments (Product/Age /Sales Channel/Region)
        • Sales Footprint
        • Strategy Overview
          • Marketing Strategy
          • Product Strategy
          • Channel Strategy
      • IMA S.p.A.
        • Overview
        • Product Portfolio
        • Profitability by Market Segments (Product/Age /Sales Channel/Region)
        • Sales Footprint
        • Strategy Overview
          • Marketing Strategy
          • Product Strategy
          • Channel Strategy
      • Promarksvac Corporation
        • Overview
        • Product Portfolio
        • Profitability by Market Segments (Product/Age /Sales Channel/Region)
        • Sales Footprint
        • Strategy Overview
          • Marketing Strategy
          • Product Strategy
          • Channel Strategy
  22. Assumptions & Acronyms Used
  23. Research Methodology

List of Tables

  • Table 1: Global Machines Value (USD Million) Forecast by Region, 2020-2035
  • Table 2: Global Machines Volume (Units) Forecast by Region, 2020-2035
  • Table 3: Global Machines Value (USD Million) Forecast by By Machine Type, 2020-2035
  • Table 4: Global Machines Volume (Units) Forecast by By Machine Type, 2020-2035
  • Table 5: Global Machines Value (USD Million) Forecast by By Product Type, 2020-2035
  • Table 6: Global Machines Volume (Units) Forecast by By Product Type, 2020-2035
  • Table 7: Global Machines Value (USD Million) Forecast by By Automation Level, 2020-2035
  • Table 8: Global Machines Volume (Units) Forecast by By Automation Level, 2020-2035
  • Table 9: Global Machines Value (USD Million) Forecast by By Packaging Format, 2020-2035
  • Table 10: Global Machines Volume (Units) Forecast by By Packaging Format, 2020-2035
  • Table 11: Global Machines Value (USD Million) Forecast by By End-Use Industry, 2020-2035
  • Table 12: Global Machines Volume (Units) Forecast by By End-Use Industry, 2020-2035
  • Table 13: North America Machines Value (USD Million) Forecast by Country, 2020-2035
  • Table 14: North America Machines Volume (Units) Forecast by Country, 2020-2035
  • Table 15: North America Machines Value (USD Million) Forecast by By Machine Type, 2020-2035
  • Table 16: North America Machines Volume (Units) Forecast by By Machine Type, 2020-2035
  • Table 17: North America Machines Value (USD Million) Forecast by By Product Type, 2020-2035
  • Table 18: North America Machines Volume (Units) Forecast by By Product Type, 2020-2035
  • Table 19: North America Machines Value (USD Million) Forecast by By Automation Level, 2020-2035
  • Table 20: North America Machines Volume (Units) Forecast by By Automation Level, 2020-2035
  • Table 21: North America Machines Value (USD Million) Forecast by By Packaging Format, 2020-2035
  • Table 22: North America Machines Volume (Units) Forecast by By Packaging Format, 2020-2035
  • Table 23: North America Machines Value (USD Million) Forecast by By End-Use Industry, 2020-2035
  • Table 24: North America Machines Volume (Units) Forecast by By End-Use Industry, 2020-2035
  • Table 25: Latin America Machines Value (USD Million) Forecast by Country, 2020-2035
  • Table 26: Latin America Machines Volume (Units) Forecast by Country, 2020-2035
  • Table 27: Latin America Machines Value (USD Million) Forecast by By Machine Type, 2020-2035
  • Table 28: Latin America Machines Volume (Units) Forecast by By Machine Type, 2020-2035
  • Table 29: Latin America Machines Value (USD Million) Forecast by By Product Type, 2020-2035
  • Table 30: Latin America Machines Volume (Units) Forecast by By Product Type, 2020-2035
  • Table 31: Latin America Machines Value (USD Million) Forecast by By Automation Level, 2020-2035
  • Table 32: Latin America Machines Volume (Units) Forecast by By Automation Level, 2020-2035
  • Table 33: Latin America Machines Value (USD Million) Forecast by By Packaging Format, 2020-2035
  • Table 34: Latin America Machines Volume (Units) Forecast by By Packaging Format, 2020-2035
  • Table 35: Latin America Machines Value (USD Million) Forecast by By End-Use Industry, 2020-2035
  • Table 36: Latin America Machines Volume (Units) Forecast by By End-Use Industry, 2020-2035
  • Table 37: Europe Machines Value (USD Million) Forecast by Country, 2020-2035
  • Table 38: Europe Machines Volume (Units) Forecast by Country, 2020-2035
  • Table 39: Europe Machines Value (USD Million) Forecast by By Machine Type, 2020-2035
  • Table 40: Europe Machines Volume (Units) Forecast by By Machine Type, 2020-2035
  • Table 41: Europe Machines Value (USD Million) Forecast by By Product Type, 2020-2035
  • Table 42: Europe Machines Volume (Units) Forecast by By Product Type, 2020-2035
  • Table 43: Europe Machines Value (USD Million) Forecast by By Automation Level, 2020-2035
  • Table 44: Europe Machines Volume (Units) Forecast by By Automation Level, 2020-2035
  • Table 45: Europe Machines Value (USD Million) Forecast by By Packaging Format, 2020-2035
  • Table 46: Europe Machines Volume (Units) Forecast by By Packaging Format, 2020-2035
  • Table 47: Europe Machines Value (USD Million) Forecast by By End-Use Industry, 2020-2035
  • Table 48: Europe Machines Volume (Units) Forecast by By End-Use Industry, 2020-2035
  • Table 49: East Asia Machines Value (USD Million) Forecast by Country, 2020-2035
  • Table 50: East Asia Machines Volume (Units) Forecast by Country, 2020-2035
  • Table 51: East Asia Machines Value (USD Million) Forecast by By Machine Type, 2020-2035
  • Table 52: East Asia Machines Volume (Units) Forecast by By Machine Type, 2020-2035
  • Table 53: East Asia Machines Value (USD Million) Forecast by By Product Type, 2020-2035
  • Table 54: East Asia Machines Volume (Units) Forecast by By Product Type, 2020-2035
  • Table 55: East Asia Machines Value (USD Million) Forecast by By Automation Level, 2020-2035
  • Table 56: East Asia Machines Volume (Units) Forecast by By Automation Level, 2020-2035
  • Table 57: East Asia Machines Value (USD Million) Forecast by By Packaging Format, 2020-2035
  • Table 58: East Asia Machines Volume (Units) Forecast by By Packaging Format, 2020-2035
  • Table 59: East Asia Machines Value (USD Million) Forecast by By End-Use Industry, 2020-2035
  • Table 60: East Asia Machines Volume (Units) Forecast by By End-Use Industry, 2020-2035
  • Table 61: South Asia Machines Value (USD Million) Forecast by Country, 2020-2035
  • Table 62: South Asia Machines Volume (Units) Forecast by Country, 2020-2035
  • Table 63: South Asia Machines Value (USD Million) Forecast by By Machine Type, 2020-2035
  • Table 64: South Asia Machines Volume (Units) Forecast by By Machine Type, 2020-2035
  • Table 65: South Asia Machines Value (USD Million) Forecast by By Product Type, 2020-2035
  • Table 66: South Asia Machines Volume (Units) Forecast by By Product Type, 2020-2035
  • Table 67: South Asia Machines Value (USD Million) Forecast by By Automation Level, 2020-2035
  • Table 68: South Asia Machines Volume (Units) Forecast by By Automation Level, 2020-2035
  • Table 69: South Asia Machines Value (USD Million) Forecast by By Packaging Format, 2020-2035
  • Table 70: South Asia Machines Volume (Units) Forecast by By Packaging Format, 2020-2035
  • Table 71: South Asia Machines Value (USD Million) Forecast by By End-Use Industry, 2020-2035
  • Table 72: South Asia Machines Volume (Units) Forecast by By End-Use Industry, 2020-2035
  • Table 73: Oceania Machines Value (USD Million) Forecast by Country, 2020-2035
  • Table 74: Oceania Machines Volume (Units) Forecast by Country, 2020-2035
  • Table 75: Oceania Machines Value (USD Million) Forecast by By Machine Type, 2020-2035
  • Table 76: Oceania Machines Volume (Units) Forecast by By Machine Type, 2020-2035
  • Table 77: Oceania Machines Value (USD Million) Forecast by By Product Type, 2020-2035
  • Table 78: Oceania Machines Volume (Units) Forecast by By Product Type, 2020-2035
  • Table 79: Oceania Machines Value (USD Million) Forecast by By Automation Level, 2020-2035
  • Table 80: Oceania Machines Volume (Units) Forecast by By Automation Level, 2020-2035
  • Table 81: Oceania Machines Value (USD Million) Forecast by By Packaging Format, 2020-2035
  • Table 82: Oceania Machines Volume (Units) Forecast by By Packaging Format, 2020-2035
  • Table 83: Oceania Machines Value (USD Million) Forecast by By End-Use Industry, 2020-2035
  • Table 84: Oceania Machines Volume (Units) Forecast by By End-Use Industry, 2020-2035
  • Table 85: MEA Machines Value (USD Million) Forecast by Country, 2020-2035
  • Table 86: MEA Machines Volume (Units) Forecast by Country, 2020-2035
  • Table 87: MEA Machines Value (USD Million) Forecast by By Machine Type, 2020-2035
  • Table 88: MEA Machines Volume (Units) Forecast by By Machine Type, 2020-2035
  • Table 89: MEA Machines Value (USD Million) Forecast by By Product Type, 2020-2035
  • Table 90: MEA Machines Volume (Units) Forecast by By Product Type, 2020-2035
  • Table 91: MEA Machines Value (USD Million) Forecast by By Automation Level, 2020-2035
  • Table 92: MEA Machines Volume (Units) Forecast by By Automation Level, 2020-2035
  • Table 93: MEA Machines Value (USD Million) Forecast by By Packaging Format, 2020-2035
  • Table 94: MEA Machines Volume (Units) Forecast by By Packaging Format, 2020-2035
  • Table 95: MEA Machines Value (USD Million) Forecast by By End-Use Industry, 2020-2035
  • Table 96: MEA Machines Volume (Units) Forecast by By End-Use Industry, 2020-2035

List of Figures

  • Figure 1: Global Machines Volume (Units) Forecast 2020-2035
  • Figure 2: Global Machines Pricing Analysis
  • Figure 3: Global Machines Value (USD Million) Forecast 2020-2035
  • Figure 4: Global Machines Value Share and BPS Analysis by By Machine Type, 2025 and 2035
  • Figure 5: Global Machines Y-o-Y Growth Comparison by By Machine Type, 2025-2035
  • Figure 6: Global Machines Attractiveness Analysis by By Machine Type
  • Figure 7: Global Machines Value Share and BPS Analysis by By Product Type, 2025 and 2035
  • Figure 8: Global Machines Y-o-Y Growth Comparison by By Product Type, 2025-2035
  • Figure 9: Global Machines Attractiveness Analysis by By Product Type
  • Figure 10: Global Machines Value Share and BPS Analysis by By Automation Level, 2025 and 2035
  • Figure 11: Global Machines Y-o-Y Growth Comparison by By Automation Level, 2025-2035
  • Figure 12: Global Machines Attractiveness Analysis by By Automation Level
  • Figure 13: Global Machines Value Share and BPS Analysis by By Packaging Format, 2025 and 2035
  • Figure 14: Global Machines Y-o-Y Growth Comparison by By Packaging Format, 2025-2035
  • Figure 15: Global Machines Attractiveness Analysis by By Packaging Format
  • Figure 16: Global Machines Value Share and BPS Analysis by By End-Use Industry, 2025 and 2035
  • Figure 17: Global Machines Y-o-Y Growth Comparison by By End-Use Industry, 2025-2035
  • Figure 18: Global Machines Attractiveness Analysis by By End-Use Industry
  • Figure 19: Global Machines Value (USD Million) Share and BPS Analysis by Region, 2025 and 2035
  • Figure 20: Global Machines Y-o-Y Growth Comparison by Region, 2025-2035
  • Figure 21: Global Machines Attractiveness Analysis by Region
  • Figure 22: North America Machines Incremental $ Opportunity, 2025-2035
  • Figure 23: Latin America Machines Incremental $ Opportunity, 2025-2035
  • Figure 24: Europe Machines Incremental $ Opportunity, 2025-2035
  • Figure 25: East Asia Machines Incremental $ Opportunity, 2025-2035
  • Figure 26: South Asia Machines Incremental $ Opportunity, 2025-2035
  • Figure 27: Oceania Machines Incremental $ Opportunity, 2025-2035
  • Figure 28: MEA Machines Incremental $ Opportunity, 2025-2035
  • Figure 29: North America Machines Value Share and BPS Analysis by Country, 2025 and 2035
  • Figure 30: North America Machines Value Share and BPS Analysis by By Machine Type, 2025 and 2035
  • Figure 31: North America Machines Y-o-Y Growth Comparison by By Machine Type, 2025-2035
  • Figure 32: North America Machines Attractiveness Analysis by By Machine Type
  • Figure 33: North America Machines Value Share and BPS Analysis by By Product Type, 2025 and 2035
  • Figure 34: North America Machines Y-o-Y Growth Comparison by By Product Type, 2025-2035
  • Figure 35: North America Machines Attractiveness Analysis by By Product Type
  • Figure 36: North America Machines Value Share and BPS Analysis by By Automation Level, 2025 and 2035
  • Figure 37: North America Machines Y-o-Y Growth Comparison by By Automation Level, 2025-2035
  • Figure 38: North America Machines Attractiveness Analysis by By Automation Level
  • Figure 39: North America Machines Value Share and BPS Analysis by By Packaging Format, 2025 and 2035
  • Figure 40: North America Machines Y-o-Y Growth Comparison by By Packaging Format, 2025-2035
  • Figure 41: North America Machines Attractiveness Analysis by By Packaging Format
  • Figure 42: North America Machines Value Share and BPS Analysis by By End-Use Industry, 2025 and 2035
  • Figure 43: North America Machines Y-o-Y Growth Comparison by By End-Use Industry, 2025-2035
  • Figure 44: North America Machines Attractiveness Analysis by By End-Use Industry
  • Figure 45: Latin America Machines Value Share and BPS Analysis by Country, 2025 and 2035
  • Figure 46: Latin America Machines Value Share and BPS Analysis by By Machine Type, 2025 and 2035
  • Figure 47: Latin America Machines Y-o-Y Growth Comparison by By Machine Type, 2025-2035
  • Figure 48: Latin America Machines Attractiveness Analysis by By Machine Type
  • Figure 49: Latin America Machines Value Share and BPS Analysis by By Product Type, 2025 and 2035
  • Figure 50: Latin America Machines Y-o-Y Growth Comparison by By Product Type, 2025-2035
  • Figure 51: Latin America Machines Attractiveness Analysis by By Product Type
  • Figure 52: Latin America Machines Value Share and BPS Analysis by By Automation Level, 2025 and 2035
  • Figure 53: Latin America Machines Y-o-Y Growth Comparison by By Automation Level, 2025-2035
  • Figure 54: Latin America Machines Attractiveness Analysis by By Automation Level
  • Figure 55: Latin America Machines Value Share and BPS Analysis by By Packaging Format, 2025 and 2035
  • Figure 56: Latin America Machines Y-o-Y Growth Comparison by By Packaging Format, 2025-2035
  • Figure 57: Latin America Machines Attractiveness Analysis by By Packaging Format
  • Figure 58: Latin America Machines Value Share and BPS Analysis by By End-Use Industry, 2025 and 2035
  • Figure 59: Latin America Machines Y-o-Y Growth Comparison by By End-Use Industry, 2025-2035
  • Figure 60: Latin America Machines Attractiveness Analysis by By End-Use Industry
  • Figure 61: Europe Machines Value Share and BPS Analysis by Country, 2025 and 2035
  • Figure 62: Europe Machines Value Share and BPS Analysis by By Machine Type, 2025 and 2035
  • Figure 63: Europe Machines Y-o-Y Growth Comparison by By Machine Type, 2025-2035
  • Figure 64: Europe Machines Attractiveness Analysis by By Machine Type
  • Figure 65: Europe Machines Value Share and BPS Analysis by By Product Type, 2025 and 2035
  • Figure 66: Europe Machines Y-o-Y Growth Comparison by By Product Type, 2025-2035
  • Figure 67: Europe Machines Attractiveness Analysis by By Product Type
  • Figure 68: Europe Machines Value Share and BPS Analysis by By Automation Level, 2025 and 2035
  • Figure 69: Europe Machines Y-o-Y Growth Comparison by By Automation Level, 2025-2035
  • Figure 70: Europe Machines Attractiveness Analysis by By Automation Level
  • Figure 71: Europe Machines Value Share and BPS Analysis by By Packaging Format, 2025 and 2035
  • Figure 72: Europe Machines Y-o-Y Growth Comparison by By Packaging Format, 2025-2035
  • Figure 73: Europe Machines Attractiveness Analysis by By Packaging Format
  • Figure 74: Europe Machines Value Share and BPS Analysis by By End-Use Industry, 2025 and 2035
  • Figure 75: Europe Machines Y-o-Y Growth Comparison by By End-Use Industry, 2025-2035
  • Figure 76: Europe Machines Attractiveness Analysis by By End-Use Industry
  • Figure 77: East Asia Machines Value Share and BPS Analysis by Country, 2025 and 2035
  • Figure 78: East Asia Machines Value Share and BPS Analysis by By Machine Type, 2025 and 2035
  • Figure 79: East Asia Machines Y-o-Y Growth Comparison by By Machine Type, 2025-2035
  • Figure 80: East Asia Machines Attractiveness Analysis by By Machine Type
  • Figure 81: East Asia Machines Value Share and BPS Analysis by By Product Type, 2025 and 2035
  • Figure 82: East Asia Machines Y-o-Y Growth Comparison by By Product Type, 2025-2035
  • Figure 83: East Asia Machines Attractiveness Analysis by By Product Type
  • Figure 84: East Asia Machines Value Share and BPS Analysis by By Automation Level, 2025 and 2035
  • Figure 85: East Asia Machines Y-o-Y Growth Comparison by By Automation Level, 2025-2035
  • Figure 86: East Asia Machines Attractiveness Analysis by By Automation Level
  • Figure 87: East Asia Machines Value Share and BPS Analysis by By Packaging Format, 2025 and 2035
  • Figure 88: East Asia Machines Y-o-Y Growth Comparison by By Packaging Format, 2025-2035
  • Figure 89: East Asia Machines Attractiveness Analysis by By Packaging Format
  • Figure 90: East Asia Machines Value Share and BPS Analysis by By End-Use Industry, 2025 and 2035
  • Figure 91: East Asia Machines Y-o-Y Growth Comparison by By End-Use Industry, 2025-2035
  • Figure 92: East Asia Machines Attractiveness Analysis by By End-Use Industry
  • Figure 93: South Asia Machines Value Share and BPS Analysis by Country, 2025 and 2035
  • Figure 94: South Asia Machines Value Share and BPS Analysis by By Machine Type, 2025 and 2035
  • Figure 95: South Asia Machines Y-o-Y Growth Comparison by By Machine Type, 2025-2035
  • Figure 96: South Asia Machines Attractiveness Analysis by By Machine Type
  • Figure 97: South Asia Machines Value Share and BPS Analysis by By Product Type, 2025 and 2035
  • Figure 98: South Asia Machines Y-o-Y Growth Comparison by By Product Type, 2025-2035
  • Figure 99: South Asia Machines Attractiveness Analysis by By Product Type
  • Figure 100: South Asia Machines Value Share and BPS Analysis by By Automation Level, 2025 and 2035
  • Figure 101: South Asia Machines Y-o-Y Growth Comparison by By Automation Level, 2025-2035
  • Figure 102: South Asia Machines Attractiveness Analysis by By Automation Level
  • Figure 103: South Asia Machines Value Share and BPS Analysis by By Packaging Format, 2025 and 2035
  • Figure 104: South Asia Machines Y-o-Y Growth Comparison by By Packaging Format, 2025-2035
  • Figure 105: South Asia Machines Attractiveness Analysis by By Packaging Format
  • Figure 106: South Asia Machines Value Share and BPS Analysis by By End-Use Industry, 2025 and 2035
  • Figure 107: South Asia Machines Y-o-Y Growth Comparison by By End-Use Industry, 2025-2035
  • Figure 108: South Asia Machines Attractiveness Analysis by By End-Use Industry
  • Figure 109: Oceania Machines Value Share and BPS Analysis by Country, 2025 and 2035
  • Figure 110: Oceania Machines Value Share and BPS Analysis by By Machine Type, 2025 and 2035
  • Figure 111: Oceania Machines Y-o-Y Growth Comparison by By Machine Type, 2025-2035
  • Figure 112: Oceania Machines Attractiveness Analysis by By Machine Type
  • Figure 113: Oceania Machines Value Share and BPS Analysis by By Product Type, 2025 and 2035
  • Figure 114: Oceania Machines Y-o-Y Growth Comparison by By Product Type, 2025-2035
  • Figure 115: Oceania Machines Attractiveness Analysis by By Product Type
  • Figure 116: Oceania Machines Value Share and BPS Analysis by By Automation Level, 2025 and 2035
  • Figure 117: Oceania Machines Y-o-Y Growth Comparison by By Automation Level, 2025-2035
  • Figure 118: Oceania Machines Attractiveness Analysis by By Automation Level
  • Figure 119: Oceania Machines Value Share and BPS Analysis by By Packaging Format, 2025 and 2035
  • Figure 120: Oceania Machines Y-o-Y Growth Comparison by By Packaging Format, 2025-2035
  • Figure 121: Oceania Machines Attractiveness Analysis by By Packaging Format
  • Figure 122: Oceania Machines Value Share and BPS Analysis by By End-Use Industry, 2025 and 2035
  • Figure 123: Oceania Machines Y-o-Y Growth Comparison by By End-Use Industry, 2025-2035
  • Figure 124: Oceania Machines Attractiveness Analysis by By End-Use Industry
  • Figure 125: MEA Machines Value Share and BPS Analysis by Country, 2025 and 2035
  • Figure 126: MEA Machines Value Share and BPS Analysis by By Machine Type, 2025 and 2035
  • Figure 127: MEA Machines Y-o-Y Growth Comparison by By Machine Type, 2025-2035
  • Figure 128: MEA Machines Attractiveness Analysis by By Machine Type
  • Figure 129: MEA Machines Value Share and BPS Analysis by By Product Type, 2025 and 2035
  • Figure 130: MEA Machines Y-o-Y Growth Comparison by By Product Type, 2025-2035
  • Figure 131: MEA Machines Attractiveness Analysis by By Product Type
  • Figure 132: MEA Machines Value Share and BPS Analysis by By Automation Level, 2025 and 2035
  • Figure 133: MEA Machines Y-o-Y Growth Comparison by By Automation Level, 2025-2035
  • Figure 134: MEA Machines Attractiveness Analysis by By Automation Level
  • Figure 135: MEA Machines Value Share and BPS Analysis by By Packaging Format, 2025 and 2035
  • Figure 136: MEA Machines Y-o-Y Growth Comparison by By Packaging Format, 2025-2035
  • Figure 137: MEA Machines Attractiveness Analysis by By Packaging Format
  • Figure 138: MEA Machines Value Share and BPS Analysis by By End-Use Industry, 2025 and 2035
  • Figure 139: MEA Machines Y-o-Y Growth Comparison by By End-Use Industry, 2025-2035
  • Figure 140: MEA Machines Attractiveness Analysis by By End-Use Industry
  • Figure 141: Global Machines - Tier Structure Analysis
  • Figure 142: Global Machines - Company Share Analysis

Frequently Asked Questions

How big is the micro-scale packaging machines market in 2025?

The global micro-scale packaging machines market is estimated to be valued at USD 2.1 billion in 2025.

What will be the size of the micro-scale packaging machines market in 2035?

The market size for the micro-scale packaging machines market is projected to reach USD 4.9 billion by 2035.

How much will be the micro-scale packaging machines market growth between 2025 and 2035?

The micro-scale packaging machines market is expected to grow at a CAGR of 8.8% between 2025 and 2035.

What are the key product types in the micro-scale packaging machines market?

The key product types in the micro-scale packaging machines market include tabletop fillers, manual sealers, semi-automatic pouch fillers, and mini blister packers.

Which equipment segment is expected to contribute significant share in the micro-scale packaging machines market in 2025?

In terms of equipment, the tabletop fillers segment is expected to account for the highest share of 42.6% in the micro-scale packaging machines market in 2025.

Explore Similar Insights

Future Market Insights

Micro-Scale Packaging Machines Market