Microbiome Fiber Supplement Size and Share Forecast Outlook 2025 to 2035

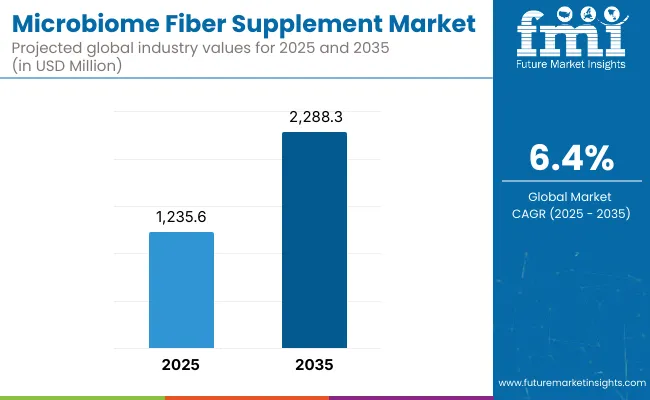
The Microbiome Fiber Supplement Market is projected to be valued at USD 1,235.6 million in 2025 and is forecasted to reach USD 2,288.3 million by 2035. This trajectory represents an incremental gain of USD 1,052.7 million over the decade, reflecting a 6.4% compound annual growth rate (CAGR).
Quick Stats for Microbiome Fiber Supplement

  • Microbiome Fiber Supplement Value (2025): USD 1,235.6 million
  • Microbiome Fiber Supplement Forecast Value (2035): USD 2,288.3 million
  • Microbiome Fiber Supplement Forecast CAGR: 6.4%
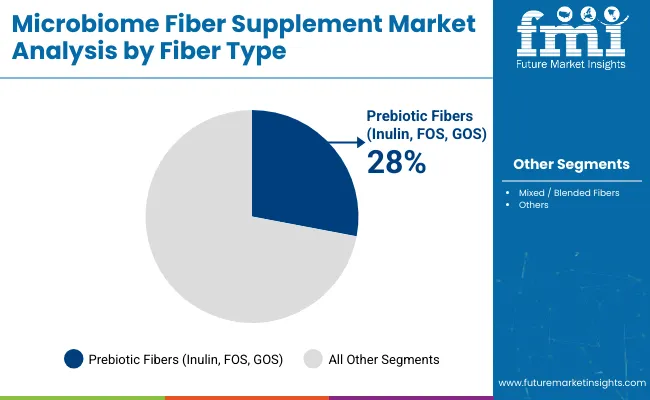
  • Leading Segment in Microbiome Fiber Supplement in 2025, by Fiber Type: Prebiotic Fibers (28%)
  • Key Growth Regions in the Microbiome Fiber Supplement: North America, Asia-Pacific, Europe
  • Top Key Players in Microbiome Fiber Supplement: Cargill, Ingredion, ADM, DuPont (IFF), Roquette, Kerry Group, Tate & Lyle, Beneo, Cosucra, Taiyo International (Sunfiber)

Microbiome Fiber Supplement Market

Microbiome Fiber Supplement Key Takeaways

Metric Value
Estimated Value in (2025E) USD 1,235.6 million
Forecast Value in (2035F) USD 2,288.3 million
Forecast CAGR (2025 to 2035) 6.4%

Market size is expected to nearly double within the forecast period, signaling a strong and sustained appetite for gut-health-centric formulations in the global nutraceutical landscape.

From 2025 to 2030, the market is anticipated to expand from USD 1,235.6 million to approximately USD 1,680.8 million, contributing USD 445.2 million accounting for over 42% of the decade's total growth. This early phase is expected to be driven by steady adoption across functional foods, dietary supplements, and clinical nutrition products.

Consumers are projected to increasingly favor microbiome-supportive ingredients, such as resistant starch, due to their documented prebiotic efficacy and broad formulation compatibility. Demand is anticipated to remain strongest in North America and Western Europe, where microbiome awareness is comparatively high and regulatory standards support transparent claims.

During the second half of the forecast period (2030-2035), market momentum is likely to accelerate further, with an additional USD 607.5 million expected to be added. This accounts for nearly 58% of total growth and reflects growing traction in Asia-Pacific and Latin America.

Expansion is projected to be fueled by innovations in synbiotic formulations, improved clinical substantiation, and increased use of microbiome-targeted fibers in personalized wellness protocols. Overall, a robust and credible growth outlook is anticipated, backed by science-led product development and increasing consumer trust in gut-health-linked solution

From 2020 to 2024, the Microbiome Fiber Supplement Market expanded steadily, supported by growing awareness of gut health, prebiotic efficacy, and preventive nutrition. During this period, leadership was maintained by vertically integrated multinationals, with Cargill, Ingredion, and ADM contributing over 40% of total market revenue. Product innovation focused on high-purity inulin, FOS, and resistant starch, while gummies and powder formats gained favor among health-conscious consumers.

As the market enters 2025, demand is expected to reach USD 1.24 billion, driven by expanding digestive health applications, immune support, and gut-brain axis solutions. By 2035, recurring value is projected to emerge from personalized nutrition, synbiotics, and digital health integration.

The competitive advantage is transitioning from commodity fiber supply to holistic ecosystem offerings that combine ingredient science, validated health claims, and consumer-tailored delivery formats. Niche players specializing in gut-brain cognition, metabolic support, and AI-enabled microbiome personalization are expected to gain market traction, reshaping the competitive dynamics beyond fiber type alone.

Why the Microbiome Fiber Supplement is growing?

The Microbiome Fiber Supplement Market is being propelled by increasing scientific validation of the gut microbiome’s role in systemic health, including immunity, metabolism, and mental well-being. Heightened consumer awareness has been cultivated through educational campaigns and functional claims backed by clinical studies. As dietary fiber deficiencies are increasingly linked to chronic health conditions, demand for microbiome-supportive fibers has been strengthened across preventive and therapeutic nutrition sectors.

Growth has been supported by product innovations tailored for diverse consumer groups, including seniors and health-conscious adults. Customizable formats such as powders, gummies, and functional foods have been introduced to meet evolving preferences for convenience and palatability.

In parallel, sales through online retail and D2C channels have been amplified by personalized wellness platforms and targeted marketing strategies. Regulatory recognition of prebiotic fibers and GRAS (Generally Recognized as Safe) status for key ingredients have further facilitated product development and commercialization. Future demand is expected to be driven by synbiotic formulations and personalized gut-health solutions.

Segmental Analysis

The Microbiome Fiber Supplement Market has been segmented across five key verticals: fiber type, application, product format, sales channel, and end user. This classification allows for a nuanced understanding of how consumer demand, health awareness, and formulation preferences are shaping adoption trends across the microbiome health landscape.By fiber type, segments such as prebiotic fibers, resistant starch, and blended fibers have been positioned as front-runners, driven by clinical efficacy and formulation flexibility.

Application-based segmentation highlights the dominant role of digestive and immune health, while also revealing emerging traction in cognitive and metabolic functions. On the basis of product format, powders, capsules, and gummies are witnessing increased uptake due to convenience, bioavailability, and alignment with personalized nutrition trends. This multi-dimensional segmentation enables market stakeholders to tailor strategies and optimize resource allocation in line with evolving consumer expectations and scientific validation.
Insights into the Fiber Type Segment with Prebiotic Fibers (Inulin, FOS, GOS)Leading in Market Share

Microbiome Fiber Supplement Market By Fiber

Fiber Type Segment Market Value Share, 2025
Prebiotic Fibers (Inulin, FOS, GOS) 28.0%
Mixed / Blended Fibers 15.0%

The prebiotic fiber segment is projected to contribute 28% of the Microbiome Fiber Supplement Market revenue in 2025, establishing its lead in the category. Growth is being supported by mounting clinical evidence linking inulin, FOS, and GOS with enhanced gut microbiota modulation, improved digestion, and immune support.

Increased use of these fibers in powders and functional foods has been facilitated by their compatibility with diverse matrices and minimal sensory impact. As GRAS recognition and EFSA approvals continue to build regulatory confidence, the segment is expected to benefit from cross-functional applications spanning gut-brain axis support and metabolic health. Demand is likely to rise further through integration into synbiotic and personalized wellness platforms.
Insights into the Application Segment with Digestive Health Dominating the Demand

Microbiome Fiber Supplement Market By Application

Application Segment Market Value Share, 2025
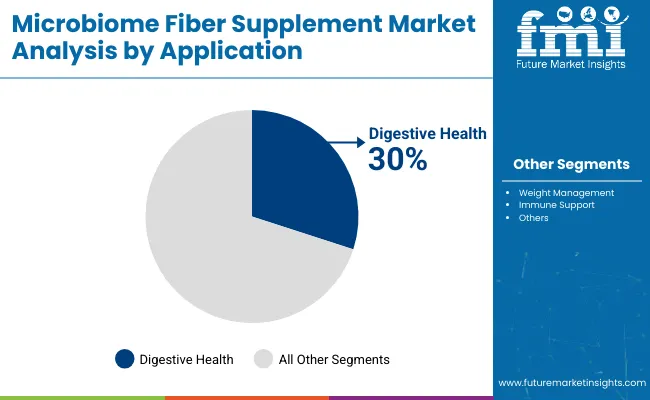
Digestive Health 30.0%
Weight Management 18.0%
Immune Support 15.0%

Digestive health is anticipated to account for 30% of the market share in 2025, underscoring its status as the leading application segment. Growth in this domain is being reinforced by heightened consumer focus on gastrointestinal well-being, fueled by rising diagnoses of IBS, bloating, and dysbiosis. Microbiome-supportive fibers are being increasingly recognized as frontline solutions for maintaining digestive balance, with product uptake observed across general adult and senior demographics.

Weight management and immune support applications are also experiencing acceleration due to converging consumer needs for holistic, non-pharmacological solutions. Scientific messaging that links fiber intake with enhanced nutrient absorption and inflammation modulation is expected to further elevate the role of digestive health in product positioning.
Insights into the Product Form Segment with Focus on Pharmaceutical Grade

Microbiome Fiber Supplement Market By Product

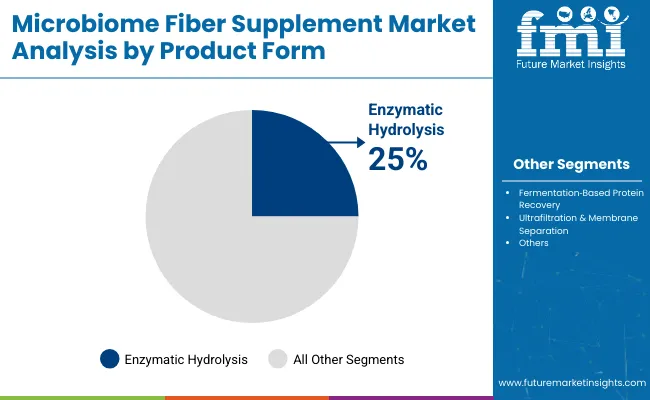
Product Form Segment Market Value Share, 2025
Powders 35.0%
Capsules & Tablets 20.0%
Gummies 15.0%

The powder format is expected to represent 35% of market value in 2025, emerging as the most dominant product segment. This leadership is being enabled by high dosing flexibility, ease of integration into daily routines, and suitability for custom nutrient blends. Manufacturers are prioritizing flavor masking and solubility improvements to enhance consumer compliance.

Capsules and tablets remain preferred for standardized dosing and convenience, particularly in pharmaceutical retail channels. Meanwhile, gummies have been positioned as a rapidly expanding format, particularly among younger and health-conscious consumers. Their palatable delivery, combined with evolving clean-label formulations, is projected to strengthen adoption in the wellness and lifestyle nutrition categories.

What are the Drivers, Restraints, and Key Trends of the Microbiome Fiber Supplement?

Regulatory sensitivity and source authenticity concerns continue to challenge wider adoption of Microbiome Fiber Supplement, even as demand accelerates across cognitive health, neurological therapy, and cosmetic formulations. Technological refinement and bioactivity validation remain central to unlocking mainstream integration across global supplement and medical markets.

Rising Demand for Neuroprotective and Nootropic Ingredients in Preventive Healthcare

Growing awareness of neurodegenerative disorders and mental performance optimization has fueled demand for naturally sourced nootropic compounds. Microbiome Fiber Supplement has been increasingly positioned as a valuable source of phosphatidylserine, sphingolipids, and neuroactive peptides compounds known to support cognitive resilience, memory retention, and synaptic repair.

The ingredient’s origin in organ-specific bioactivity has aligned with evolving consumer preferences for targeted, nature-derived solutions in brain health. Supplement manufacturers have responded by launching standardized formulations for daily cognitive support, particularly in aging populations and knowledge-driven workforce segments. As preventive neurology continues to be prioritized in both clinical and wellness sectors, demand for such specialized ingredients is expected to remain resilient.

Ethical, Religious, and Regulatory Scrutiny Over Animal-Derived Neuroextracts

Despite functional efficacy, adoption has been hindered by regulatory ambiguity and consumer hesitancy surrounding animal organ extracts, particularly those sourced from bovine neurological tissue. Concerns related to disease transmission (e.g., prion risks), ethical considerations, and religious dietary laws have led to cautious policy environments in several markets.

Product approvals often require exhaustive traceability, purification, and GMP certification, increasing entry barriers for new players. In religiously sensitive regions, demand remains restricted, and plant-based cognitive alternatives are being preferred. As clean-label and ethical sourcing pressures intensify, only rigorously controlled, transparently labeled bovine extracts are expected to gain regulatory and consumer acceptance.
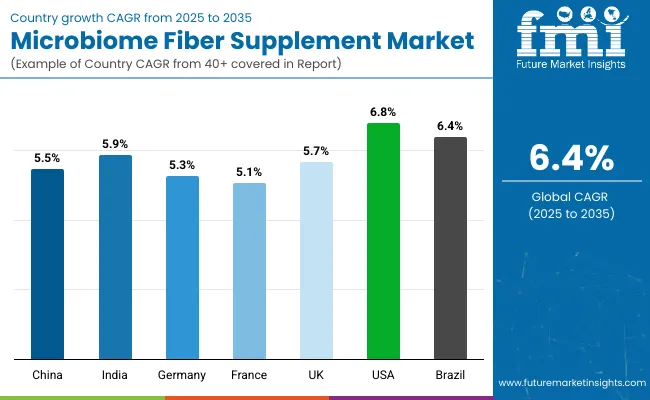
Analysis of Microbiome Fiber Supplementby Key Countries

Microbiome Fiber Supplement Market By Country

Countries CAGR
China 5.5%
India 5.9%
Germany 5.3%
France 5.1%
UK 5.7%
USA 6.8%
Brazil 6.4%

The global Microbiome Fiber Supplement Market is projected to exhibit differentiated growth patterns across key countries, shaped by regulatory support, public health priorities, and consumer awareness of microbiome-linked wellness. The United States is anticipated to lead growth among developed economies, with a CAGR of 6.8% through 2035. This expansion is expected to be supported by high functional food penetration, established D2C wellness brands, and growing integration of personalized gut health solutions in clinical and lifestyle contexts.

China, with a CAGR of 5.5%, is expected to benefit from expanding middle-class consumption, increasing focus on preventative nutrition, and the progressive localization of prebiotic ingredient production. In India, a stronger CAGR of 5.9% is projected, driven by rising urban health consciousness, government nutrition campaigns, and a shift toward fiber-enriched diets in metabolic health management.

Germany (5.3%), the UK (5.7%), and France (5.1%) are anticipated to maintain consistent growth, supported by EFSA-backed ingredient approvals, gut health education, and the inclusion of microbiome fibers in nutraceutical and functional food portfolios. Meanwhile, Brazil is projected to advance at 6.4% CAGR, attributed to rising prevalence of digestive health disorders and an expanding retail base for natural supplements.

Sales Outlook for Microbiome Fiber Supplement in the United States

Years 2025 2026 2027 2028 2029 2030 2031 2032 2033 2034 2035
USA Microbiome Fiber Supplement 296.5 316.8 334.4 354.2 377.9 401.4 423.0 447.1 471.8 503.8 532.7

The Microbiome Fiber Supplement Market in the United States is projected to grow at a CAGR of 6.8% from 2025 to 2035. This expansion is being driven by a convergence of personalized nutrition trends, digital wellness integration, and increased clinical awareness of gut-health interventions. USA consumers are progressively adopting microbiome-supportive fibers not only for digestive health but also for cognitive function, metabolic regulation, and immune resilience.

The healthcare and lifestyle nutrition sectors have been actively integrating microbiome solutions into patient-centric and performance-focused regimens. Growing traction has been observed among aging populations and wellness-oriented millennials, particularly through D2C platforms and personalized supplement subscriptions.

Gummy and powder-based formats have gained visibility due to higher compliance and convenience. Meanwhile, digital health ecosystems have enabled precision fiber recommendations via microbiome testing, further strengthening consumer engagement and repeat purchases.

  • Health-conscious adults and seniors are driving demand for synbiotic and targeted fiber supplements.
  • D2C and online retail are increasingly favored, owing to convenience, transparency, and customization.

Continued innovation in formulation and delivery methods is expected to support long-term market maturity and consumer loyalty in the USA market.

Growth and Expansion Outlook for Microbiome Fiber Supplement in the United Kingdom

The Microbiome Fiber Supplement Market in the United Kingdom is projected to grow at a CAGR of 5.7% between 2025 and 2035. Market expansion is expected to be supported by high consumer awareness, a robust dietary supplement culture, and NHS-backed gut health initiatives. British consumers are becoming more responsive to clinically validated fibers as part of lifestyle interventions for IBS, immunity, and mental health.

The growing interest in the gut-brain axis and mood regulation through microbiome pathways is likely to further reinforce demand. Distribution through pharmacies and nutrition chains is being enhanced by transparent labeling and EFSA-compliant claims.

  • Prebiotic blends and functional beverages are gaining popularity among young adults.
  • Mental wellness positioning is driving innovation in gut-brain axis formulations.
  • Growth is supported by sustainability preferences and plant-based ingredient demand.
  • Pharmacies and health retailers remain core channels, supplemented by online expansion.

Growth and Expansion Outlook for Microbiome Fiber Supplement in India

The Indian Microbiome Fiber Supplement Market is anticipated to expand at a CAGR of 5.9% from 2025 to 2035. Growth is being fueled by rapid urbanization, increasing dietary awareness, and the rising burden of lifestyle disorders like diabetes, obesity, and IBS. Government campaigns on digestive health and fiber-enriched diets have improved public engagement with gut wellness solutions.

Ayurvedic and natural positioning of microbiome-supportive fibers is being promoted by domestic players, enhancing acceptance among traditionally health-conscious consumers. Retail expansion in Tier 2 and Tier 3 cities is also contributing to increased accessibility.

  • Resistant starch and mixed fibers are favored in functional blends for metabolic health.
  • Personalized supplements and sachet-based powders are gaining traction.
  • Domestic nutraceutical firms are expanding distribution through digital platforms.
  • Preventive healthcare awareness is strengthening uptake among middle-income groups.

Sales Outlook for Microbiome Fiber Supplementin China

The Microbiome Fiber Supplement Market in China is expected to witness a CAGR of 5.5% from 2025 to 2035, driven by a convergence of preventive healthcare priorities, digital health ecosystems, and middle-class wellness expenditure. National nutrition plans and consumer education on gut health are actively promoting fiber-rich product adoption.

Local innovation in synbiotic supplements, coupled with premium product positioning, is enabling sustained interest in microbiome solutions. Integration into traditional Chinese health frameworks is further legitimizing category growth.

  • Premium D2C brands are leveraging AI-based gut health assessments for tailored fiber products.
  • Prebiotic and immune-enhancing blends are in high demand for family health positioning.
  • Urban consumers are seeking clean-label, plant-based ingredients with traceable sourcing.
  • Health tech integration is facilitating direct consumer engagement and education.

In-depth Analysis of Microbiome Fiber Supplementin Europe

Countries 2025 2035
UK 19.1% 19.7%
Germany 21.4% 20.4%
Italy 9.1% 11.9%
France 12.7% 13.4%
Spain 9.4% 9.8%
BENELUX 6.4% 5.6%
Nordic 5.8% 5.1%
Rest of Europe 16.1% 14.1%

Germany’s Microbiome Fiber Supplement Market is projected to grow at a CAGR of 5.3% through 2035, backed by high regulatory clarity, functional food penetration, and demand for clean-label health products. German consumers are particularly responsive to EFSA-approved claims and clinical substantiation, positioning the market for quality-led growth.

Adoption is being reinforced through integration into lifestyle wellness regimes and physician-recommended formulations for digestive and cardiovascular support. Sales are expected to remain strong in pharmacy and organic retail channels, with rising online activity.

  • Prebiotic powders and capsules are preferred formats due to dosage control and formulation trust.
  • Elderly consumers are driving demand for gut-health solutions tied to immune resilience.
  • Domestic brands are focusing on fiber combinations with added mental wellness benefits.
  • Regulatory harmonization and eco-conscious sourcing are supporting consumer confidence.

Growth Outlook for Microbiome Fiber Supplement in Japan

Fiber Type Segment Market Value Share, 2025
Prebiotic Fibers (Inulin, FOS, GOS) 30.0%
Resistant Starch 9.0%
Beta Glucan 12.0%
Pectin 10.0%
Psyllium Husk 7.0%
Arabinoxylan 6.0%
Cellulose & Hemicellulose 11.0%
Mixed / Blended Fibers 15.0%

The Microbiome Fiber Supplement Market in Japan is projected to witness steady expansion through 2035, supported by the country’s aging population, preventive healthcare culture, and longstanding consumer familiarity with dietary fiber. In 2025, prebiotic fibers are expected to command 30% of market share, followed by mixed/blended fibers at 15% and beta-glucan at 12%, indicating a consumer preference for multi-functional, clinically backed ingredients.

Growth in the Japanese market is anticipated to be driven by demand for immune and metabolic health support, with specific focus on formulations that target digestive balance and cognitive well-being. The cultural alignment with gut-health through traditional dietary practices such as fermented foods has set a favorable foundation for microbiome-focused supplementation.

  • The Japanese market is expected to represent a significant portion of APAC fiber supplement revenue in 2025.
  • Prebiotic fibers, including inulin and GOS, continue to lead due to scientific substantiation and palatability.
  • Blended fiber formulations are gaining traction for their synergistic health effects and ease of integration into beverages and foods.
  • Growth is supported by Japan’s aging demographic and the preference for natural, non-pharmacological health solutions.

Opportunity Analysis of South Korea Microbiome Fiber Supplement

Application Segment Market Value Share, 2025
Digestive Health 32.0%
Immune Support 16.0%
Metabolic Health 12.0%
Weight Management 17.0%
Cardiovascular Health 14.0%
Gut Brain Axis Support 9.0%

South Korea’s Microbiome Fiber Supplement Market is projected to experience strong growth through 2035, driven by increasing public interest in gut health, K-wellness trends, and functional food innovation. In 2025, digestive health is expected to dominate with 32% share, followed by weight management at 17%, and immune support at 16%, indicating a broadening of consumer priorities beyond traditional digestive concerns.

South Korean consumers have demonstrated high receptivity to scientifically backed, aesthetically packaged wellness products. Demand for gut-brain axis support, growing at a CAGR of 9.2%, reflects increasing consumer focus on mood, stress resilience, and mental clarity. Integration of fibers into RTD beverages, yogurts, and meal replacements is being supported by domestic brands leveraging functional claims.
  • Digestive and metabolic health continue to anchor consumer demand, especially among working professionals and aging populations.
  • Synbiotic formulations are being adopted for their multifunctional appeal and compatibility with Korean dietary patterns.
  • Gut-brain axis support is emerging as a premium segment, driven by tech-savvy wellness consumers.
  • Local nutraceutical brands are expected to lead innovation through convenience-based delivery formats and personalized gut-health diagnostics.

Competitive Landscape of Microbiome Fiber Supplement

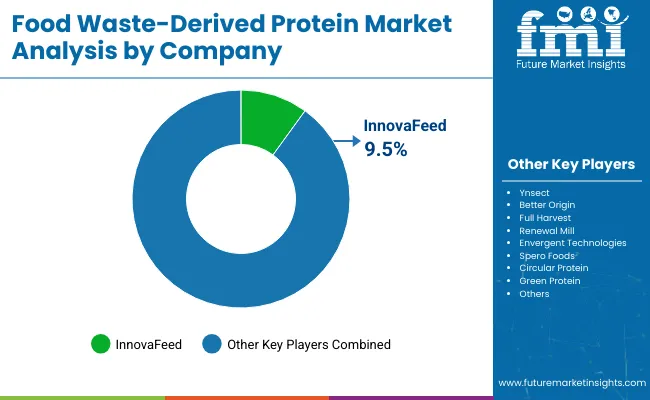
Food Waste Derived Protein Market By Company

Giants Global Value Share 2025
Cargill, Inc. 9.6%
Others 90.4%

The Microbiome Fiber Supplement Market is moderately fragmented, with global leaders, mid-sized innovators, and niche-focused players competing across functional nutrition and health-specific applications. Multinational giants such as Cargill, Ingredion, and ADM hold significant market positions through vertically integrated production, robust global supply chains, and R&D-backed formulation capabilities. Their focus has been placed on clinically validated prebiotic fibers such as inulin, GOS, and resistant starch, tailored for digestive, metabolic, and cognitive health applications.

Companies like Tate & Lyle, Kerry Group, and Roquette are expanding through portfolio diversification and regional customization. Their strategies are being shaped by partnerships with food and nutraceutical brands, allowing for co-developed products in functional beverages, gummies, and powders. These mid-sized players have emphasized clean-label innovation and plant-based sourcing to enhance market credibility.

Specialist suppliers such as Beneo, Cosucra, and Taiyo (Sunfiber) cater to high-purity, application-specific formulations, with growing relevance in gut-brain axis and immune support segments. These players differentiate through traceable sourcing, regional regulatory alignment, and compatibility with synbiotic platforms.

Competitive advantage is now shifting toward integrated ecosystems combining ingredient science, digital personalization, and targeted health positioning. Future leadership will be defined by capacity to scale clinically backed ingredients while adapting to consumer-centric trends like precision nutrition, transparency, and sustainable sourcing.

Key Developments in Microbiome Fiber Supplement

  • In April 2025, Ingredion introduced NOVELOSE™ RS4 resistant starch across North America, targeting digestive and glycemic health. Positioned for microbiome support, the new ingredient enables clean-label claims in bars, bakery, and supplements, supporting growing demand for clinically validated fibers with dual benefits in gut and metabolic health.
  • In February 2025, Beneo announced the expansion of its chicory root fiber facility in Pemuco, Chile. The move aims to meet rising global demand for inulin and oligofructose as microbiome-targeted ingredients, enhancing the company’s supply resilience and reinforcing its leadership in natural prebiotic fiber solutions.

Scope of the Report

Item Value
Quantitative Units USD 1,235.6 Million
Fiber Type Prebiotic Fibers (Inulin, FOS, GOS), Resistant Starch, Beta ‑ Glucan, Pectin, Psyllium Husk, Arabinoxylan, Cellulose & Hemicellulose, Mixed/Blended Fibers
Application Digestive Health, Immune Support, Metabolic Health, Weight Management, Cardiovascular Health, Gut-Brain Axis Support
Product Form Powders, Capsules & Tablets, Gummies, Ready-to-Drink Beverages, Functional Foods
End User General Adults, Seniors, Patients with Digestive Disorders, Health-Conscious Consumers
Sales Channel Pharmacies & Drugstores, Health & Nutrition Stores, Online Retail, Supermarkets & Hypermarkets, Direct-to-Consumer (D2C)
Regions Covered North America, Europe, Asia-Pacific, Latin America, Middle East & Africa
Country Covered United States, Canada, Germany, France, United Kingdom, China, Japan, India, Brazil, South Africa
Key Companies Profiled Cargill, Ingredion, DuPont (IFF Health), ADM, Tate & Lyle, Kerry Group, Roquette, Beneo, Cosucra, Taiyo International (Sunfiber)
Additional Attributes Global dollar sales by fiber type and application, shift toward prebiotic blends and gut-brain formulations, expansion in D2C and online retail, increasing role of synbiotics, aging population trends, innovation in fiber combinations, regional regulatory drivers, personaliza tion via microbiome diagnostics

Key Segments

By Fiber Type:

  • Prebiotic Fibers
  • Resistant Starch
  • Beta-Glucan
  • Pectin
  • Psyllium Husk
  • Arabinoxylan
  • Cellulose & Hemicellulose
  • Mixed/Blended Fibers

By Application:

  • Digestive Health
  • Immune Support
  • Metabolic Health
  • Weight Management
  • Cardiovascular Health
  • Gut-Brain Axis Support

By Product Format:

  • Powders
  • Capsules & Tablets
  • Gummies
  • Ready-to-Drink Beverages
  • Functional Foods

By Sales Channel:

  • Pharmacies & Drugstores
  • Health & Nutrition Stores
  • Online Retail
  • Supermarkets & Hypermarkets
  • Direct-to-Consumer (D2C)

By End User:

  • General Adults
  • Patients with Digestive Disorders
  • Health-Conscious Consumers

By Region:

  • North America
  • Latin America
  • Europe
  • East Asia
  • South Asia & Pacific
  • Middle East and Africa

Table of Content

  1. Executive Summary
    • Global Market Outlook
    • Demand-side Trends
    • Supply-side Trends
    • Technology Roadmap Analysis
    • Analysis and Recommendations
  2. Market Overview
    • Market Coverage / Taxonomy
    • Market Definition / Scope / Limitations
  3. Market Background
    • Market Dynamics
      • Drivers
      • Restraints
      • Opportunity
      • Trends
    • Scenario Forecast
      • Demand in Optimistic Scenario
      • Demand in Likely Scenario
      • Demand in Conservative Scenario
    • Opportunity Map Analysis
    • Product Life Cycle Analysis
    • Supply Chain Analysis
    • Investment Feasibility Matrix
    • Value Chain Analysis
    • PESTLE and Porter’s Analysis
    • Regulatory Landscape
    • Regional Parent Market Outlook
    • Production and Consumption Statistics
    • Import and Export Statistics
  4. Global Market Analysis 2020 to 2024 and Forecast, 2025 to 2035
    • Historical Market Size Value (USD Million) & Volume (Units) Analysis, 2020 to 2024
    • Current and Future Market Size Value (USD Million) & Volume (Units) Projections, 2025 to 2035
      • Y-o-Y Growth Trend Analysis
      • Absolute $ Opportunity Analysis
  5. Global Market Pricing Analysis 2020 to 2024 and Forecast 2025 to 2035
  6. Global Market Analysis 2020 to 2024 and Forecast 2025 to 2035, By Fiber Type
    • Introduction / Key Findings
    • Historical Market Size Value (USD Million) & Volume (Units) Analysis By Fiber Type, 2020 to 2024
    • Current and Future Market Size Value (USD Million) & Volume (Units) Analysis and Forecast By Fiber Type, 2025 to 2035
      • Prebiotic Fibers
      • Resistant Starch
      • Beta-Glucan
      • Pectin
      • Psyllium Husk
      • Arabinoxylan
      • Cellulose & Hemicellulose
      • Mixed/Blended Fibers
    • Y-o-Y Growth Trend Analysis By Fiber Type, 2020 to 2024
    • Absolute $ Opportunity Analysis By Fiber Type, 2025 to 2035
  7. Global Market Analysis 2020 to 2024 and Forecast 2025 to 2035, By Application
    • Introduction / Key Findings
    • Historical Market Size Value (USD Million) & Volume (Units) Analysis By Application, 2020 to 2024
    • Current and Future Market Size Value (USD Million) & Volume (Units) Analysis and Forecast By Application, 2025 to 2035
      • Digestive Health
      • Immune Support
      • Metabolic Health
      • Weight Management
      • Cardiovascular Health
      • Gut-Brain Axis Support
    • Y-o-Y Growth Trend Analysis By Application, 2020 to 2024
    • Absolute $ Opportunity Analysis By Application, 2025 to 2035
  8. Global Market Analysis 2020 to 2024 and Forecast 2025 to 2035, By Product Format
    • Introduction / Key Findings
    • Historical Market Size Value (USD Million) & Volume (Units) Analysis By Product Format, 2020 to 2024
    • Current and Future Market Size Value (USD Million) & Volume (Units) Analysis and Forecast By Product Format, 2025 to 2035
      • Powders
      • Capsules & Tablets
      • Gummies
      • Ready-to-Drink Beverages
      • Functional Foods
    • Y-o-Y Growth Trend Analysis By Product Format, 2020 to 2024
    • Absolute $ Opportunity Analysis By Product Format, 2025 to 2035
  9. Global Market Analysis 2020 to 2024 and Forecast 2025 to 2035, By Sales Channel
    • Introduction / Key Findings
    • Historical Market Size Value (USD Million) & Volume (Units) Analysis By Sales Channel, 2020 to 2024
    • Current and Future Market Size Value (USD Million) & Volume (Units) Analysis and Forecast By Sales Channel, 2025 to 2035
      • Pharmacies & Drugstores
      • Health & Nutrition Stores
      • Online Retail
      • Supermarkets & Hypermarkets
      • Direct-to-Consumer (D2C)
    • Y-o-Y Growth Trend Analysis By Sales Channel, 2020 to 2024
    • Absolute $ Opportunity Analysis By Sales Channel, 2025 to 2035
  10. Global Market Analysis 2020 to 2024 and Forecast 2025 to 2035, By End User
    • Introduction / Key Findings
    • Historical Market Size Value (USD Million) & Volume (Units) Analysis By End User, 2020 to 2024
    • Current and Future Market Size Value (USD Million) & Volume (Units) Analysis and Forecast By End User, 2025 to 2035
      • General Adults
      • Patients with Digestive Disorders
      • Health-Conscious Consumers
    • Y-o-Y Growth Trend Analysis By End User, 2020 to 2024
    • Absolute $ Opportunity Analysis By End User, 2025 to 2035
  11. Global Market Analysis 2020 to 2024 and Forecast 2025 to 2035, By Region
    • Introduction
    • Historical Market Size Value (USD Million) & Volume (Units) Analysis By Region, 2020 to 2024
    • Current Market Size Value (USD Million) & Volume (Units) Analysis and Forecast By Region, 2025 to 2035
      • North America
      • Latin America
      • Europe
      • East Asia
      • South Asia & Pacific
      • Middle East and Africa
    • Market Attractiveness Analysis By Region
  12. North America Market Analysis 2020 to 2024 and Forecast 2025 to 2035, By Country
    • Historical Market Size Value (USD Million) & Volume (Units) Trend Analysis By Market Taxonomy, 2020 to 2024
    • Market Size Value (USD Million) & Volume (Units) Forecast By Market Taxonomy, 2025 to 2035
      • By Country
        • USA
        • Canada
      • By Fiber Type
      • By Application
      • By Product Format
      • By Sales Channel
      • By End User
    • Market Attractiveness Analysis
      • By Country
      • By Fiber Type
      • By Application
      • By Product Format
      • By Sales Channel
      • By End User
    • Key Takeaways
  13. Latin America Market Analysis 2020 to 2024 and Forecast 2025 to 2035, By Country
    • Historical Market Size Value (USD Million) & Volume (Units) Trend Analysis By Market Taxonomy, 2020 to 2024
    • Market Size Value (USD Million) & Volume (Units) Forecast By Market Taxonomy, 2025 to 2035
      • By Country
        • Brazil
        • Mexico
        • Colombia
        • Rest of Latin America
      • By Fiber Type
      • By Application
      • By Product Format
      • By Sales Channel
      • By End User
    • Market Attractiveness Analysis
      • By Country
      • By Fiber Type
      • By Application
      • By Product Format
      • By Sales Channel
      • By End User
    • Key Takeaways
  14. Europe Market Analysis 2020 to 2024 and Forecast 2025 to 2035, By Country
    • Historical Market Size Value (USD Million) & Volume (Units) Trend Analysis By Market Taxonomy, 2020 to 2024
    • Market Size Value (USD Million) & Volume (Units) Forecast By Market Taxonomy, 2025 to 2035
      • By Country
        • Germany
        • UK
        • France
        • Italy
        • Spain
        • Belgium
        • Netherlands
        • Nordic
        • Switzerland
        • Russia
        • Poland
        • Rest of Europe
      • By Fiber Type
      • By Application
      • By Product Format
      • By Sales Channel
      • By End User
    • Market Attractiveness Analysis
      • By Country
      • By Fiber Type
      • By Application
      • By Product Format
      • By Sales Channel
      • By End User
    • Key Takeaways
  15. East Asia Market Analysis 2020 to 2024 and Forecast 2025 to 2035, By Country
    • Historical Market Size Value (USD Million) & Volume (Units) Trend Analysis By Market Taxonomy, 2020 to 2024
    • Market Size Value (USD Million) & Volume (Units) Forecast By Market Taxonomy, 2025 to 2035
      • By Country
        • China
        • Japan
        • South Korea
      • By Fiber Type
      • By Application
      • By Product Format
      • By Sales Channel
      • By End User
    • Market Attractiveness Analysis
      • By Country
      • By Fiber Type
      • By Application
      • By Product Format
      • By Sales Channel
      • By End User
    • Key Takeaways
  16. South Asia & Pacific Market Analysis 2020 to 2024 and Forecast 2025 to 2035, By Country
    • Historical Market Size Value (USD Million) & Volume (Units) Trend Analysis By Market Taxonomy, 2020 to 2024
    • Market Size Value (USD Million) & Volume (Units) Forecast By Market Taxonomy, 2025 to 2035
      • By Country
        • India
        • Thailand
        • Malaysia
        • Indonesia
        • Singapore
        • Vietnam
        • Australia
        • New Zealand
        • Rest of South Asia & Pacific
      • By Fiber Type
      • By Application
      • By Product Format
      • By Sales Channel
      • By End User
    • Market Attractiveness Analysis
      • By Country
      • By Fiber Type
      • By Application
      • By Product Format
      • By Sales Channel
      • By End User
    • Key Takeaways
  17. Middle East and Africa Market Analysis 2020 to 2024 and Forecast 2025 to 2035, By Country
    • Historical Market Size Value (USD Million) & Volume (Units) Trend Analysis By Market Taxonomy, 2020 to 2024
    • Market Size Value (USD Million) & Volume (Units) Forecast By Market Taxonomy, 2025 to 2035
      • By Country
        • Turkey
        • UAE
        • Saudi Arabia
        • Israel
        • Other GCC Countries
        • North Africa
        • South Africa
      • By Fiber Type
      • By Application
      • By Product Format
      • By Sales Channel
      • By End User
    • Market Attractiveness Analysis
      • By Country
      • By Fiber Type
      • By Application
      • By Product Format
      • By Sales Channel
      • By End User
    • Key Takeaways
  18. Key Countries Market Analysis
    • U.S
      • Pricing Analysis
      • Market Share Analysis, 2024
        • By Fiber Type
        • By Application
        • By Product Format
        • By Sales Channel
        • By End User
    • Canada
      • Pricing Analysis
      • Market Share Analysis, 2024
        • By Fiber Type
        • By Application
        • By Product Format
        • By Sales Channel
        • By End User
    • Brazil
      • Pricing Analysis
      • Market Share Analysis, 2024
        • By Fiber Type
        • By Application
        • By Product Format
        • By Sales Channel
        • By End User
    • Mexico
      • Pricing Analysis
      • Market Share Analysis, 2024
        • By Fiber Type
        • By Application
        • By Product Format
        • By Sales Channel
        • By End User
    • Germany
      • Pricing Analysis
      • Market Share Analysis, 2024
        • By Fiber Type
        • By Application
        • By Product Format
        • By Sales Channel
        • By End User
    • UK
      • Pricing Analysis
      • Market Share Analysis, 2024
        • By Fiber Type
        • By Application
        • By Product Format
        • By Sales Channel
        • By End User
    • France
      • Pricing Analysis
      • Market Share Analysis, 2024
        • By Fiber Type
        • By Application
        • By Product Format
        • By Sales Channel
        • By End User
    • Italy
      • Pricing Analysis
      • Market Share Analysis, 2024
        • By Fiber Type
        • By Application
        • By Product Format
        • By Sales Channel
        • By End User
    • Spain
      • Pricing Analysis
      • Market Share Analysis, 2024
        • By Fiber Type
        • By Application
        • By Product Format
        • By Sales Channel
        • By End User
    • Belgium
      • Pricing Analysis
      • Market Share Analysis, 2024
        • By Fiber Type
        • By Application
        • By Product Format
        • By Sales Channel
        • By End User
    • Netherlands
      • Pricing Analysis
      • Market Share Analysis, 2024
        • By Fiber Type
        • By Application
        • By Product Format
        • By Sales Channel
        • By End User
    • Nordic
      • Pricing Analysis
      • Market Share Analysis, 2024
        • By Fiber Type
        • By Application
        • By Product Format
        • By Sales Channel
        • By End User
    • Switzerland
      • Pricing Analysis
      • Market Share Analysis, 2024
        • By Fiber Type
        • By Application
        • By Product Format
        • By Sales Channel
        • By End User
    • Russia
      • Pricing Analysis
      • Market Share Analysis, 2024
        • By Fiber Type
        • By Application
        • By Product Format
        • By Sales Channel
        • By End User
    • Poland
      • Pricing Analysis
      • Market Share Analysis, 2024
        • By Fiber Type
        • By Application
        • By Product Format
        • By Sales Channel
        • By End User
    • China
      • Pricing Analysis
      • Market Share Analysis, 2024
        • By Fiber Type
        • By Application
        • By Product Format
        • By Sales Channel
        • By End User
    • Japan
      • Pricing Analysis
      • Market Share Analysis, 2024
        • By Fiber Type
        • By Application
        • By Product Format
        • By Sales Channel
        • By End User
    • South Korea
      • Pricing Analysis
      • Market Share Analysis, 2024
        • By Fiber Type
        • By Application
        • By Product Format
        • By Sales Channel
        • By End User
    • India
      • Pricing Analysis
      • Market Share Analysis, 2024
        • By Fiber Type
        • By Application
        • By Product Format
        • By Sales Channel
        • By End User
    • Thailand
      • Pricing Analysis
      • Market Share Analysis, 2024
        • By Fiber Type
        • By Application
        • By Product Format
        • By Sales Channel
        • By End User
    • Malaysia
      • Pricing Analysis
      • Market Share Analysis, 2024
        • By Fiber Type
        • By Application
        • By Product Format
        • By Sales Channel
        • By End User
    • Indonesia
      • Pricing Analysis
      • Market Share Analysis, 2024
        • By Fiber Type
        • By Application
        • By Product Format
        • By Sales Channel
        • By End User
    • Singapore
      • Pricing Analysis
      • Market Share Analysis, 2024
        • By Fiber Type
        • By Application
        • By Product Format
        • By Sales Channel
        • By End User
    • Vietnam
      • Pricing Analysis
      • Market Share Analysis, 2024
        • By Fiber Type
        • By Application
        • By Product Format
        • By Sales Channel
        • By End User
    • Australia
      • Pricing Analysis
      • Market Share Analysis, 2024
        • By Fiber Type
        • By Application
        • By Product Format
        • By Sales Channel
        • By End User
    • New Zealand
      • Pricing Analysis
      • Market Share Analysis, 2024
        • By Fiber Type
        • By Application
        • By Product Format
        • By Sales Channel
        • By End User
    • Turkey
      • Pricing Analysis
      • Market Share Analysis, 2024
        • By Fiber Type
        • By Application
        • By Product Format
        • By Sales Channel
        • By End User
    • UAE
      • Pricing Analysis
      • Market Share Analysis, 2024
        • By Fiber Type
        • By Application
        • By Product Format
        • By Sales Channel
        • By End User
    • Saudi Arabia
      • Pricing Analysis
      • Market Share Analysis, 2024
        • By Fiber Type
        • By Application
        • By Product Format
        • By Sales Channel
        • By End User
    • Israel
      • Pricing Analysis
      • Market Share Analysis, 2024
        • By Fiber Type
        • By Application
        • By Product Format
        • By Sales Channel
        • By End User
  19. Market Structure Analysis
    • Competition Dashboard
    • Competition Benchmarking
    • Market Share Analysis of Top Players
      • By Regional
      • By Fiber Type
      • By Application
      • By Product Format
      • By Sales Channel
      • By End User
  20. Competition Analysis
    • Competition Deep Dive
      • Cargill, Incorporated
        • Overview
        • Product Portfolio
        • Profitability by Market Segments (Product/Age /Sales Channel/Region)
        • Sales Footprint
        • Strategy Overview
        • Ingredion Incorporated
        • DuPont Nutrition & Health
        • ADM (Archer Daniels Midland)
        • Tate & Lyle PLC
        • Kerry Group
        • Roquette Frères
        • Beneo GmbH
        • Cosucra Groupe Warcoing
        • Sunfiber (Taiyo International)
    • Assumptions & Acronyms Used
    • Research Methodology

List of Tables

  • Table 1: Global Market Value (USD Million) Forecast by Region, 2020-2035
  • Table 2: Global Market Volume (Units) Forecast by Region, 2020-2035
  • Table 3: Global Market Value (USD Million) Forecast by Fiber Type, 2020-2035
  • Table 4: Global Market Volume (Units) Forecast by Fiber Type, 2020-2035
  • Table 5: Global Market Value (USD Million) Forecast by Application, 2020-2035
  • Table 6: Global Market Volume (Units) Forecast by Application, 2020-2035
  • Table 7: Global Market Value (USD Million) Forecast by Product Format, 2020-2035
  • Table 8: Global Market Volume (Units) Forecast by Product Format, 2020-2035
  • Table 9: Global Market Value (USD Million) Forecast by End User, 2020-2035
  • Table 10: Global Market Volume (Units) Forecast by End User, 2020-2035
  • Table 11: Global Market Value (USD Million) Forecast by Sales Channel, 2020-2035
  • Table 12: Global Market Volume (Units) Forecast by Sales Channel, 2020-2035
  • Table 13: North America Market Value (USD Million) Forecast by Country, 2020-2035
  • Table 14: North America Market Volume (Units) Forecast by Country, 2020-2035
  • Table 15: North America Market Value (USD Million) Forecast by Fiber Type, 2020-2035
  • Table 16: North America Market Volume (Units) Forecast by Fiber Type, 2020-2035
  • Table 17: North America Market Value (USD Million) Forecast by Application, 2020-2035
  • Table 18: North America Market Volume (Units) Forecast by Application, 2020-2035
  • Table 19: North America Market Value (USD Million) Forecast by Product Format, 2020-2035
  • Table 20: North America Market Volume (Units) Forecast by Product Format, 2020-2035
  • Table 21: North America Market Value (USD Million) Forecast by End User, 2020-2035
  • Table 22: North America Market Volume (Units) Forecast by End User, 2020-2035
  • Table 23: North America Market Value (USD Million) Forecast by Sales Channel, 2020-2035
  • Table 24: North America Market Volume (Units) Forecast by Sales Channel, 2020-2035
  • Table 25: Latin America Market Value (USD Million) Forecast by Country, 2020-2035
  • Table 26: Latin America Market Volume (Units) Forecast by Country, 2020-2035
  • Table 27: Latin America Market Value (USD Million) Forecast by Fiber Type, 2020-2035
  • Table 28: Latin America Market Volume (Units) Forecast by Fiber Type, 2020-2035
  • Table 29: Latin America Market Value (USD Million) Forecast by Application, 2020-2035
  • Table 30: Latin America Market Volume (Units) Forecast by Application, 2020-2035
  • Table 31: Latin America Market Value (USD Million) Forecast by Product Format, 2020-2035
  • Table 32: Latin America Market Volume (Units) Forecast by Product Format, 2020-2035
  • Table 33: Latin America Market Value (USD Million) Forecast by End User, 2020-2035
  • Table 34: Latin America Market Volume (Units) Forecast by End User, 2020-2035
  • Table 35: Latin America Market Value (USD Million) Forecast by Sales Channel, 2020-2035
  • Table 36: Latin America Market Volume (Units) Forecast by Sales Channel, 2020-2035
  • Table 37: Europe Market Value (USD Million) Forecast by Country, 2020-2035
  • Table 38: Europe Market Volume (Units) Forecast by Country, 2020-2035
  • Table 39: Europe Market Value (USD Million) Forecast by Fiber Type, 2020-2035
  • Table 40: Europe Market Volume (Units) Forecast by Fiber Type, 2020-2035
  • Table 41: Europe Market Value (USD Million) Forecast by Application, 2020-2035
  • Table 42: Europe Market Volume (Units) Forecast by Application, 2020-2035
  • Table 43: Europe Market Value (USD Million) Forecast by Product Format, 2020-2035
  • Table 44: Europe Market Volume (Units) Forecast by Product Format, 2020-2035
  • Table 45: Europe Market Value (USD Million) Forecast by End User, 2020-2035
  • Table 46: Europe Market Volume (Units) Forecast by End User, 2020-2035
  • Table 47: Europe Market Value (USD Million) Forecast by Sales Channel, 2020-2035
  • Table 48: Europe Market Volume (Units) Forecast by Sales Channel, 2020-2035
  • Table 49: East Asia Market Value (USD Million) Forecast by Country, 2020-2035
  • Table 50: East Asia Market Volume (Units) Forecast by Country, 2020-2035
  • Table 51: East Asia Market Value (USD Million) Forecast by Fiber Type, 2020-2035
  • Table 52: East Asia Market Volume (Units) Forecast by Fiber Type, 2020-2035
  • Table 53: East Asia Market Value (USD Million) Forecast by Application, 2020-2035
  • Table 54: East Asia Market Volume (Units) Forecast by Application, 2020-2035
  • Table 55: East Asia Market Value (USD Million) Forecast by Product Format, 2020-2035
  • Table 56: East Asia Market Volume (Units) Forecast by Product Format, 2020-2035
  • Table 57: East Asia Market Value (USD Million) Forecast by End User, 2020-2035
  • Table 58: East Asia Market Volume (Units) Forecast by End User, 2020-2035
  • Table 59: East Asia Market Value (USD Million) Forecast by Sales Channel, 2020-2035
  • Table 60: East Asia Market Volume (Units) Forecast by Sales Channel, 2020-2035
  • Table 61: South Asia & Pacific Market Value (USD Million) Forecast by Country, 2020-2035
  • Table 62: South Asia & Pacific Market Volume (Units) Forecast by Country, 2020-2035
  • Table 63: South Asia & Pacific Market Value (USD Million) Forecast by Fiber Type, 2020-2035
  • Table 64: South Asia & Pacific Market Volume (Units) Forecast by Fiber Type, 2020-2035
  • Table 65: South Asia & Pacific Market Value (USD Million) Forecast by Application, 2020-2035
  • Table 66: South Asia & Pacific Market Volume (Units) Forecast by Application, 2020-2035
  • Table 67: South Asia & Pacific Market Value (USD Million) Forecast by Product Format, 2020-2035
  • Table 68: South Asia & Pacific Market Volume (Units) Forecast by Product Format, 2020-2035
  • Table 69: South Asia & Pacific Market Value (USD Million) Forecast by End User, 2020-2035
  • Table 70: South Asia & Pacific Market Volume (Units) Forecast by End User, 2020-2035
  • Table 71: South Asia & Pacific Market Value (USD Million) Forecast by Sales Channel, 2020-2035
  • Table 72: South Asia & Pacific Market Volume (Units) Forecast by Sales Channel, 2020-2035
  • Table 73: MEA Market Value (USD Million) Forecast by Country, 2020-2035
  • Table 74: MEA Market Volume (Units) Forecast by Country, 2020-2035
  • Table 75: MEA Market Value (USD Million) Forecast by Fiber Type, 2020-2035
  • Table 76: MEA Market Volume (Units) Forecast by Fiber Type, 2020-2035
  • Table 77: MEA Market Value (USD Million) Forecast by Application, 2020-2035
  • Table 78: MEA Market Volume (Units) Forecast by Application, 2020-2035
  • Table 79: MEA Market Value (USD Million) Forecast by Product Format, 2020-2035
  • Table 80: MEA Market Volume (Units) Forecast by Product Format, 2020-2035
  • Table 81: MEA Market Value (USD Million) Forecast by End User, 2020-2035
  • Table 82: MEA Market Volume (Units) Forecast by End User, 2020-2035
  • Table 83: MEA Market Value (USD Million) Forecast by Sales Channel, 2020-2035
  • Table 84: MEA Market Volume (Units) Forecast by Sales Channel, 2020-2035

List of Figures

  • Figure 1: Global Market Value (USD Million) by Fiber Type, 2025-2035
  • Figure 2: Global Market Value (USD Million) by Application, 2025-2035
  • Figure 3: Global Market Value (USD Million) by Product Format, 2025-2035
  • Figure 4: Global Market Value (USD Million) by End User, 2025-2035
  • Figure 5: Global Market Value (USD Million) by Sales Channel, 2025-2035
  • Figure 6: Global Market Value (USD Million) by Region, 2025-2035
  • Figure 7: Global Market Value (USD Million) Analysis by Region, 2020-2035
  • Figure 8: Global Market Volume (Units) Analysis by Region, 2020-2035
  • Figure 9: Global Market Value Share (%) and BPS Analysis by Region, 2025-2035
  • Figure 10: Global Market Y-o-Y Growth (%) Projections by Region, 2025-2035
  • Figure 11: Global Market Value (USD Million) Analysis by Fiber Type, 2020-2035
  • Figure 12: Global Market Volume (Units) Analysis by Fiber Type, 2020-2035
  • Figure 13: Global Market Value Share (%) and BPS Analysis by Fiber Type, 2025-2035
  • Figure 14: Global Market Y-o-Y Growth (%) Projections by Fiber Type, 2025-2035
  • Figure 15: Global Market Value (USD Million) Analysis by Application, 2020-2035
  • Figure 16: Global Market Volume (Units) Analysis by Application, 2020-2035
  • Figure 17: Global Market Value Share (%) and BPS Analysis by Application, 2025-2035
  • Figure 18: Global Market Y-o-Y Growth (%) Projections by Application, 2025-2035
  • Figure 19: Global Market Value (USD Million) Analysis by Product Format, 2020-2035
  • Figure 20: Global Market Volume (Units) Analysis by Product Format, 2020-2035
  • Figure 21: Global Market Value Share (%) and BPS Analysis by Product Format, 2025-2035
  • Figure 22: Global Market Y-o-Y Growth (%) Projections by Product Format, 2025-2035
  • Figure 23: Global Market Value (USD Million) Analysis by End User, 2020-2035
  • Figure 24: Global Market Volume (Units) Analysis by End User, 2020-2035
  • Figure 25: Global Market Value Share (%) and BPS Analysis by End User, 2025-2035
  • Figure 26: Global Market Y-o-Y Growth (%) Projections by End User, 2025-2035
  • Figure 27: Global Market Value (USD Million) Analysis by Sales Channel, 2020-2035
  • Figure 28: Global Market Volume (Units) Analysis by Sales Channel, 2020-2035
  • Figure 29: Global Market Value Share (%) and BPS Analysis by Sales Channel, 2025-2035
  • Figure 30: Global Market Y-o-Y Growth (%) Projections by Sales Channel, 2025-2035
  • Figure 31: Global Market Attractiveness by Fiber Type, 2025-2035
  • Figure 32: Global Market Attractiveness by Application, 2025-2035
  • Figure 33: Global Market Attractiveness by Product Format, 2025-2035
  • Figure 34: Global Market Attractiveness by End User, 2025-2035
  • Figure 35: Global Market Attractiveness by Sales Channel, 2025-2035
  • Figure 36: Global Market Attractiveness by Region, 2025-2035
  • Figure 37: North America Market Value (USD Million) by Fiber Type, 2025-2035
  • Figure 38: North America Market Value (USD Million) by Application, 2025-2035
  • Figure 39: North America Market Value (USD Million) by Product Format, 2025-2035
  • Figure 40: North America Market Value (USD Million) by End User, 2025-2035
  • Figure 41: North America Market Value (USD Million) by Sales Channel, 2025-2035
  • Figure 42: North America Market Value (USD Million) by Country, 2025-2035
  • Figure 43: North America Market Value (USD Million) Analysis by Country, 2020-2035
  • Figure 44: North America Market Volume (Units) Analysis by Country, 2020-2035
  • Figure 45: North America Market Value Share (%) and BPS Analysis by Country, 2025-2035
  • Figure 46: North America Market Y-o-Y Growth (%) Projections by Country, 2025-2035
  • Figure 47: North America Market Value (USD Million) Analysis by Fiber Type, 2020-2035
  • Figure 48: North America Market Volume (Units) Analysis by Fiber Type, 2020-2035
  • Figure 49: North America Market Value Share (%) and BPS Analysis by Fiber Type, 2025-2035
  • Figure 50: North America Market Y-o-Y Growth (%) Projections by Fiber Type, 2025-2035
  • Figure 51: North America Market Value (USD Million) Analysis by Application, 2020-2035
  • Figure 52: North America Market Volume (Units) Analysis by Application, 2020-2035
  • Figure 53: North America Market Value Share (%) and BPS Analysis by Application, 2025-2035
  • Figure 54: North America Market Y-o-Y Growth (%) Projections by Application, 2025-2035
  • Figure 55: North America Market Value (USD Million) Analysis by Product Format, 2020-2035
  • Figure 56: North America Market Volume (Units) Analysis by Product Format, 2020-2035
  • Figure 57: North America Market Value Share (%) and BPS Analysis by Product Format, 2025-2035
  • Figure 58: North America Market Y-o-Y Growth (%) Projections by Product Format, 2025-2035
  • Figure 59: North America Market Value (USD Million) Analysis by End User, 2020-2035
  • Figure 60: North America Market Volume (Units) Analysis by End User, 2020-2035
  • Figure 61: North America Market Value Share (%) and BPS Analysis by End User, 2025-2035
  • Figure 62: North America Market Y-o-Y Growth (%) Projections by End User, 2025-2035
  • Figure 63: North America Market Value (USD Million) Analysis by Sales Channel, 2020-2035
  • Figure 64: North America Market Volume (Units) Analysis by Sales Channel, 2020-2035
  • Figure 65: North America Market Value Share (%) and BPS Analysis by Sales Channel, 2025-2035
  • Figure 66: North America Market Y-o-Y Growth (%) Projections by Sales Channel, 2025-2035
  • Figure 67: North America Market Attractiveness by Fiber Type, 2025-2035
  • Figure 68: North America Market Attractiveness by Application, 2025-2035
  • Figure 69: North America Market Attractiveness by Product Format, 2025-2035
  • Figure 70: North America Market Attractiveness by End User, 2025-2035
  • Figure 71: North America Market Attractiveness by Sales Channel, 2025-2035
  • Figure 72: North America Market Attractiveness by Country, 2025-2035
  • Figure 73: Latin America Market Value (USD Million) by Fiber Type, 2025-2035
  • Figure 74: Latin America Market Value (USD Million) by Application, 2025-2035
  • Figure 75: Latin America Market Value (USD Million) by Product Format, 2025-2035
  • Figure 76: Latin America Market Value (USD Million) by End User, 2025-2035
  • Figure 77: Latin America Market Value (USD Million) by Sales Channel, 2025-2035
  • Figure 78: Latin America Market Value (USD Million) by Country, 2025-2035
  • Figure 79: Latin America Market Value (USD Million) Analysis by Country, 2020-2035
  • Figure 80: Latin America Market Volume (Units) Analysis by Country, 2020-2035
  • Figure 81: Latin America Market Value Share (%) and BPS Analysis by Country, 2025-2035
  • Figure 82: Latin America Market Y-o-Y Growth (%) Projections by Country, 2025-2035
  • Figure 83: Latin America Market Value (USD Million) Analysis by Fiber Type, 2020-2035
  • Figure 84: Latin America Market Volume (Units) Analysis by Fiber Type, 2020-2035
  • Figure 85: Latin America Market Value Share (%) and BPS Analysis by Fiber Type, 2025-2035
  • Figure 86: Latin America Market Y-o-Y Growth (%) Projections by Fiber Type, 2025-2035
  • Figure 87: Latin America Market Value (USD Million) Analysis by Application, 2020-2035
  • Figure 88: Latin America Market Volume (Units) Analysis by Application, 2020-2035
  • Figure 89: Latin America Market Value Share (%) and BPS Analysis by Application, 2025-2035
  • Figure 90: Latin America Market Y-o-Y Growth (%) Projections by Application, 2025-2035
  • Figure 91: Latin America Market Value (USD Million) Analysis by Product Format, 2020-2035
  • Figure 92: Latin America Market Volume (Units) Analysis by Product Format, 2020-2035
  • Figure 93: Latin America Market Value Share (%) and BPS Analysis by Product Format, 2025-2035
  • Figure 94: Latin America Market Y-o-Y Growth (%) Projections by Product Format, 2025-2035
  • Figure 95: Latin America Market Value (USD Million) Analysis by End User, 2020-2035
  • Figure 96: Latin America Market Volume (Units) Analysis by End User, 2020-2035
  • Figure 97: Latin America Market Value Share (%) and BPS Analysis by End User, 2025-2035
  • Figure 98: Latin America Market Y-o-Y Growth (%) Projections by End User, 2025-2035
  • Figure 99: Latin America Market Value (USD Million) Analysis by Sales Channel, 2020-2035
  • Figure 100: Latin America Market Volume (Units) Analysis by Sales Channel, 2020-2035
  • Figure 101: Latin America Market Value Share (%) and BPS Analysis by Sales Channel, 2025-2035
  • Figure 102: Latin America Market Y-o-Y Growth (%) Projections by Sales Channel, 2025-2035
  • Figure 103: Latin America Market Attractiveness by Fiber Type, 2025-2035
  • Figure 104: Latin America Market Attractiveness by Application, 2025-2035
  • Figure 105: Latin America Market Attractiveness by Product Format, 2025-2035
  • Figure 106: Latin America Market Attractiveness by End User, 2025-2035
  • Figure 107: Latin America Market Attractiveness by Sales Channel, 2025-2035
  • Figure 108: Latin America Market Attractiveness by Country, 2025-2035
  • Figure 109: Europe Market Value (USD Million) by Fiber Type, 2025-2035
  • Figure 110: Europe Market Value (USD Million) by Application, 2025-2035
  • Figure 111: Europe Market Value (USD Million) by Product Format, 2025-2035
  • Figure 112: Europe Market Value (USD Million) by End User, 2025-2035
  • Figure 113: Europe Market Value (USD Million) by Sales Channel, 2025-2035
  • Figure 114: Europe Market Value (USD Million) by Country, 2025-2035
  • Figure 115: Europe Market Value (USD Million) Analysis by Country, 2020-2035
  • Figure 116: Europe Market Volume (Units) Analysis by Country, 2020-2035
  • Figure 117: Europe Market Value Share (%) and BPS Analysis by Country, 2025-2035
  • Figure 118: Europe Market Y-o-Y Growth (%) Projections by Country, 2025-2035
  • Figure 119: Europe Market Value (USD Million) Analysis by Fiber Type, 2020-2035
  • Figure 120: Europe Market Volume (Units) Analysis by Fiber Type, 2020-2035
  • Figure 121: Europe Market Value Share (%) and BPS Analysis by Fiber Type, 2025-2035
  • Figure 122: Europe Market Y-o-Y Growth (%) Projections by Fiber Type, 2025-2035
  • Figure 123: Europe Market Value (USD Million) Analysis by Application, 2020-2035
  • Figure 124: Europe Market Volume (Units) Analysis by Application, 2020-2035
  • Figure 125: Europe Market Value Share (%) and BPS Analysis by Application, 2025-2035
  • Figure 126: Europe Market Y-o-Y Growth (%) Projections by Application, 2025-2035
  • Figure 127: Europe Market Value (USD Million) Analysis by Product Format, 2020-2035
  • Figure 128: Europe Market Volume (Units) Analysis by Product Format, 2020-2035
  • Figure 129: Europe Market Value Share (%) and BPS Analysis by Product Format, 2025-2035
  • Figure 130: Europe Market Y-o-Y Growth (%) Projections by Product Format, 2025-2035
  • Figure 131: Europe Market Value (USD Million) Analysis by End User, 2020-2035
  • Figure 132: Europe Market Volume (Units) Analysis by End User, 2020-2035
  • Figure 133: Europe Market Value Share (%) and BPS Analysis by End User, 2025-2035
  • Figure 134: Europe Market Y-o-Y Growth (%) Projections by End User, 2025-2035
  • Figure 135: Europe Market Value (USD Million) Analysis by Sales Channel, 2020-2035
  • Figure 136: Europe Market Volume (Units) Analysis by Sales Channel, 2020-2035
  • Figure 137: Europe Market Value Share (%) and BPS Analysis by Sales Channel, 2025-2035
  • Figure 138: Europe Market Y-o-Y Growth (%) Projections by Sales Channel, 2025-2035
  • Figure 139: Europe Market Attractiveness by Fiber Type, 2025-2035
  • Figure 140: Europe Market Attractiveness by Application, 2025-2035
  • Figure 141: Europe Market Attractiveness by Product Format, 2025-2035
  • Figure 142: Europe Market Attractiveness by End User, 2025-2035
  • Figure 143: Europe Market Attractiveness by Sales Channel, 2025-2035
  • Figure 144: Europe Market Attractiveness by Country, 2025-2035
  • Figure 145: East Asia Market Value (USD Million) by Fiber Type, 2025-2035
  • Figure 146: East Asia Market Value (USD Million) by Application, 2025-2035
  • Figure 147: East Asia Market Value (USD Million) by Product Format, 2025-2035
  • Figure 148: East Asia Market Value (USD Million) by End User, 2025-2035
  • Figure 149: East Asia Market Value (USD Million) by Sales Channel, 2025-2035
  • Figure 150: East Asia Market Value (USD Million) by Country, 2025-2035
  • Figure 151: East Asia Market Value (USD Million) Analysis by Country, 2020-2035
  • Figure 152: East Asia Market Volume (Units) Analysis by Country, 2020-2035
  • Figure 153: East Asia Market Value Share (%) and BPS Analysis by Country, 2025-2035
  • Figure 154: East Asia Market Y-o-Y Growth (%) Projections by Country, 2025-2035
  • Figure 155: East Asia Market Value (USD Million) Analysis by Fiber Type, 2020-2035
  • Figure 156: East Asia Market Volume (Units) Analysis by Fiber Type, 2020-2035
  • Figure 157: East Asia Market Value Share (%) and BPS Analysis by Fiber Type, 2025-2035
  • Figure 158: East Asia Market Y-o-Y Growth (%) Projections by Fiber Type, 2025-2035
  • Figure 159: East Asia Market Value (USD Million) Analysis by Application, 2020-2035
  • Figure 160: East Asia Market Volume (Units) Analysis by Application, 2020-2035
  • Figure 161: East Asia Market Value Share (%) and BPS Analysis by Application, 2025-2035
  • Figure 162: East Asia Market Y-o-Y Growth (%) Projections by Application, 2025-2035
  • Figure 163: East Asia Market Value (USD Million) Analysis by Product Format, 2020-2035
  • Figure 164: East Asia Market Volume (Units) Analysis by Product Format, 2020-2035
  • Figure 165: East Asia Market Value Share (%) and BPS Analysis by Product Format, 2025-2035
  • Figure 166: East Asia Market Y-o-Y Growth (%) Projections by Product Format, 2025-2035
  • Figure 167: East Asia Market Value (USD Million) Analysis by End User, 2020-2035
  • Figure 168: East Asia Market Volume (Units) Analysis by End User, 2020-2035
  • Figure 169: East Asia Market Value Share (%) and BPS Analysis by End User, 2025-2035
  • Figure 170: East Asia Market Y-o-Y Growth (%) Projections by End User, 2025-2035
  • Figure 171: East Asia Market Value (USD Million) Analysis by Sales Channel, 2020-2035
  • Figure 172: East Asia Market Volume (Units) Analysis by Sales Channel, 2020-2035
  • Figure 173: East Asia Market Value Share (%) and BPS Analysis by Sales Channel, 2025-2035
  • Figure 174: East Asia Market Y-o-Y Growth (%) Projections by Sales Channel, 2025-2035
  • Figure 175: East Asia Market Attractiveness by Fiber Type, 2025-2035
  • Figure 176: East Asia Market Attractiveness by Application, 2025-2035
  • Figure 177: East Asia Market Attractiveness by Product Format, 2025-2035
  • Figure 178: East Asia Market Attractiveness by End User, 2025-2035
  • Figure 179: East Asia Market Attractiveness by Sales Channel, 2025-2035
  • Figure 180: East Asia Market Attractiveness by Country, 2025-2035
  • Figure 181: South Asia & Pacific Market Value (USD Million) by Fiber Type, 2025-2035
  • Figure 182: South Asia & Pacific Market Value (USD Million) by Application, 2025-2035
  • Figure 183: South Asia & Pacific Market Value (USD Million) by Product Format, 2025-2035
  • Figure 184: South Asia & Pacific Market Value (USD Million) by End User, 2025-2035
  • Figure 185: South Asia & Pacific Market Value (USD Million) by Sales Channel, 2025-2035
  • Figure 186: South Asia & Pacific Market Value (USD Million) by Country, 2025-2035
  • Figure 187: South Asia & Pacific Market Value (USD Million) Analysis by Country, 2020-2035
  • Figure 188: South Asia & Pacific Market Volume (Units) Analysis by Country, 2020-2035
  • Figure 189: South Asia & Pacific Market Value Share (%) and BPS Analysis by Country, 2025-2035
  • Figure 190: South Asia & Pacific Market Y-o-Y Growth (%) Projections by Country, 2025-2035
  • Figure 191: South Asia & Pacific Market Value (USD Million) Analysis by Fiber Type, 2020-2035
  • Figure 192: South Asia & Pacific Market Volume (Units) Analysis by Fiber Type, 2020-2035
  • Figure 193: South Asia & Pacific Market Value Share (%) and BPS Analysis by Fiber Type, 2025-2035
  • Figure 194: South Asia & Pacific Market Y-o-Y Growth (%) Projections by Fiber Type, 2025-2035
  • Figure 195: South Asia & Pacific Market Value (USD Million) Analysis by Application, 2020-2035
  • Figure 196: South Asia & Pacific Market Volume (Units) Analysis by Application, 2020-2035
  • Figure 197: South Asia & Pacific Market Value Share (%) and BPS Analysis by Application, 2025-2035
  • Figure 198: South Asia & Pacific Market Y-o-Y Growth (%) Projections by Application, 2025-2035
  • Figure 199: South Asia & Pacific Market Value (USD Million) Analysis by Product Format, 2020-2035
  • Figure 200: South Asia & Pacific Market Volume (Units) Analysis by Product Format, 2020-2035
  • Figure 201: South Asia & Pacific Market Value Share (%) and BPS Analysis by Product Format, 2025-2035
  • Figure 202: South Asia & Pacific Market Y-o-Y Growth (%) Projections by Product Format, 2025-2035
  • Figure 203: South Asia & Pacific Market Value (USD Million) Analysis by End User, 2020-2035
  • Figure 204: South Asia & Pacific Market Volume (Units) Analysis by End User, 2020-2035
  • Figure 205: South Asia & Pacific Market Value Share (%) and BPS Analysis by End User, 2025-2035
  • Figure 206: South Asia & Pacific Market Y-o-Y Growth (%) Projections by End User, 2025-2035
  • Figure 207: South Asia & Pacific Market Value (USD Million) Analysis by Sales Channel, 2020-2035
  • Figure 208: South Asia & Pacific Market Volume (Units) Analysis by Sales Channel, 2020-2035
  • Figure 209: South Asia & Pacific Market Value Share (%) and BPS Analysis by Sales Channel, 2025-2035
  • Figure 210: South Asia & Pacific Market Y-o-Y Growth (%) Projections by Sales Channel, 2025-2035
  • Figure 211: South Asia & Pacific Market Attractiveness by Fiber Type, 2025-2035
  • Figure 212: South Asia & Pacific Market Attractiveness by Application, 2025-2035
  • Figure 213: South Asia & Pacific Market Attractiveness by Product Format, 2025-2035
  • Figure 214: South Asia & Pacific Market Attractiveness by End User, 2025-2035
  • Figure 215: South Asia & Pacific Market Attractiveness by Sales Channel, 2025-2035
  • Figure 216: South Asia & Pacific Market Attractiveness by Country, 2025-2035
  • Figure 217: MEA Market Value (USD Million) by Fiber Type, 2025-2035
  • Figure 218: MEA Market Value (USD Million) by Application, 2025-2035
  • Figure 219: MEA Market Value (USD Million) by Product Format, 2025-2035
  • Figure 220: MEA Market Value (USD Million) by End User, 2025-2035
  • Figure 221: MEA Market Value (USD Million) by Sales Channel, 2025-2035
  • Figure 222: MEA Market Value (USD Million) by Country, 2025-2035
  • Figure 223: MEA Market Value (USD Million) Analysis by Country, 2020-2035
  • Figure 224: MEA Market Volume (Units) Analysis by Country, 2020-2035
  • Figure 225: MEA Market Value Share (%) and BPS Analysis by Country, 2025-2035
  • Figure 226: MEA Market Y-o-Y Growth (%) Projections by Country, 2025-2035
  • Figure 227: MEA Market Value (USD Million) Analysis by Fiber Type, 2020-2035
  • Figure 228: MEA Market Volume (Units) Analysis by Fiber Type, 2020-2035
  • Figure 229: MEA Market Value Share (%) and BPS Analysis by Fiber Type, 2025-2035
  • Figure 230: MEA Market Y-o-Y Growth (%) Projections by Fiber Type, 2025-2035
  • Figure 231: MEA Market Value (USD Million) Analysis by Application, 2020-2035
  • Figure 232: MEA Market Volume (Units) Analysis by Application, 2020-2035
  • Figure 233: MEA Market Value Share (%) and BPS Analysis by Application, 2025-2035
  • Figure 234: MEA Market Y-o-Y Growth (%) Projections by Application, 2025-2035
  • Figure 235: MEA Market Value (USD Million) Analysis by Product Format, 2020-2035
  • Figure 236: MEA Market Volume (Units) Analysis by Product Format, 2020-2035
  • Figure 237: MEA Market Value Share (%) and BPS Analysis by Product Format, 2025-2035
  • Figure 238: MEA Market Y-o-Y Growth (%) Projections by Product Format, 2025-2035
  • Figure 239: MEA Market Value (USD Million) Analysis by End User, 2020-2035
  • Figure 240: MEA Market Volume (Units) Analysis by End User, 2020-2035
  • Figure 241: MEA Market Value Share (%) and BPS Analysis by End User, 2025-2035
  • Figure 242: MEA Market Y-o-Y Growth (%) Projections by End User, 2025-2035
  • Figure 243: MEA Market Value (USD Million) Analysis by Sales Channel, 2020-2035
  • Figure 244: MEA Market Volume (Units) Analysis by Sales Channel, 2020-2035
  • Figure 245: MEA Market Value Share (%) and BPS Analysis by Sales Channel, 2025-2035
  • Figure 246: MEA Market Y-o-Y Growth (%) Projections by Sales Channel, 2025-2035
  • Figure 247: MEA Market Attractiveness by Fiber Type, 2025-2035
  • Figure 248: MEA Market Attractiveness by Application, 2025-2035
  • Figure 249: MEA Market Attractiveness by Product Format, 2025-2035
  • Figure 250: MEA Market Attractiveness by End User, 2025-2035
  • Figure 251: MEA Market Attractiveness by Sales Channel, 2025-2035
  • Figure 252: MEA Market Attractiveness by Country, 2025-2035

Frequently Asked Questions

How big is the Microbiome Fiber Supplement in 2025?

The global Microbiome Fiber Supplement is estimated to be valued at USD 1,235.6 million in 2025.

What will be the size of Microbiome Fiber Supplement in 2035?

The market size for the Microbiome Fiber Supplement is projected to reach USD 2,288.3 million by 2035.

How much will be the Microbiome Fiber Supplement growth between 2025 and 2035?

The Microbiome Fiber Supplement is expected to grow at a 6.4% CAGR between 2025 and 2035.

What are the key product format the Microbiome Fiber Supplement?

The key product format in the Microbiome Fiber Supplement Market are powders, capsules & tablets, gummies, ready-to-drink beverages, and functional foods, with powders leading in market share due to dosage flexibility and high solubility.

Which application segment to contribute significant share in the Microbiome Fiber Supplement in 2025?

In terms of application, the digestive health segment is projected to command the largest share at 30% in 2025, reflecting continued focus on gastrointestinal wellness and fiber-based preventive health interventions.

Explore Similar Insights

Future Market Insights

Microbiome Fiber Supplement