Reports

- Global Locations -

Headquarters

Future Market Insights, Inc.

Christiana Corporate, 200
Continental Drive, Suite 401,
Newark, Delaware - 19713,
United States

T: +1-845-579-5705

Americas

Future Market Insights, Inc.

616 Corporate Way, Suite 2-9018,
Valley Cottage, NY 10989, United States

T: +1-347-918-3531

MEA

Future Market Insights

1602-6 Jumeirah Bay X2 Tower, Plot No: JLT-PH2-X2A,
Jumeirah Lakes Towers, Dubai,
United Arab Emirates

Europe

Future Market Insights

3rd Floor, 207 Regent Street,
W1B 3HH London
United Kingdom

T: + 44 (0) 20 8123 9659
D: +44 (0) 20 3287 4268

Asia Pacific

Future Market Insights

IndiaLand Global Tech Park, Unit UG-1, Behind Grand HighStreet, Phase 1, Hinjawadi, MH, Pune – 411057, India

Microencapsulated Omega-3 Powders Market Snapshot (2022-2032)

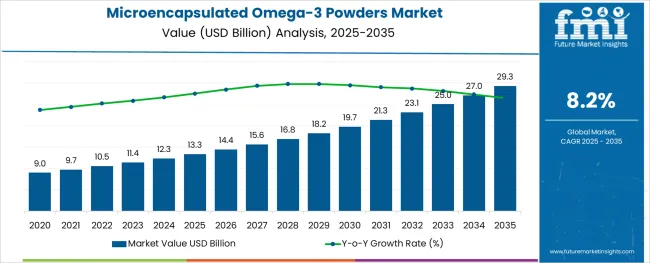
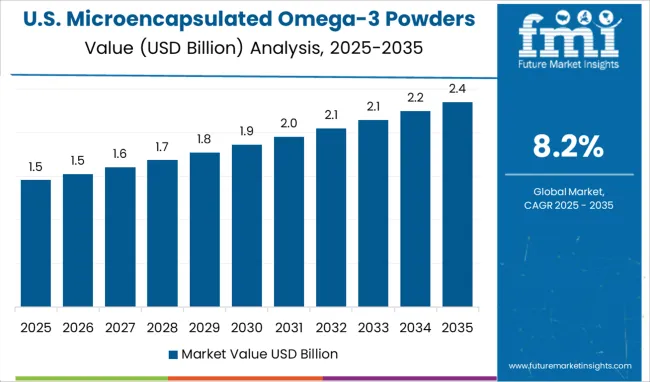
[250 Pages Report] The global microencapsulated omega-3 powders market size is likely to exceed US$ 17.4 Bn in 2032 and exhibit steady growth at a CAGR of 8.2% in the forecast period from 2022 to 2032. Increasing product consumption on the back of changing dietary habits and rising prevalence of cardiovascular diseases is set to push growth.

As per a report by FMI, demand for microencapsulated omega-3 powders is projected to reach US$ 10.5 Bn in 2022. Surging investment by consumers in products associated with their healthcare and wellbeing is anticipated to bode well for the market.

Report Attribute Details
Microencapsulated Omega-3 Powders Market Estimated Base Year Value (2021) US$ 9.1 Billion
Microencapsulated Omega-3 Powders Market Expected Market Value (2022) US$ 10.5 Billion
Microencapsulated Omega-3 Powders Market Anticipated Forecast Value (2032) US$ 17.4 Billion
Microencapsulated Omega-3 Powders Market Projected Growth Rate (2022-2032) 8.2% CAGR

As omega-3 fatty acids help in lowering the risk of arrhythmias or abnormal heartbeats that can even lead to sudden death of patients, demand for omega-3 powders is set to surge in the assessment period. The emergence of microencapsulation technology that is capable of improving the durability of powders even in temperature extremities is likely to push growth.

Besides, the ability of omega-3 fatty acids to lower the levels of triglyceride, reduce blood pressure levels, and slow down the growth of atherosclerotic plaque is expected to propel sales of microencapsulated omega-3 powders in future years. Increasing inclination of consumers towards healthier alternatives and surging adoption of preventive care to lead a better lifestyle are also set to boost growth.

In addition to that, high demand for omega-3 supplements worldwide as they are considered to be a rich source of minerals, proteins, and vitamins is estimated to foster growth. Increasing need to lower the risk of depression, asthma, and cancer among people of all age groups is also likely to drive the market.

Don't pay for what you don't need

Customize your report by selecting specific countries or regions and save 30%!

Rising Prevalence of Diabetes and Cancer to Push the Microencapsulated Omega-3 Powders Market

Increasing prevalence of cancer and cardiovascular disease stoked by rising health awareness and adoption of a sedentary lifestyle across the globe is anticipated to spur the microencapsulated omega-3 powders market growth in the upcoming years. As per the World Health Organization (WHO), in 2020, cancer accounted for about 10 million deaths or 1 in 6 deaths worldwide. These numbers are projected to surge at a rapid pace in future years, thereby accelerating the market.

The WHO further mentioned that diabetes was considered to be the ninth leading cause of death in 2019, with a projected 1.5 million deaths directly caused by the disease. Also, the number of people suffering from diabetes surged to 422 million in 2014 from 422 million in 2014 with high prevalence in low- and middle-income countries globally. The trend is set to continue during the forthcoming years with changing lifestyles and consumption of junk food, thereby fostering growth.

Availability of Alternative Sources May Hamper the Microencapsulated Omega-3 Powders Market

Conventional omega 3 ingredient producers, especially in emerging economies, find it difficult to provide their products at a competitive price range. It is more relevant for those manufacturers that deliver omega-3 ingredients from alternative sources, such as krill oils and algae oils. Apart from that, consuming very high amounts of omega-3 fatty acids with health supplements can surge blood sugar levels of those people living with diabetes.

Diarrhea is another common side effect of consuming excessive fish oil. Driven by the above-mentioned disadvantages, demand for microencapsulated omega-3 powders may decline in future.
Nandini Roy Choudhury

Principal Consultant

Talk to Analyst

Find your sweet spots for generating winning opportunities in this market.

Surging Cases of Obesity to Drive the North America Microencapsulated Omega-3 Powders Market

North America is anticipated to dominate in the evaluation period by generating the largest microencapsulated omega-3 powders market share. Increasing cases of heart-related issues and obesity in the U.S. and Canada are set to push the need for various health supplements, including microencapsulated omega-3 powders across North America.

Moreover, several manufacturers based in the region are focusing more on developing advanced production technologies. They are thus aiming to reduce oxidation in their manufacturing processes and eliminate environmental pollutants from fish oil. A few North America-based producers are also striving to concentrate omega-3 content in their final products to ensure the delivery of healthy parameters of fish oil.
Increasing Demand for Plant-based Alternatives to Augment the Asia Pacific Microencapsulated Omega-3 Powders Market

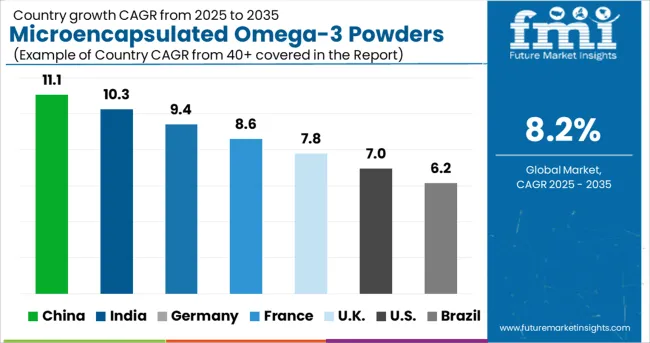
Increasing awareness among people living in India, China, South Korea, and Japan regarding the benefits of following a healthy diet is projected to augment the Asia Pacific microencapsulated omega-3 powders market size. Increasing population of young mothers and high birth rate across Asia Pacific are also set to spur the demand for infant nutrition, thereby pushing sales.

Additionally, increasing shift of consumers towards plant-based alternatives is compelling manufacturers to produce algae oil-based supplements. Growing vegan population across Asia Pacific is set to fuel sales of plant-based casing materials.
Get the data you need at a Fraction of the cost

Personalize your report by choosing insights you need
and save 40%!

Market Competition

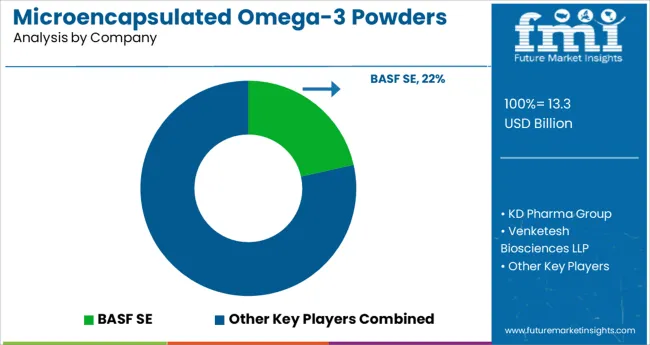
Some of the prominent companies operating in the global microencapsulated omega-3 powders market include Clover Corporation, Venketesh Biosciences LLP, Novotech Nutrition, Socius Ingredients, Koninklijke DSM N.V., KD Pharma Group, BASF SE, Wincobel, Skuny Bioscience Co., Ltd., Stepan Company, Glanbia Nutritionals, Biosearch SA and Benexia among others.

The global market is highly competitive in nature with the presence of various local and international key players. They are mainly focusing on developing well-differentiated products to generate high market share. Some of the other key players are aiming to use non-fish sources for omega-3 extraction backed by the increasing trend of veganism in various parts of the globe. They are striving to find new algal sources as these do not have a fishy odor or taste, thereby making omega-3 ideal for the vegan population.

Report Scope

Report Attribute Details
Growth Rate CAGR of 8.2% from 2022 to 2032
Base Year for Estimation 2021
Historical Data 2015-2020
Forecast Period 2022-2032
Quantitative Units Revenue in US$ Million and CAGR from 2022-2032
Report Coverage Revenue Forecast, Volume Forecast, Company Ranking, Competitive Landscape, Growth Factors, Trends and Pricing Analysis
Segments Covered
  • Nature
  • Distribution Channel
  • Type
  • Region
Regions Covered
  • North America
  • Latin America
  • Western Europe
  • Eastern Europe
  • APEJ
  • Japan
  • Middle East and Africa
Key Countries Profiled
  • USA
  • Canada
  • Brazil
  • Argentina
  • Germany
  • UK
  • France
  • Spain
  • Italy
  • Nordics
  • BENELUX
  • Australia & New Zealand
  • China
  • India
  • ASEAN
  • GCC
  • South Africa
Key Companies Profiled
  • Clover Corporation
  • Venketesh Biosciences LLP
  • Novotech Nutrition
  • Socius Ingredients
  • Koninklijke DSM N.V.
  • KD Pharma Group
  • BASF SE
  • Wincobel
  • Skuny Bioscience Co., Ltd.
  • Stepan Company
  • Glanbia Nutritionals
  • Biosearch SA
  • Benexia
Customization Available Upon Request

Key Segments Profiled in the Microencapsulated Omega-3 Powders Industry Survey

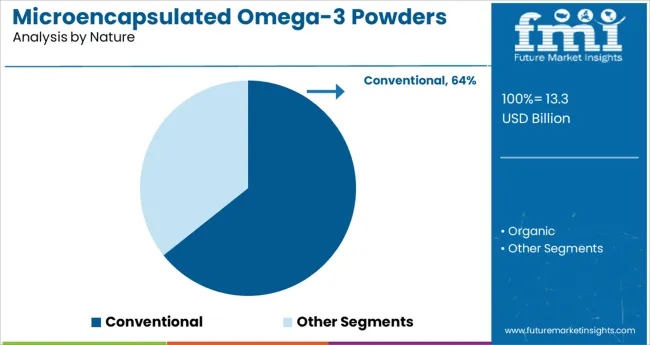
By Nature:

  • Organic
  • Conventional

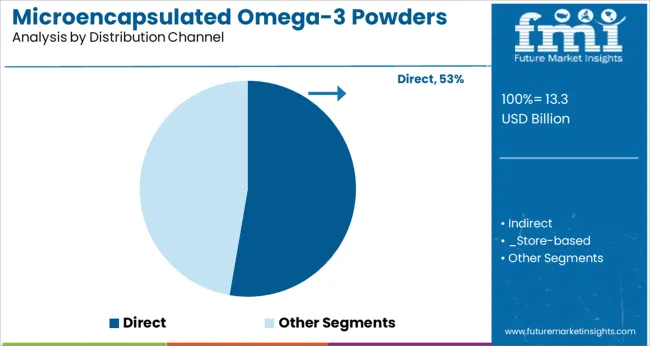
By Distribution Channel:

  • Direct
  • Indirect
  • Store-based
  • Supermarket/Hypermarket
  • Convenience Stores
  • Discount Stores
  • Food and Drink Health Stores
  • Online

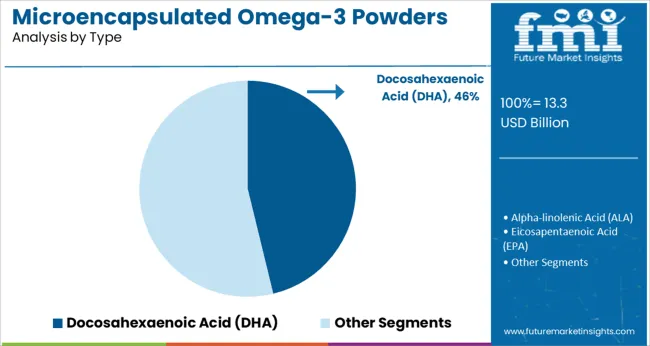
By Type:

  • Alpha-linolenic Acid (ALA)
  • Eicosapentaenoic Acid (EPA)
  • Docosahexaenoic Acid (DHA)

By Region:

  • North America
  • Latin America
  • Western Europe
  • Eastern Europe
  • APEJ
  • Japan
  • Middle East and Africa

Frequently Asked Questions

At what rate will the microencapsulated omega-3 powders market grow?

The global microencapsulated omega-3 powders market is set to surpass US$ 17.4 Bn in 2032.

Which region is set to lead the microencapsulated omega-3 powders market?

North America is set to lead the microencapsulated omega-3 powders market in the forecast period.

Which are some of the renowned companies in the microencapsulated omega-3 powders market?

Clover Corporation, Venketesh Biosciences LLP, Novotech Nutrition, Socius Ingredients, Koninklijke DSM N.V., KD Pharma Group, BASF SE, and Wincobel some of the renowned companies in the microencapsulated omega-3 powders market.

Table of Content

1. Executive Summary

    1.1. Global Market Outlook

    1.2. Demand-side Trends

    1.3. Supply-side Trends

    1.4. Technology Roadmap Analysis

    1.5. Analysis and Recommendations

2. Market Overview

    2.1. Market Coverage / Taxonomy

    2.2. Market Definition / Scope / Limitations

3. Market Background

    3.1. Market Dynamics

        3.1.1. Drivers

        3.1.2. Restraints

        3.1.3. Opportunity

        3.1.4. Trends

    3.2. Scenario Forecast

        3.2.1. Demand in Optimistic Scenario

        3.2.2. Demand in Likely Scenario

        3.2.3. Demand in Conservative Scenario

    3.3. Opportunity Map Analysis

    3.4. Product Life Cycle Analysis

    3.5. Supply Chain Analysis

        3.5.1. Supply Side Participants and their Roles

            3.5.1.1. Producers

            3.5.1.2. Mid-Level Participants (Traders/ Agents/ Brokers)

            3.5.1.3. Wholesalers and Distributors

        3.5.2. Value Added and Value Created at Node in the Supply Chain

        3.5.3. List of Raw Material Suppliers

        3.5.4. List of Existing and Potential Buyer’s

    3.6. Investment Feasibility Matrix

    3.7. Value Chain Analysis

        3.7.1. Profit Margin Analysis

        3.7.2. Wholesalers and Distributors

        3.7.3. Retailers

    3.8. PESTLE and Porter’s Analysis

    3.9. Regulatory Landscape

        3.9.1. By Key Regions

        3.9.2. By Key Countries

    3.10. Regional Parent Market Outlook

    3.11. Production and Consumption Statistics

    3.12. Import and Export Statistics

4. Global Microencapsulated Omega-3 Powders Market Analysis 2017-2021 and Forecast, 2022-2032

    4.1. Historical Market Size Value (US$ Mn) & Volume (Tons) Analysis, 2017-2021

    4.2. Current and Future Market Size Value (US$ Mn) & Volume (Tons) Projections, 2022-2032

        4.2.1. Y-o-Y Growth Trend Analysis

        4.2.2. Absolute $ Opportunity Analysis

5. Global Microencapsulated Omega-3 Powders Market Analysis 2017-2021 and Forecast 2022-2032, By Nature

    5.1. Introduction / Key Findings

    5.2. Historical Market Size Value (US$ Mn) & Volume (Tons) Analysis By Nature, 2017-2021

    5.3. Current and Future Market Size Value (US$ Mn) & Volume (Tons) Analysis and Forecast By Nature, 2022-2032

        5.3.1. Organic

        5.3.2. Conventional

    5.4. Y-o-Y Growth Trend Analysis By Nature, 2017-2021

    5.5. Absolute $ Opportunity Analysis By Nature, 2022-2032

6. Global Microencapsulated Omega-3 Powders Market Analysis 2017-2021 and Forecast 2022-2032, By Distribution Channel

    6.1. Introduction / Key Findings

    6.2. Historical Market Size Value (US$ Mn) & Volume (Tons) Analysis By Distribution Channel, 2017-2021

    6.3. Current and Future Market Size Value (US$ Mn) & Volume (Tons) Analysis and Forecast By Distribution Channel, 2022-2032

        6.3.1. Direct

        6.3.2. Indirect

            6.3.2.1. Store-based

            6.3.2.2. Supermarket/Hypermarket

            6.3.2.3. Convenience Stores

            6.3.2.4. Discount Stores

            6.3.2.5. Food and Drink Health Stores

            6.3.2.6. Online

    6.4. Y-o-Y Growth Trend Analysis By Distribution Channel, 2017-2021

    6.5. Absolute $ Opportunity Analysis By Distribution Channel, 2022-2032

7. Global Microencapsulated Omega-3 Powders Market Analysis 2017-2021 and Forecast 2022-2032, By Type

    7.1. Introduction / Key Findings

    7.2. Historical Market Size Value (US$ Mn) & Volume (Tons) Analysis By Type, 2017-2021

    7.3. Current and Future Market Size Value (US$ Mn) & Volume (Tons) Analysis and Forecast By Type, 2022-2032

        7.3.1. Alpha-linolenic Acid

        7.3.2. Eicosapentaenoic Acid

        7.3.3. Docosahexaenoic Acid

    7.4. Y-o-Y Growth Trend Analysis By Type, 2017-2021

    7.5. Absolute $ Opportunity Analysis By Type, 2022-2032

8. Global Microencapsulated Omega-3 Powders Market Analysis 2017-2021 and Forecast 2022-2032, By Region

    8.1. Introduction

    8.2. Historical Market Size Value (US$ Mn) & Volume (Tons) Analysis By Region, 2017-2021

    8.3. Current Market Size Value (US$ Mn) & Volume (Tons) Analysis and Forecast By Region, 2022-2032

        8.3.1. North America

        8.3.2. Latin America

        8.3.3. Europe

        8.3.4. Asia Pacific

        8.3.5. MEA

    8.4. Market Attractiveness Analysis By Region

9. North America Microencapsulated Omega-3 Powders Market Analysis 2017-2021 and Forecast 2022-2032, By Country

    9.1. Historical Market Size Value (US$ Mn) & Volume (Tons) Trend Analysis By Market Taxonomy, 2017-2021

    9.2. Market Size Value (US$ Mn) & Volume (Tons) Forecast By Market Taxonomy, 2022-2032

        9.2.1. By Country

            9.2.1.1. U.S.

            9.2.1.2. Canada

        9.2.2. By Nature

        9.2.3. By Distribution Channel

        9.2.4. By Type

    9.3. Market Attractiveness Analysis

        9.3.1. By Country

        9.3.2. By Nature

        9.3.3. By Distribution Channel

        9.3.4. By Type

    9.4. Key Takeaways

10. Latin America Microencapsulated Omega-3 Powders Market Analysis 2017-2021 and Forecast 2022-2032, By Country

    10.1. Historical Market Size Value (US$ Mn) & Volume (Tons) Trend Analysis By Market Taxonomy, 2017-2021

    10.2. Market Size Value (US$ Mn) & Volume (Tons) Forecast By Market Taxonomy, 2022-2032

        10.2.1. By Country

            10.2.1.1. Brazil

            10.2.1.2. Mexico

            10.2.1.3. Rest of Latin America

        10.2.2. By Nature

        10.2.3. By Distribution Channel

        10.2.4. By Type

    10.3. Market Attractiveness Analysis

        10.3.1. By Country

        10.3.2. By Nature

        10.3.3. By Distribution Channel

        10.3.4. By Type

    10.4. Key Takeaways

11. Europe Microencapsulated Omega-3 Powders Market Analysis 2017-2021 and Forecast 2022-2032, By Country

    11.1. Historical Market Size Value (US$ Mn) & Volume (Tons) Trend Analysis By Market Taxonomy, 2017-2021

    11.2. Market Size Value (US$ Mn) & Volume (Tons) Forecast By Market Taxonomy, 2022-2032

        11.2.1. By Country

            11.2.1.1. Germany

            11.2.1.2. U.K.

            11.2.1.3. France

            11.2.1.4. Spain

            11.2.1.5. Italy

            11.2.1.6. Rest of Europe

        11.2.2. By Nature

        11.2.3. By Distribution Channel

        11.2.4. By Type

    11.3. Market Attractiveness Analysis

        11.3.1. By Country

        11.3.2. By Nature

        11.3.3. By Distribution Channel

        11.3.4. By Type

    11.4. Key Takeaways

12. Asia Pacific Microencapsulated Omega-3 Powders Market Analysis 2017-2021 and Forecast 2022-2032, By Country

    12.1. Historical Market Size Value (US$ Mn) & Volume (Tons) Trend Analysis By Market Taxonomy, 2017-2021

    12.2. Market Size Value (US$ Mn) & Volume (Tons) Forecast By Market Taxonomy, 2022-2032

        12.2.1. By Country

            12.2.1.1. China

            12.2.1.2. Japan

            12.2.1.3. South Korea

            12.2.1.4. Malaysia

            12.2.1.5. Singapore

            12.2.1.6. Australia

            12.2.1.7. New Zealand

            12.2.1.8. Rest of APAC

        12.2.2. By Nature

        12.2.3. By Distribution Channel

        12.2.4. By Type

    12.3. Market Attractiveness Analysis

        12.3.1. By Country

        12.3.2. By Nature

        12.3.3. By Distribution Channel

        12.3.4. By Type

    12.4. Key Takeaways

13. MEA Microencapsulated Omega-3 Powders Market Analysis 2017-2021 and Forecast 2022-2032, By Country

    13.1. Historical Market Size Value (US$ Mn) & Volume (Tons) Trend Analysis By Market Taxonomy, 2017-2021

    13.2. Market Size Value (US$ Mn) & Volume (Tons) Forecast By Market Taxonomy, 2022-2032

        13.2.1. By Country

            13.2.1.1. GCC Countries

            13.2.1.2. South Africa

            13.2.1.3. Israel

            13.2.1.4. Rest of MEA

        13.2.2. By Nature

        13.2.3. By Distribution Channel

        13.2.4. By Type

    13.3. Market Attractiveness Analysis

        13.3.1. By Country

        13.3.2. By Nature

        13.3.3. By Distribution Channel

        13.3.4. By Type

    13.4. Key Takeaways

14. Key Countries Microencapsulated Omega-3 Powders Market Analysis

    14.1. U.S.

        14.1.1. Pricing Analysis

        14.1.2. Market Share Analysis, 2021

            14.1.2.1. By Nature

            14.1.2.2. By Distribution Channel

            14.1.2.3. By Type

    14.2. Canada

        14.2.1. Pricing Analysis

        14.2.2. Market Share Analysis, 2021

            14.2.2.1. By Nature

            14.2.2.2. By Distribution Channel

            14.2.2.3. By Type

    14.3. Brazil

        14.3.1. Pricing Analysis

        14.3.2. Market Share Analysis, 2021

            14.3.2.1. By Nature

            14.3.2.2. By Distribution Channel

            14.3.2.3. By Type

    14.4. Mexico

        14.4.1. Pricing Analysis

        14.4.2. Market Share Analysis, 2021

            14.4.2.1. By Nature

            14.4.2.2. By Distribution Channel

            14.4.2.3. By Type

    14.5. Germany

        14.5.1. Pricing Analysis

        14.5.2. Market Share Analysis, 2021

            14.5.2.1. By Nature

            14.5.2.2. By Distribution Channel

            14.5.2.3. By Type

    14.6. U.K.

        14.6.1. Pricing Analysis

        14.6.2. Market Share Analysis, 2021

            14.6.2.1. By Nature

            14.6.2.2. By Distribution Channel

            14.6.2.3. By Type

    14.7. France

        14.7.1. Pricing Analysis

        14.7.2. Market Share Analysis, 2021

            14.7.2.1. By Nature

            14.7.2.2. By Distribution Channel

            14.7.2.3. By Type

    14.8. Spain

        14.8.1. Pricing Analysis

        14.8.2. Market Share Analysis, 2021

            14.8.2.1. By Nature

            14.8.2.2. By Distribution Channel

            14.8.2.3. By Type

    14.9. Italy

        14.9.1. Pricing Analysis

        14.9.2. Market Share Analysis, 2021

            14.9.2.1. By Nature

            14.9.2.2. By Distribution Channel

            14.9.2.3. By Type

    14.10. China

        14.10.1. Pricing Analysis

        14.10.2. Market Share Analysis, 2021

            14.10.2.1. By Nature

            14.10.2.2. By Distribution Channel

            14.10.2.3. By Type

    14.11. Japan

        14.11.1. Pricing Analysis

        14.11.2. Market Share Analysis, 2021

            14.11.2.1. By Nature

            14.11.2.2. By Distribution Channel

            14.11.2.3. By Type

    14.12. South Korea

        14.12.1. Pricing Analysis

        14.12.2. Market Share Analysis, 2021

            14.12.2.1. By Nature

            14.12.2.2. By Distribution Channel

            14.12.2.3. By Type

    14.13. Malaysia

        14.13.1. Pricing Analysis

        14.13.2. Market Share Analysis, 2021

            14.13.2.1. By Nature

            14.13.2.2. By Distribution Channel

            14.13.2.3. By Type

    14.14. Singapore

        14.14.1. Pricing Analysis

        14.14.2. Market Share Analysis, 2021

            14.14.2.1. By Nature

            14.14.2.2. By Distribution Channel

            14.14.2.3. By Type

    14.15. Australia

        14.15.1. Pricing Analysis

        14.15.2. Market Share Analysis, 2021

            14.15.2.1. By Nature

            14.15.2.2. By Distribution Channel

            14.15.2.3. By Type

    14.16. New Zealand

        14.16.1. Pricing Analysis

        14.16.2. Market Share Analysis, 2021

            14.16.2.1. By Nature

            14.16.2.2. By Distribution Channel

            14.16.2.3. By Type

    14.17. GCC Countries

        14.17.1. Pricing Analysis

        14.17.2. Market Share Analysis, 2021

            14.17.2.1. By Nature

            14.17.2.2. By Distribution Channel

            14.17.2.3. By Type

    14.18. South Africa

        14.18.1. Pricing Analysis

        14.18.2. Market Share Analysis, 2021

            14.18.2.1. By Nature

            14.18.2.2. By Distribution Channel

            14.18.2.3. By Type

    14.19. Israel

        14.19.1. Pricing Analysis

        14.19.2. Market Share Analysis, 2021

            14.19.2.1. By Nature

            14.19.2.2. By Distribution Channel

            14.19.2.3. By Type

15. Market Structure Analysis

    15.1. Competition Dashboard

    15.2. Competition Benchmarking

    15.3. Market Share Analysis of Top Players

        15.3.1. By Regional

        15.3.2. By Nature

        15.3.3. By Distribution Channel

        15.3.4. By Type

16. Competition Analysis

    16.1. Competition Deep Dive

        16.1.1. KD Pharma Group

            16.1.1.1. Overview

            16.1.1.2. Product Portfolio

            16.1.1.3. Profitability by Market Segments

            16.1.1.4. Sales Footprint

            16.1.1.5. Strategy Overview

                16.1.1.5.1. Marketing Strategy

                16.1.1.5.2. Product Strategy

                16.1.1.5.3. Channel Strategy

        16.1.2. Venketesh Biosciences LLP

            16.1.2.1. Overview

            16.1.2.2. Product Portfolio

            16.1.2.3. Profitability by Market Segments

            16.1.2.4. Sales Footprint

            16.1.2.5. Strategy Overview

                16.1.2.5.1. Marketing Strategy

                16.1.2.5.2. Product Strategy

                16.1.2.5.3. Channel Strategy

        16.1.3. Wincobel

            16.1.3.1. Overview

            16.1.3.2. Product Portfolio

            16.1.3.3. Profitability by Market Segments

            16.1.3.4. Sales Footprint

            16.1.3.5. Strategy Overview

                16.1.3.5.1. Marketing Strategy

                16.1.3.5.2. Product Strategy

                16.1.3.5.3. Channel Strategy

        16.1.4. Stepan Company

            16.1.4.1. Overview

            16.1.4.2. Product Portfolio

            16.1.4.3. Profitability by Market Segments

            16.1.4.4. Sales Footprint

            16.1.4.5. Strategy Overview

                16.1.4.5.1. Marketing Strategy

                16.1.4.5.2. Product Strategy

                16.1.4.5.3. Channel Strategy

        16.1.5. Socius Ingredients

            16.1.5.1. Overview

            16.1.5.2. Product Portfolio

            16.1.5.3. Profitability by Market Segments

            16.1.5.4. Sales Footprint

            16.1.5.5. Strategy Overview

                16.1.5.5.1. Marketing Strategy

                16.1.5.5.2. Product Strategy

                16.1.5.5.3. Channel Strategy

        16.1.6. Benexia

            16.1.6.1. Overview

            16.1.6.2. Product Portfolio

            16.1.6.3. Profitability by Market Segments

            16.1.6.4. Sales Footprint

            16.1.6.5. Strategy Overview

                16.1.6.5.1. Marketing Strategy

                16.1.6.5.2. Product Strategy

                16.1.6.5.3. Channel Strategy

        16.1.7. Biosearch

            16.1.7.1. Overview

            16.1.7.2. Product Portfolio

            16.1.7.3. Profitability by Market Segments

            16.1.7.4. Sales Footprint

            16.1.7.5. Strategy Overview

                16.1.7.5.1. Marketing Strategy

                16.1.7.5.2. Product Strategy

                16.1.7.5.3. Channel Strategy

        16.1.8. Glanbia Nutritionals

            16.1.8.1. Overview

            16.1.8.2. Product Portfolio

            16.1.8.3. Profitability by Market Segments

            16.1.8.4. Sales Footprint

            16.1.8.5. Strategy Overview

                16.1.8.5.1. Marketing Strategy

                16.1.8.5.2. Product Strategy

                16.1.8.5.3. Channel Strategy

        16.1.9. Clover Corporation

            16.1.9.1. Overview

            16.1.9.2. Product Portfolio

            16.1.9.3. Profitability by Market Segments

            16.1.9.4. Sales Footprint

            16.1.9.5. Strategy Overview

                16.1.9.5.1. Marketing Strategy

                16.1.9.5.2. Product Strategy

                16.1.9.5.3. Channel Strategy

        16.1.10. Skuny Bioscience Co., Ltd.

            16.1.10.1. Overview

            16.1.10.2. Product Portfolio

            16.1.10.3. Profitability by Market Segments

            16.1.10.4. Sales Footprint

            16.1.10.5. Strategy Overview

                16.1.10.5.1. Marketing Strategy

                16.1.10.5.2. Product Strategy

                16.1.10.5.3. Channel Strategy

        16.1.11. BASF SE

            16.1.11.1. Overview

            16.1.11.2. Product Portfolio

            16.1.11.3. Profitability by Market Segments

            16.1.11.4. Sales Footprint

            16.1.11.5. Strategy Overview

                16.1.11.5.1. Marketing Strategy

                16.1.11.5.2. Product Strategy

                16.1.11.5.3. Channel Strategy

        16.1.12. Novotech Nutrition

            16.1.12.1. Overview

            16.1.12.2. Product Portfolio

            16.1.12.3. Profitability by Market Segments

            16.1.12.4. Sales Footprint

            16.1.12.5. Strategy Overview

                16.1.12.5.1. Marketing Strategy

                16.1.12.5.2. Product Strategy

                16.1.12.5.3. Channel Strategy

        16.1.13. Koninklijke DSM N.V.

            16.1.13.1. Overview

            16.1.13.2. Product Portfolio

            16.1.13.3. Profitability by Market Segments

            16.1.13.4. Sales Footprint

            16.1.13.5. Strategy Overview

                16.1.13.5.1. Marketing Strategy

                16.1.13.5.2. Product Strategy

                16.1.13.5.3. Channel Strategy

17. Assumptions & Acronyms Used

18. Research Methodology

List of Tables

Table 1: Global Microencapsulated Omega-3 Powders Market Value (US$ Mn) Forecast by Region, 2017-2032

Table 2: Global Microencapsulated Omega-3 Powders Market Volume (Tons) Forecast by Region, 2017-2032

Table 3: Global Microencapsulated Omega-3 Powders Market Value (US$ Mn) Forecast by Nature, 2017-2032

Table 4: Global Microencapsulated Omega-3 Powders Market Volume (Tons) Forecast by Nature, 2017-2032

Table 5: Global Microencapsulated Omega-3 Powders Market Value (US$ Mn) Forecast by Distribution Channel, 2017-2032

Table 6: Global Microencapsulated Omega-3 Powders Market Volume (Tons) Forecast by Distribution Channel, 2017-2032

Table 7: Global Microencapsulated Omega-3 Powders Market Value (US$ Mn) Forecast by Type, 2017-2032

Table 8: Global Microencapsulated Omega-3 Powders Market Volume (Tons) Forecast by Type, 2017-2032

Table 9: North America Microencapsulated Omega-3 Powders Market Value (US$ Mn) Forecast by Country, 2017-2032

Table 10: North America Microencapsulated Omega-3 Powders Market Volume (Tons) Forecast by Country, 2017-2032

Table 11: North America Microencapsulated Omega-3 Powders Market Value (US$ Mn) Forecast by Nature, 2017-2032

Table 12: North America Microencapsulated Omega-3 Powders Market Volume (Tons) Forecast by Nature, 2017-2032

Table 13: North America Microencapsulated Omega-3 Powders Market Value (US$ Mn) Forecast by Distribution Channel, 2017-2032

Table 14: North America Microencapsulated Omega-3 Powders Market Volume (Tons) Forecast by Distribution Channel, 2017-2032

Table 15: North America Microencapsulated Omega-3 Powders Market Value (US$ Mn) Forecast by Type, 2017-2032

Table 16: North America Microencapsulated Omega-3 Powders Market Volume (Tons) Forecast by Type, 2017-2032

Table 17: Latin America Microencapsulated Omega-3 Powders Market Value (US$ Mn) Forecast by Country, 2017-2032

Table 18: Latin America Microencapsulated Omega-3 Powders Market Volume (Tons) Forecast by Country, 2017-2032

Table 19: Latin America Microencapsulated Omega-3 Powders Market Value (US$ Mn) Forecast by Nature, 2017-2032

Table 20: Latin America Microencapsulated Omega-3 Powders Market Volume (Tons) Forecast by Nature, 2017-2032

Table 21: Latin America Microencapsulated Omega-3 Powders Market Value (US$ Mn) Forecast by Distribution Channel, 2017-2032

Table 22: Latin America Microencapsulated Omega-3 Powders Market Volume (Tons) Forecast by Distribution Channel, 2017-2032

Table 23: Latin America Microencapsulated Omega-3 Powders Market Value (US$ Mn) Forecast by Type, 2017-2032

Table 24: Latin America Microencapsulated Omega-3 Powders Market Volume (Tons) Forecast by Type, 2017-2032

Table 25: Europe Microencapsulated Omega-3 Powders Market Value (US$ Mn) Forecast by Country, 2017-2032

Table 26: Europe Microencapsulated Omega-3 Powders Market Volume (Tons) Forecast by Country, 2017-2032

Table 27: Europe Microencapsulated Omega-3 Powders Market Value (US$ Mn) Forecast by Nature, 2017-2032

Table 28: Europe Microencapsulated Omega-3 Powders Market Volume (Tons) Forecast by Nature, 2017-2032

Table 29: Europe Microencapsulated Omega-3 Powders Market Value (US$ Mn) Forecast by Distribution Channel, 2017-2032

Table 30: Europe Microencapsulated Omega-3 Powders Market Volume (Tons) Forecast by Distribution Channel, 2017-2032

Table 31: Europe Microencapsulated Omega-3 Powders Market Value (US$ Mn) Forecast by Type, 2017-2032

Table 32: Europe Microencapsulated Omega-3 Powders Market Volume (Tons) Forecast by Type, 2017-2032

Table 33: Asia Pacific Microencapsulated Omega-3 Powders Market Value (US$ Mn) Forecast by Country, 2017-2032

Table 34: Asia Pacific Microencapsulated Omega-3 Powders Market Volume (Tons) Forecast by Country, 2017-2032

Table 35: Asia Pacific Microencapsulated Omega-3 Powders Market Value (US$ Mn) Forecast by Nature, 2017-2032

Table 36: Asia Pacific Microencapsulated Omega-3 Powders Market Volume (Tons) Forecast by Nature, 2017-2032

Table 37: Asia Pacific Microencapsulated Omega-3 Powders Market Value (US$ Mn) Forecast by Distribution Channel, 2017-2032

Table 38: Asia Pacific Microencapsulated Omega-3 Powders Market Volume (Tons) Forecast by Distribution Channel, 2017-2032

Table 39: Asia Pacific Microencapsulated Omega-3 Powders Market Value (US$ Mn) Forecast by Type, 2017-2032

Table 40: Asia Pacific Microencapsulated Omega-3 Powders Market Volume (Tons) Forecast by Type, 2017-2032

Table 41: MEA Microencapsulated Omega-3 Powders Market Value (US$ Mn) Forecast by Country, 2017-2032

Table 42: MEA Microencapsulated Omega-3 Powders Market Volume (Tons) Forecast by Country, 2017-2032

Table 43: MEA Microencapsulated Omega-3 Powders Market Value (US$ Mn) Forecast by Nature, 2017-2032

Table 44: MEA Microencapsulated Omega-3 Powders Market Volume (Tons) Forecast by Nature, 2017-2032

Table 45: MEA Microencapsulated Omega-3 Powders Market Value (US$ Mn) Forecast by Distribution Channel, 2017-2032

Table 46: MEA Microencapsulated Omega-3 Powders Market Volume (Tons) Forecast by Distribution Channel, 2017-2032

Table 47: MEA Microencapsulated Omega-3 Powders Market Value (US$ Mn) Forecast by Type, 2017-2032

Table 48: MEA Microencapsulated Omega-3 Powders Market Volume (Tons) Forecast by Type, 2017-2032

List of Charts

Figure 1: Global Microencapsulated Omega-3 Powders Market Value (US$ Mn) by Nature, 2022-2032

Figure 2: Global Microencapsulated Omega-3 Powders Market Value (US$ Mn) by Distribution Channel, 2022-2032

Figure 3: Global Microencapsulated Omega-3 Powders Market Value (US$ Mn) by Type, 2022-2032

Figure 4: Global Microencapsulated Omega-3 Powders Market Value (US$ Mn) by Region, 2022-2032

Figure 5: Global Microencapsulated Omega-3 Powders Market Value (US$ Mn) Analysis by Region, 2017-2032

Figure 6: Global Microencapsulated Omega-3 Powders Market Volume (Tons) Analysis by Region, 2017-2032

Figure 7: Global Microencapsulated Omega-3 Powders Market Value Share (%) and BPS Analysis by Region, 2022-2032

Figure 8: Global Microencapsulated Omega-3 Powders Market Y-o-Y Growth (%) Projections by Region, 2022-2032

Figure 9: Global Microencapsulated Omega-3 Powders Market Value (US$ Mn) Analysis by Nature, 2017-2032

Figure 10: Global Microencapsulated Omega-3 Powders Market Volume (Tons) Analysis by Nature, 2017-2032

Figure 11: Global Microencapsulated Omega-3 Powders Market Value Share (%) and BPS Analysis by Nature, 2022-2032

Figure 12: Global Microencapsulated Omega-3 Powders Market Y-o-Y Growth (%) Projections by Nature, 2022-2032

Figure 13: Global Microencapsulated Omega-3 Powders Market Value (US$ Mn) Analysis by Distribution Channel, 2017-2032

Figure 14: Global Microencapsulated Omega-3 Powders Market Volume (Tons) Analysis by Distribution Channel, 2017-2032

Figure 15: Global Microencapsulated Omega-3 Powders Market Value Share (%) and BPS Analysis by Distribution Channel, 2022-2032

Figure 16: Global Microencapsulated Omega-3 Powders Market Y-o-Y Growth (%) Projections by Distribution Channel, 2022-2032

Figure 17: Global Microencapsulated Omega-3 Powders Market Value (US$ Mn) Analysis by Type, 2017-2032

Figure 18: Global Microencapsulated Omega-3 Powders Market Volume (Tons) Analysis by Type, 2017-2032

Figure 19: Global Microencapsulated Omega-3 Powders Market Value Share (%) and BPS Analysis by Type, 2022-2032

Figure 20: Global Microencapsulated Omega-3 Powders Market Y-o-Y Growth (%) Projections by Type, 2022-2032

Figure 21: Global Microencapsulated Omega-3 Powders Market Attractiveness by Nature, 2022-2032

Figure 22: Global Microencapsulated Omega-3 Powders Market Attractiveness by Distribution Channel, 2022-2032

Figure 23: Global Microencapsulated Omega-3 Powders Market Attractiveness by Type, 2022-2032

Figure 24: Global Microencapsulated Omega-3 Powders Market Attractiveness by Region, 2022-2032

Figure 25: North America Microencapsulated Omega-3 Powders Market Value (US$ Mn) by Nature, 2022-2032

Figure 26: North America Microencapsulated Omega-3 Powders Market Value (US$ Mn) by Distribution Channel, 2022-2032

Figure 27: North America Microencapsulated Omega-3 Powders Market Value (US$ Mn) by Type, 2022-2032

Figure 28: North America Microencapsulated Omega-3 Powders Market Value (US$ Mn) by Country, 2022-2032

Figure 29: North America Microencapsulated Omega-3 Powders Market Value (US$ Mn) Analysis by Country, 2017-2032

Figure 30: North America Microencapsulated Omega-3 Powders Market Volume (Tons) Analysis by Country, 2017-2032

Figure 31: North America Microencapsulated Omega-3 Powders Market Value Share (%) and BPS Analysis by Country, 2022-2032

Figure 32: North America Microencapsulated Omega-3 Powders Market Y-o-Y Growth (%) Projections by Country, 2022-2032

Figure 33: North America Microencapsulated Omega-3 Powders Market Value (US$ Mn) Analysis by Nature, 2017-2032

Figure 34: North America Microencapsulated Omega-3 Powders Market Volume (Tons) Analysis by Nature, 2017-2032

Figure 35: North America Microencapsulated Omega-3 Powders Market Value Share (%) and BPS Analysis by Nature, 2022-2032

Figure 36: North America Microencapsulated Omega-3 Powders Market Y-o-Y Growth (%) Projections by Nature, 2022-2032

Figure 37: North America Microencapsulated Omega-3 Powders Market Value (US$ Mn) Analysis by Distribution Channel, 2017-2032

Figure 38: North America Microencapsulated Omega-3 Powders Market Volume (Tons) Analysis by Distribution Channel, 2017-2032

Figure 39: North America Microencapsulated Omega-3 Powders Market Value Share (%) and BPS Analysis by Distribution Channel, 2022-2032

Figure 40: North America Microencapsulated Omega-3 Powders Market Y-o-Y Growth (%) Projections by Distribution Channel, 2022-2032

Figure 41: North America Microencapsulated Omega-3 Powders Market Value (US$ Mn) Analysis by Type, 2017-2032

Figure 42: North America Microencapsulated Omega-3 Powders Market Volume (Tons) Analysis by Type, 2017-2032

Figure 43: North America Microencapsulated Omega-3 Powders Market Value Share (%) and BPS Analysis by Type, 2022-2032

Figure 44: North America Microencapsulated Omega-3 Powders Market Y-o-Y Growth (%) Projections by Type, 2022-2032

Figure 45: North America Microencapsulated Omega-3 Powders Market Attractiveness by Nature, 2022-2032

Figure 46: North America Microencapsulated Omega-3 Powders Market Attractiveness by Distribution Channel, 2022-2032

Figure 47: North America Microencapsulated Omega-3 Powders Market Attractiveness by Type, 2022-2032

Figure 48: North America Microencapsulated Omega-3 Powders Market Attractiveness by Country, 2022-2032

Figure 49: Latin America Microencapsulated Omega-3 Powders Market Value (US$ Mn) by Nature, 2022-2032

Figure 50: Latin America Microencapsulated Omega-3 Powders Market Value (US$ Mn) by Distribution Channel, 2022-2032

Figure 51: Latin America Microencapsulated Omega-3 Powders Market Value (US$ Mn) by Type, 2022-2032

Figure 52: Latin America Microencapsulated Omega-3 Powders Market Value (US$ Mn) by Country, 2022-2032

Figure 53: Latin America Microencapsulated Omega-3 Powders Market Value (US$ Mn) Analysis by Country, 2017-2032

Figure 54: Latin America Microencapsulated Omega-3 Powders Market Volume (Tons) Analysis by Country, 2017-2032

Figure 55: Latin America Microencapsulated Omega-3 Powders Market Value Share (%) and BPS Analysis by Country, 2022-2032

Figure 56: Latin America Microencapsulated Omega-3 Powders Market Y-o-Y Growth (%) Projections by Country, 2022-2032

Figure 57: Latin America Microencapsulated Omega-3 Powders Market Value (US$ Mn) Analysis by Nature, 2017-2032

Figure 58: Latin America Microencapsulated Omega-3 Powders Market Volume (Tons) Analysis by Nature, 2017-2032

Figure 59: Latin America Microencapsulated Omega-3 Powders Market Value Share (%) and BPS Analysis by Nature, 2022-2032

Figure 60: Latin America Microencapsulated Omega-3 Powders Market Y-o-Y Growth (%) Projections by Nature, 2022-2032

Figure 61: Latin America Microencapsulated Omega-3 Powders Market Value (US$ Mn) Analysis by Distribution Channel, 2017-2032

Figure 62: Latin America Microencapsulated Omega-3 Powders Market Volume (Tons) Analysis by Distribution Channel, 2017-2032

Figure 63: Latin America Microencapsulated Omega-3 Powders Market Value Share (%) and BPS Analysis by Distribution Channel, 2022-2032

Figure 64: Latin America Microencapsulated Omega-3 Powders Market Y-o-Y Growth (%) Projections by Distribution Channel, 2022-2032

Figure 65: Latin America Microencapsulated Omega-3 Powders Market Value (US$ Mn) Analysis by Type, 2017-2032

Figure 66: Latin America Microencapsulated Omega-3 Powders Market Volume (Tons) Analysis by Type, 2017-2032

Figure 67: Latin America Microencapsulated Omega-3 Powders Market Value Share (%) and BPS Analysis by Type, 2022-2032

Figure 68: Latin America Microencapsulated Omega-3 Powders Market Y-o-Y Growth (%) Projections by Type, 2022-2032

Figure 69: Latin America Microencapsulated Omega-3 Powders Market Attractiveness by Nature, 2022-2032

Figure 70: Latin America Microencapsulated Omega-3 Powders Market Attractiveness by Distribution Channel, 2022-2032

Figure 71: Latin America Microencapsulated Omega-3 Powders Market Attractiveness by Type, 2022-2032

Figure 72: Latin America Microencapsulated Omega-3 Powders Market Attractiveness by Country, 2022-2032

Figure 73: Europe Microencapsulated Omega-3 Powders Market Value (US$ Mn) by Nature, 2022-2032

Figure 74: Europe Microencapsulated Omega-3 Powders Market Value (US$ Mn) by Distribution Channel, 2022-2032

Figure 75: Europe Microencapsulated Omega-3 Powders Market Value (US$ Mn) by Type, 2022-2032

Figure 76: Europe Microencapsulated Omega-3 Powders Market Value (US$ Mn) by Country, 2022-2032

Figure 77: Europe Microencapsulated Omega-3 Powders Market Value (US$ Mn) Analysis by Country, 2017-2032

Figure 78: Europe Microencapsulated Omega-3 Powders Market Volume (Tons) Analysis by Country, 2017-2032

Figure 79: Europe Microencapsulated Omega-3 Powders Market Value Share (%) and BPS Analysis by Country, 2022-2032

Figure 80: Europe Microencapsulated Omega-3 Powders Market Y-o-Y Growth (%) Projections by Country, 2022-2032

Figure 81: Europe Microencapsulated Omega-3 Powders Market Value (US$ Mn) Analysis by Nature, 2017-2032

Figure 82: Europe Microencapsulated Omega-3 Powders Market Volume (Tons) Analysis by Nature, 2017-2032

Figure 83: Europe Microencapsulated Omega-3 Powders Market Value Share (%) and BPS Analysis by Nature, 2022-2032

Figure 84: Europe Microencapsulated Omega-3 Powders Market Y-o-Y Growth (%) Projections by Nature, 2022-2032

Figure 85: Europe Microencapsulated Omega-3 Powders Market Value (US$ Mn) Analysis by Distribution Channel, 2017-2032

Figure 86: Europe Microencapsulated Omega-3 Powders Market Volume (Tons) Analysis by Distribution Channel, 2017-2032

Figure 87: Europe Microencapsulated Omega-3 Powders Market Value Share (%) and BPS Analysis by Distribution Channel, 2022-2032

Figure 88: Europe Microencapsulated Omega-3 Powders Market Y-o-Y Growth (%) Projections by Distribution Channel, 2022-2032

Figure 89: Europe Microencapsulated Omega-3 Powders Market Value (US$ Mn) Analysis by Type, 2017-2032

Figure 90: Europe Microencapsulated Omega-3 Powders Market Volume (Tons) Analysis by Type, 2017-2032

Figure 91: Europe Microencapsulated Omega-3 Powders Market Value Share (%) and BPS Analysis by Type, 2022-2032

Figure 92: Europe Microencapsulated Omega-3 Powders Market Y-o-Y Growth (%) Projections by Type, 2022-2032

Figure 93: Europe Microencapsulated Omega-3 Powders Market Attractiveness by Nature, 2022-2032

Figure 94: Europe Microencapsulated Omega-3 Powders Market Attractiveness by Distribution Channel, 2022-2032

Figure 95: Europe Microencapsulated Omega-3 Powders Market Attractiveness by Type, 2022-2032

Figure 96: Europe Microencapsulated Omega-3 Powders Market Attractiveness by Country, 2022-2032

Figure 97: Asia Pacific Microencapsulated Omega-3 Powders Market Value (US$ Mn) by Nature, 2022-2032

Figure 98: Asia Pacific Microencapsulated Omega-3 Powders Market Value (US$ Mn) by Distribution Channel, 2022-2032

Figure 99: Asia Pacific Microencapsulated Omega-3 Powders Market Value (US$ Mn) by Type, 2022-2032

Figure 100: Asia Pacific Microencapsulated Omega-3 Powders Market Value (US$ Mn) by Country, 2022-2032

Figure 101: Asia Pacific Microencapsulated Omega-3 Powders Market Value (US$ Mn) Analysis by Country, 2017-2032

Figure 102: Asia Pacific Microencapsulated Omega-3 Powders Market Volume (Tons) Analysis by Country, 2017-2032

Figure 103: Asia Pacific Microencapsulated Omega-3 Powders Market Value Share (%) and BPS Analysis by Country, 2022-2032

Figure 104: Asia Pacific Microencapsulated Omega-3 Powders Market Y-o-Y Growth (%) Projections by Country, 2022-2032

Figure 105: Asia Pacific Microencapsulated Omega-3 Powders Market Value (US$ Mn) Analysis by Nature, 2017-2032

Figure 106: Asia Pacific Microencapsulated Omega-3 Powders Market Volume (Tons) Analysis by Nature, 2017-2032

Figure 107: Asia Pacific Microencapsulated Omega-3 Powders Market Value Share (%) and BPS Analysis by Nature, 2022-2032

Figure 108: Asia Pacific Microencapsulated Omega-3 Powders Market Y-o-Y Growth (%) Projections by Nature, 2022-2032

Figure 109: Asia Pacific Microencapsulated Omega-3 Powders Market Value (US$ Mn) Analysis by Distribution Channel, 2017-2032

Figure 110: Asia Pacific Microencapsulated Omega-3 Powders Market Volume (Tons) Analysis by Distribution Channel, 2017-2032

Figure 111: Asia Pacific Microencapsulated Omega-3 Powders Market Value Share (%) and BPS Analysis by Distribution Channel, 2022-2032

Figure 112: Asia Pacific Microencapsulated Omega-3 Powders Market Y-o-Y Growth (%) Projections by Distribution Channel, 2022-2032

Figure 113: Asia Pacific Microencapsulated Omega-3 Powders Market Value (US$ Mn) Analysis by Type, 2017-2032

Figure 114: Asia Pacific Microencapsulated Omega-3 Powders Market Volume (Tons) Analysis by Type, 2017-2032

Figure 115: Asia Pacific Microencapsulated Omega-3 Powders Market Value Share (%) and BPS Analysis by Type, 2022-2032

Figure 116: Asia Pacific Microencapsulated Omega-3 Powders Market Y-o-Y Growth (%) Projections by Type, 2022-2032

Figure 117: Asia Pacific Microencapsulated Omega-3 Powders Market Attractiveness by Nature, 2022-2032

Figure 118: Asia Pacific Microencapsulated Omega-3 Powders Market Attractiveness by Distribution Channel, 2022-2032

Figure 119: Asia Pacific Microencapsulated Omega-3 Powders Market Attractiveness by Type, 2022-2032

Figure 120: Asia Pacific Microencapsulated Omega-3 Powders Market Attractiveness by Country, 2022-2032

Figure 121: MEA Microencapsulated Omega-3 Powders Market Value (US$ Mn) by Nature, 2022-2032

Figure 122: MEA Microencapsulated Omega-3 Powders Market Value (US$ Mn) by Distribution Channel, 2022-2032

Figure 123: MEA Microencapsulated Omega-3 Powders Market Value (US$ Mn) by Type, 2022-2032

Figure 124: MEA Microencapsulated Omega-3 Powders Market Value (US$ Mn) by Country, 2022-2032

Figure 125: MEA Microencapsulated Omega-3 Powders Market Value (US$ Mn) Analysis by Country, 2017-2032

Figure 126: MEA Microencapsulated Omega-3 Powders Market Volume (Tons) Analysis by Country, 2017-2032

Figure 127: MEA Microencapsulated Omega-3 Powders Market Value Share (%) and BPS Analysis by Country, 2022-2032

Figure 128: MEA Microencapsulated Omega-3 Powders Market Y-o-Y Growth (%) Projections by Country, 2022-2032

Figure 129: MEA Microencapsulated Omega-3 Powders Market Value (US$ Mn) Analysis by Nature, 2017-2032

Figure 130: MEA Microencapsulated Omega-3 Powders Market Volume (Tons) Analysis by Nature, 2017-2032

Figure 131: MEA Microencapsulated Omega-3 Powders Market Value Share (%) and BPS Analysis by Nature, 2022-2032

Figure 132: MEA Microencapsulated Omega-3 Powders Market Y-o-Y Growth (%) Projections by Nature, 2022-2032

Figure 133: MEA Microencapsulated Omega-3 Powders Market Value (US$ Mn) Analysis by Distribution Channel, 2017-2032

Figure 134: MEA Microencapsulated Omega-3 Powders Market Volume (Tons) Analysis by Distribution Channel, 2017-2032

Figure 135: MEA Microencapsulated Omega-3 Powders Market Value Share (%) and BPS Analysis by Distribution Channel, 2022-2032

Figure 136: MEA Microencapsulated Omega-3 Powders Market Y-o-Y Growth (%) Projections by Distribution Channel, 2022-2032

Figure 137: MEA Microencapsulated Omega-3 Powders Market Value (US$ Mn) Analysis by Type, 2017-2032

Figure 138: MEA Microencapsulated Omega-3 Powders Market Volume (Tons) Analysis by Type, 2017-2032

Figure 139: MEA Microencapsulated Omega-3 Powders Market Value Share (%) and BPS Analysis by Type, 2022-2032

Figure 140: MEA Microencapsulated Omega-3 Powders Market Y-o-Y Growth (%) Projections by Type, 2022-2032

Figure 141: MEA Microencapsulated Omega-3 Powders Market Attractiveness by Nature, 2022-2032

Figure 142: MEA Microencapsulated Omega-3 Powders Market Attractiveness by Distribution Channel, 2022-2032

Figure 143: MEA Microencapsulated Omega-3 Powders Market Attractiveness by Type, 2022-2032

Figure 144: MEA Microencapsulated Omega-3 Powders Market Attractiveness by Country, 2022-2032

Recommendations

Food and Beverage

Omega-3 Ingredients Market

Published : December 2022

Food and Beverage

Algae Omega Market

Published : October 2022

Food and Beverage

Omega-3 Concentrates Market

Published : July 2022

Explore Food and Beverage Insights

View Reports

Microencapsulated Omega-3 Powders Market