Micro Irrigation System Market Size and Share Forecast Outlook 2025 to 2035

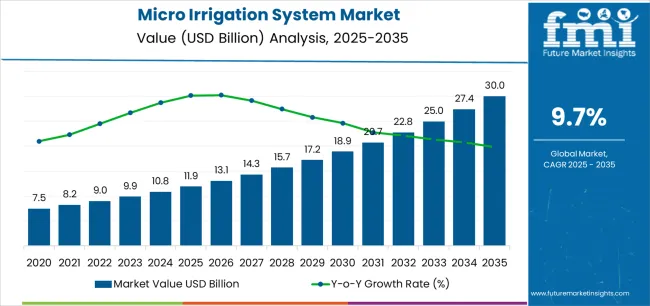
The global micro irrigation system market is projected to reach USD 30.1 billion by 2035, recording an absolute increase of USD 18.2 billion over the forecast period. The market is valued at USD 11.9 billion in 2025 and is set to rise at a CAGR of 9.7% during the assessment period. The overall market size is expected to grow by nearly 2.5 times during the same period, supported by increasing demand for water-efficient agriculture solutions worldwide, driving demand for precision irrigation technologies and increasing investments in sustainable farming and water conservation projects globally. However, high initial installation costs and limited awareness among smallholder farmers may pose challenges to market expansion.
Quick Stats for Micro Irrigation System Market

  • Micro Irrigation System Market Value (2025): USD 11.9 billion
  • Micro Irrigation System Market Forecast Value (2035): USD 30.1 billion
  • Micro Irrigation System Market Forecast CAGR: 9.7%
  • Leading Mechanism Type in Micro Irrigation System Market: Drip Irrigation Systems
  • Key Growth Regions in Micro Irrigation System Market: Asia Pacific, North America, and Europe
  • Top Key Players in Micro Irrigation System Market: Netafim Ltd., Jain Irrigation Systems Ltd., The Toro Company, Rain Bird Corporation, Hunter Industries, Valmont Industries, Rivulis Irrigation Ltd., Lindsay Corporation, Reinke Manufacturing Co., EPC Industries Ltd.
  • Micro Irrigation System Market Year-over-Year Forecast (2025-2035)

Micro Irrigation System Market Market Value Analysis

Between 2025 and 2030, the micro irrigation system market is projected to expand from USD 11.9 billion to USD 19 billion, resulting in a value increase of USD 7.1 billion, which represents 39.0% of the total forecast growth for the decade. This phase of development will be shaped by rising demand for water conservation and precision agriculture solutions, product innovation in smart irrigation controllers and sensor-based systems, as well as expanding integration with IoT technologies and automated farming initiatives. Companies are establishing competitive positions through investment in advanced drip line technologies, sustainable water management solutions, and strategic market expansion across orchards, vineyards, and field crop applications.

From 2030 to 2035, the market is forecast to grow from USD 19.0 billion to USD 30.1 billion, adding another USD 11.1 billion, which constitutes 61.0% of the overall ten-year expansion. This period is expected to be characterized by the expansion of specialized micro irrigation systems, including hybrid dripline designs and AI-based irrigation optimization platforms tailored for specific crop requirements, strategic collaborations between irrigation equipment manufacturers and farming communities, and an enhanced focus on water use efficiency and climate resilience. The growing emphasis on precision agriculture and smart farming will drive demand for advanced, high-performance micro irrigation solutions across diverse agricultural applications.

Micro Irrigation System Market Key Takeaways

Metric Value
Market Value (2025) USD 11.9 billion
Market Forecast Value (2035) USD 30.1 billion
Forecast CAGR (2025-2035) 9.7%

Why is the Micro Irrigation System Market Growing?

The micro irrigation system market grows by enabling farmers to achieve superior water use efficiency and sustainable crop productivity while addressing global water scarcity challenges. Agricultural producers face mounting pressure to optimize water consumption and improve yield quality, with micro irrigation solutions typically providing 40-60% water savings compared to conventional irrigation methods, making these systems essential for long-term agricultural sustainability. The precision agriculture movement's need for automated water delivery creates demand for advanced micro irrigation solutions that can enhance crop performance, reduce labor requirements, and ensure consistent production across diverse climatic conditions.

Government initiatives promoting water conservation programs and sustainable farming standards drive adoption in orchards, vineyards, field crops, and protected cultivation applications, where water management has a direct impact on yield quality and farm profitability. The global shift toward climate-resilient agriculture and efficient resource utilization accelerates micro irrigation demand as farmers seek alternatives to flood and furrow irrigation that waste water and nutrients. However, high upfront investment costs ranging from USD 1,200 to USD 2,500 per hectare and technical complexity in system design may limit adoption rates among resource-constrained smallholder farmers and regions with underdeveloped irrigation infrastructure.

Segmental Analysis

The market is segmented by mechanism, component, crop type, farming technique, end user, and region. By mechanism, the market is divided into drip irrigation systems, sprinkler systems, bubbler irrigation, and spray irrigation. Based on component, the market is categorized into drippers and emitters, tubing and laterals, control valves and filters, smart controllers and flow meters, and fittings and others. By crop type, the market includes orchards and vineyards, field crops, plantation crops, and other crop types. By farming technique, the market is classified into open field cultivation and protected cultivation. By end user, the market comprises farmers, large private and corporate farms, government projects, and others. Regionally, the market is divided into Asia Pacific, Europe, North America, Latin America, and Middle East & Africa.
By Mechanism, the Drip Irrigation Systems Segment Accounts for a Dominant Market Share

Micro Irrigation System Market Analysis By Mechanism

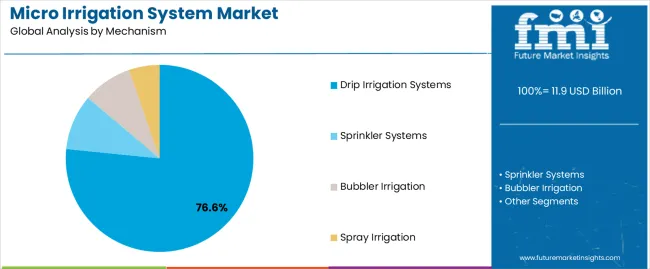
The drip irrigation systems segment represents the dominant force in the micro irrigation market, capturing approximately 76.6% of total market share in 2025. This advanced category encompasses formulations featuring surface drip (41% of drip systems), subsurface drip (28%), in-line drip (23%), and gravity/family-fed drip (8%), delivering precise water and nutrient application with enhanced crop performance capabilities. The drip irrigation segment's market leadership stems from its exceptional water use efficiency, fertigation compatibility, and proven ability to increase yields by 20-90% across diverse crop types while reducing water consumption by up to 70% compared to conventional irrigation methods.

The sprinkler systems segment maintains an 18% market share, serving farmers who require flexible irrigation solutions for field crops and large-area applications through center pivot and lateral move systems. The bubbler irrigation segment accounts for 3% market share, while spray irrigation represents 2.4%, featuring specialized applications for greenhouse operations and landscape irrigation.

Key advantages driving the drip irrigation systems segment include:
  • Superior water efficiency with targeted root zone delivery minimizing evaporation and runoff losses
  • Fertigation integration enabling synchronized nutrient delivery through irrigation systems for optimal crop nutrition
  • Yield enhancement potential delivering 25-50% yield improvements in orchards, vineyards, and high-value crops
  • Labor cost reduction through automation capabilities and reduced manual irrigation requirements across farm operations

By Component, the Drippers and Emitters Segment Accounts for the Largest Market Share

Micro Irrigation System Market Analysis By Component

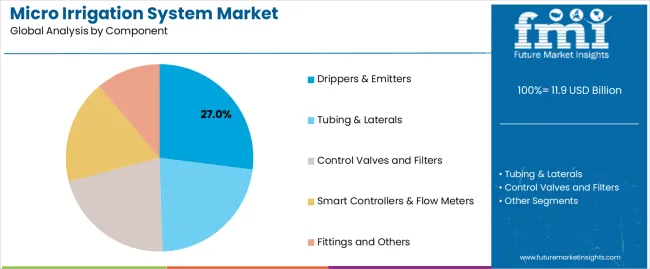
Drippers and emitters dominate the micro irrigation component market with approximately 27% market share in 2025, reflecting their critical role as the primary water delivery mechanism in precision irrigation systems. The drippers and emitters segment's market leadership is reinforced by continuous innovation in pressure-compensating designs, anti-clog technologies, and flow rate optimization that ensure uniform water distribution across varying topographies and lateral lengths.

The tubing and laterals segment represents 22% market share through polyethylene pipes, PVC mainlines, and specialized thin-wall drip tapes that form the distribution network for micro irrigation systems. Control valves and filters account for 18% market share, providing essential system protection and water quality management. Smart controllers and flow meters command 16.0% share, benefiting from increasing adoption of IoT-enabled irrigation automation and real-time monitoring capabilities. Fittings and others maintain 17.0% market share through connectors, end caps, and pressure regulators essential for system assembly and operation.

Key market dynamics supporting component preferences include:
  • Drippers and emitters offering precise flow control with pressure compensation ensuring uniform application across diverse field conditions
  • Tubing infrastructure providing cost-effective water conveyance with durability specifications matching 10-15 year system lifespans
  • Smart controllers enabling automated irrigation scheduling based on soil moisture sensors, weather data, and crop evapotranspiration rates
  • System integration requirements driving bundled component purchases where manufacturers offer complete irrigation solution packages

By End User, the Farmers Segment Accounts for a Dominant Market Share

Micro Irrigation System Market Analysis By End User

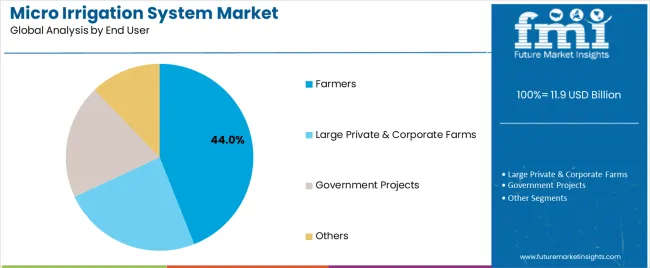
The farmers segment, encompassing small and medium holders, represents the dominant end user category in the micro irrigation market, capturing approximately 44% of total market share in 2025. This segment includes individual farmers and family-operated holdings typically managing 1-20 hectares, where government subsidies covering 40-90% of installation costs make micro irrigation economically accessible. The farmers segment's leadership reflects the numerical dominance of smallholder agriculture globally and targeted policy interventions promoting water-efficient irrigation adoption among resource-constrained producers.

Large private and corporate farms account for 28% market share, representing commercial agricultural operations with extensive acreage, in-house technical expertise, and capital capacity for unsubsidized system investments. Government projects and agricultural departments maintain 19% share through demonstration farms, research stations, and public irrigation schemes. Others, including cooperatives and agricultural contractors, represent 9% market share through shared infrastructure models and service-based irrigation deployment.

Key advantages driving the farmers segment include:

  • Subsidy accessibility with national and state programs reducing farmer investment to 10-50% of total system cost in high-growth markets
  • Yield improvement imperative where smallholders lacking access to additional land must intensify production on existing acreage
  • Water scarcity impact disproportionately affecting smallholders with limited groundwater access and irrigation infrastructure
  • Extension support through government agricultural departments and NGOs specifically targeting small farmer micro irrigation adoption

What are the Drivers, Restraints, and Key Trends of the Micro Irrigation System Market?

The market is driven by three concrete demand factors tied to water scarcity and agricultural productivity. First, global water stress conditions intensify across major agricultural regions, with the World Resources Institute identifying 17 countries facing extremely high water stress and micro irrigation offering 40-70% water savings compared to flood irrigation methods. Second, government subsidy programs accelerate adoption, with India's Per Drop More Crop scheme providing 55-90% cost subsidies, China's agricultural modernization initiatives supporting greenhouse drip installations, and California's irrigation efficiency grants offsetting 50% of system costs. Third, climate change adaptation requirements drive farmers toward resilient irrigation infrastructure, with micro irrigation maintaining productivity during drought periods and enabling controlled deficit irrigation strategies that optimize crop quality under water-limited conditions.

Market restraints include high initial capital requirements ranging from USD 1,200 to USD 2,500 per hectare depending on crop type and technology level, creating affordability barriers for smallholder farmers in developing regions without access to subsidized financing programs. Technical complexity in system design, installation, and maintenance poses adoption challenges, particularly in regions lacking trained irrigation technicians and after-sales service networks to address clogging issues, pressure irregularities, and component failures. Water quality limitations affect system performance, as high sediment loads, chemical contaminants, and biological growth require sophisticated filtration solutions that increase operational costs and maintenance requirements beyond capabilities of resource-constrained farmers.

Key trends indicate accelerated adoption in Asia Pacific markets, particularly India and China, where government mandates targeting 10 million hectares of micro irrigation expansion by 2030 drive unprecedented market growth. Technology advancement trends toward smart irrigation controllers with soil moisture sensors, weather-based scheduling algorithms, and mobile app interfaces enable precision water management and remote system monitoring. Integration with renewable energy, particularly solar-powered pumping systems, addresses electricity access limitations while reducing operational costs in off-grid agricultural areas. However, the market thesis could face disruption if climate patterns shift toward increased rainfall in traditionally water-scarce regions or if breakthrough drought-resistant crop varieties reduce irrigation dependency across major agricultural systems.
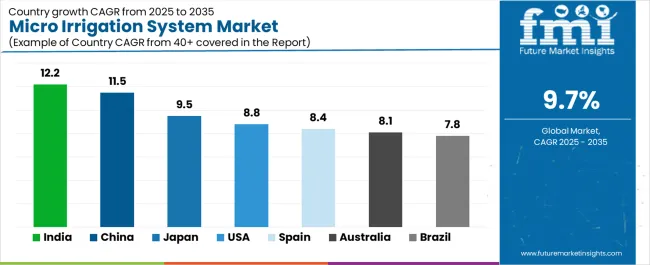
Analysis of the Micro Irrigation System Market by Key Country

Micro Irrigation System Market Cagr Analysis By Country

Country CAGR (2025-2035)
India 12.2%
China 11.5%
USA 8.8%
Japan 9.5%
Spain 8.4%
Australia 8.1%
Brazil 7.8%

The micro irrigation system market is gaining momentum worldwide, with India taking the lead thanks to aggressive water conservation schemes and government subsidy programs covering up to 90% of installation costs. Close behind, China benefits from greenhouse vegetable expansion and cost-efficient thin-wall drip line technologies, positioning itself as a strategic growth hub in the Asia-Pacific region. The United States shows strong advancement, where precision farming adoption in California and Florida orchards strengthens its role in advanced irrigation technology deployment. Japan demonstrates robust growth through protected cultivation expansion and automation solutions addressing aging farm workforce challenges, signaling continued investment in greenhouse infrastructure. Meanwhile, Spain stands out for EU-backed water-saving schemes with Murcia and Cartagena regions achieving over 90% micro irrigation coverage, while Australia and Brazil continue to record consistent progress driven by water scarcity mitigation and export crop expansion. Together, India and China anchor the global expansion story, while established markets build stability and diversity into the market's growth path.

The report covers an in-depth analysis of 40+ countries top-performing countries are highlighted below.
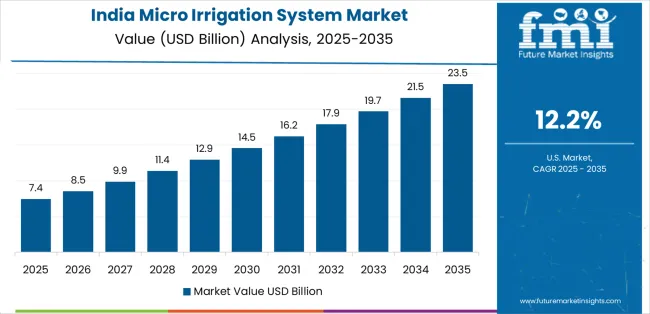
India Leads Global Market Expansion

Micro Irrigation System Market Country Value Analysis

India demonstrates the strongest growth potential in the Micro Irrigation System Market with a CAGR of 12.2% through 2035. The country's leadership position stems from comprehensive water conservation initiatives under the Jal Shakti Mission, extensive government subsidy programs providing 55-90% cost support, and aggressive expansion targets aiming to cover 10 million hectares under micro irrigation by 2030. Growth is concentrated in major agricultural regions, including Maharashtra, Karnataka, Rajasthan, Tamil Nadu, and Andhra Pradesh, where fruit, vegetable, and sugarcane farmers are implementing drip and sprinkler systems for water efficiency and yield enhancement. Distribution channels through agricultural departments, farmer producer organizations, and private irrigation companies expand deployment across diverse farming communities and crop types.

Key market factors:

  • Largest irrigated area globally with over 70 million hectares providing massive addressable market for micro irrigation conversion
  • Government support through Pradhan Mantri Krishi Sinchayee Yojana providing comprehensive subsidies and technical assistance programs
  • Water scarcity pressures with 21 major cities facing groundwater depletion driving urgent adoption of efficient irrigation technologies
  • Technology localization featuring domestic manufacturers offering affordable drip systems priced 30-50% below international brands

China Emerges as High-Growth Market

In Shandong, Hebei, Henan, and Xinjiang provinces, the adoption of micro irrigation systems is accelerating across greenhouse vegetable operations, orchard developments, and large-scale field crop installations, driven by agricultural modernization policies and water resource management mandates. The market demonstrates strong growth momentum with a CAGR of 11.5% through 2035, linked to comprehensive greenhouse agriculture expansion targeting 4 million hectares of protected cultivation by 2030. Chinese farmers are implementing cost-efficient thin-wall drip tapes and automated fertigation systems to improve crop yields while meeting government water use efficiency standards. The country's 14th Five-Year Plan for Agricultural Development creates sustained demand for irrigation modernization, while increasing focus on food security drives adoption of water-saving technologies across diverse agricultural regions.

Key development areas:

  • Greenhouse vegetable boom with 3.8 million hectares of protected cultivation requiring precision irrigation infrastructure
  • Government policy mandates establishing water use efficiency targets and providing equipment subsidies through provincial agricultural departments
  • Domestic manufacturing capacity enabling rapid production scale-up with leading Chinese manufacturers achieving 30-40% cost advantages
  • Large acreage adoption in northwest regions where cotton, corn, and wheat producers implement drip irrigation for water conservation

United States Shows Strong Technology Innovation

The USA market leads in advanced micro irrigation innovation based on integration with precision agriculture technologies, including soil moisture sensors, weather-based controllers, and satellite-based crop monitoring systems. The country shows solid potential with a CAGR of 8.8% through 2035, driven by water scarcity in western states, environmental regulations limiting groundwater extraction, and increasing adoption of sustainable farming practices. Growth is concentrated in California, Florida, Washington, and Arizona, where specialty crop producers including almond, citrus, grape, and vegetable growers implement advanced drip systems with automated fertigation capabilities. Technology deployment channels through irrigation dealers, agricultural cooperatives, and direct manufacturer relationships expand coverage across diverse farming operations from small orchards to corporate farms exceeding 5,000 hectares.

Leading market segments:

  • California orchard upgrades with 1.2 million hectares of tree crops transitioning to micro irrigation for drought resilience and water regulation compliance
  • Smart controller adoption featuring IoT-enabled systems with weather station integration achieving 20-30% additional water savings beyond standard drip irrigation
  • Precision farming integration where irrigation scheduling synchronizes with soil moisture monitoring and crop evapotranspiration modeling
  • Sustainability reporting driving corporate farms toward certified water-efficient irrigation meeting environmental stewardship commitments

Japan Demonstrates Protected Cultivation Integration

Japan's micro irrigation market demonstrates sophisticated implementation focused on greenhouse production systems and high-value vegetable cultivation, with documented integration of automated drip systems achieving 95% water use efficiency in controlled environment operations. The country maintains strong growth momentum with a CAGR of 9.5% through 2035, driven by aging farm workforce requiring labor-saving automation and consumer demand for premium produce with consistent quality. Major agricultural regions, including Hokkaido, Nagano, Aichi, and Kumamoto, showcase advanced deployment of fertigation systems and climate-controlled irrigation that integrate seamlessly with existing greenhouse infrastructure and precision environmental management programs.

Key market characteristics:

  • Protected cultivation expansion with 50,000 hectares of advanced greenhouses requiring integrated irrigation and fertigation systems
  • Automation emphasis addressing labor shortages through sensor-based irrigation scheduling and remote monitoring capabilities
  • Premium produce focus where consistent moisture management supports production of high-value strawberries, tomatoes, and leafy vegetables
  • Technology partnerships between Japanese greenhouse operators and international irrigation equipment suppliers enabling best practice transfer

Spain Emphasizes Orchard and Vineyard Applications

In Murcia, Cartagena, Valencia, and Andalusia regions, orchard and vineyard managers have achieved industry-leading micro irrigation penetration rates exceeding 90% of cultivated area, establishing Spain as Europe's benchmark for water-efficient agriculture implementation. The market shows solid growth potential with a CAGR of 8.4% through 2035, linked to European Union Common Agricultural Policy support for irrigation modernization, stringent water use regulations in water-scarce regions, and increasing export demands for high-quality citrus, stone fruits, and wine grapes. Spanish producers are adopting advanced drip systems with pressure-compensating emitters and automated fertigation programs to maintain production quality while complying with reduced water allocation quotas in drought-affected Mediterranean regions.

Market development factors:

  • EU-backed water-saving schemes providing 40-50% co-financing for irrigation modernization projects under rural development programs
  • Water scarcity drivers with southeastern regions facing chronic water deficits requiring efficient irrigation for agricultural viability
  • Export quality requirements where consistent irrigation management ensures fruit size uniformity and quality grades for premium export markets
  • Technology leadership with Spanish irrigation companies developing advanced products for Mediterranean climate and crop conditions

Australia Maintains Climate Resilience Focus

Australia's micro irrigation market demonstrates strategic implementation focused on water scarcity mitigation and climate resilience, with documented adoption across cotton, horticulture, and viticulture sectors achieving 30-50% water savings compared to flood irrigation methods. The country shows steady growth with a CAGR of 8.1% through 2035, driven by Murray-Darling Basin Plan water allocation restrictions, government irrigation efficiency programs, and increasing frequency of drought conditions affecting traditional agricultural regions. Major producing areas, including New South Wales, Victoria, Queensland, and South Australia, showcase transition from channel irrigation to pressurized drip and sprinkler systems that optimize limited water resources while maintaining agricultural productivity and export competitiveness.

Key market characteristics:

  • Water allocation constraints under Murray-Darling Basin cap-and-trade system incentivizing irrigation efficiency investments
  • Government support programs providing technical assistance and financial incentives for irrigation modernization projects
  • Export agriculture focus where water-efficient production ensures competitiveness in almond, citrus, and wine export markets
  • Technology sophistication with widespread adoption of automated systems featuring soil moisture monitoring and weather-based scheduling

Brazil Shows Export Crop Expansion

Brazil's micro irrigation market demonstrates growing implementation focused on export-oriented fruit production, sugarcane cultivation, and coffee plantations, with documented adoption delivering 25-35% yield improvements in irrigated citrus and tropical fruit operations. The market maintains consistent growth with a CAGR of 7.8% through 2035, driven by agricultural export expansion, regional government credit programs providing favorable financing terms, and increasing adoption among medium and large-scale producers seeking productivity enhancement. Major producing regions, including São Paulo, Minas Gerais, Bahia, and Paraná, showcase deployment of drip irrigation systems in mango, grape, coffee, and sugarcane cultivation where water management directly impacts crop quality and export market access.

Key development areas:
  • Fruit export expansion with table grape, mango, and citrus producers implementing micro irrigation for quality and market competitiveness
  • Sugarcane productivity enhancement where drip irrigation adoption is accelerating in São Paulo state's ethanol production zones
  • Regional government programs providing credit lines with favorable interest rates for irrigation infrastructure investments
  • Technology transfer from international irrigation companies establishing local manufacturing and technical support capabilities

Europe Market Split by Country

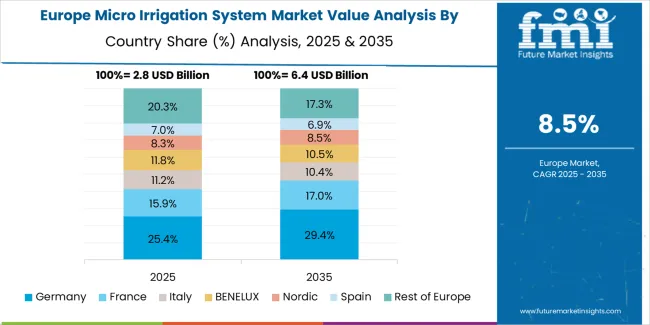
Micro Irrigation System Market Europe Country Market Share Analysis, 2025 & 2035

The micro irrigation system market in Europe is projected to grow from USD 2.6 billion in 2025 to USD 6.3 billion by 2035, registering a CAGR of 9.1% over the forecast period. Spain is expected to maintain its leadership position with a 20.0% market share in 2025, rising to 19.0% by 2035, supported by its extensive orchard and vineyard infrastructure and major agricultural centers, including Murcia, Cartagena, and Valencia production regions.

Italy follows with a 17.7% share in 2025, projected to reach 16.7% by 2035, driven by comprehensive citrus and olive plantation drip irrigation programs implementing precision water management. France holds a 15.4% share in 2025, expected to rise to 14.6% by 2035 through ongoing protected cultivation expansion and wine sector modernization. Germany commands a 13.8% share in 2025, declining slightly to 12.7% by 2035, backed by greenhouse vegetable and ornamental crop applications. The United Kingdom accounts for 12.7% in 2025, reaching 11.9% by 2035 on horticulture automation and government subsidy programs. The Netherlands maintains 10.0% in 2025, reaching 9.4% by 2035 on high-tech greenhouse exports and advanced fertigation systems. The Rest of Europe region is anticipated to hold 10.4% in 2025, expanding to 9.4% by 2035, attributed to increasing micro irrigation adoption in Eastern European countries implementing agricultural modernization programs.
Competitive Landscape of the Micro Irrigation System Market

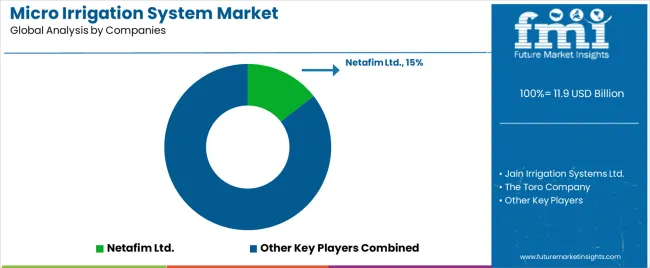
Micro Irrigation System Market Analysis By Company

The micro irrigation system market features approximately 20-25 meaningful players with moderate concentration, where the top three companies control roughly 32-35% of global market share through established distribution networks, comprehensive product portfolios, and technical service capabilities. Competition centers on technology innovation, system reliability, and after-sales support rather than price competition alone. Netafim Ltd. leads with approximately 14.5% market share through its comprehensive drip irrigation solutions and global presence across 110 countries.

Market leaders include Netafim Ltd., Jain Irrigation Systems Ltd., and The Toro Company, which maintain competitive advantages through extensive research and development investments, proprietary emitter technologies with anti-clog features, and deep expertise in agronomic advisory services that address complete irrigation system lifecycle from design through operation. These companies leverage vertical integration in component manufacturing, global distribution infrastructure, and strategic partnerships with agricultural cooperatives to defend market positions while expanding into emerging markets and protected cultivation applications.

Challengers encompass Rain Bird Corporation and Hunter Industries, which compete through smart irrigation controllers, IoT-enabled automation platforms, and strong presence in North American and European markets. Technology specialists, including Valmont Industries, Rivulis Irrigation Ltd., and Lindsay Corporation, focus on specific irrigation mechanisms or crop applications, offering differentiated capabilities in center pivot systems, fertigation technologies, and precision agriculture integration.

Regional players and emerging irrigation providers create competitive pressure through localized manufacturing advantages, government relationship management, and rapid response capabilities, particularly in high-growth markets including India and China, where cost-competitive products and extensive dealer networks provide advantages in smallholder farmer segments. Market dynamics favor companies that combine reliable technology performance with comprehensive support services addressing system design, installation training, and ongoing maintenance requirements across diverse agricultural applications.

Global Micro Irrigation System Market - Stakeholder Contribution Framework

Micro irrigation systems represent precision water delivery technologies that enable farmers to achieve 40-70% water savings compared to conventional irrigation methods, delivering superior crop productivity and resource efficiency with targeted root zone application in demanding agricultural applications. With the market projected to grow from USD 11.9 billion in 2025 to USD 30.1 billion by 2035 at a 9.7% CAGR, these water-efficient systems offer compelling advantages - reduced water consumption, enhanced yields, and improved crop quality - making them essential for orchards and vineyards production (35.4% market share), field crops (31.0% share), and farming operations seeking alternatives to water-intensive flood irrigation that depletes groundwater resources through inefficient application. Scaling market adoption and infrastructure development requires coordinated action across agricultural policy, irrigation equipment manufacturers, financing institutions, farming communities, and water resource management authorities.

How Governments Could Spur Local Production and Adoption?

  • Subsidy and Financing Programs: Provide 50-90% capital cost subsidies for micro irrigation installation, offer low-interest credit schemes for system procurement, and establish domestic manufacturing incentives that reduce equipment costs while building local supply chain capabilities.
  • Water Policy Integration: Implement volumetric water pricing that rewards efficient irrigation adoption, enforce groundwater extraction limits that necessitate conservation technologies, and link water allocation permits to irrigation efficiency standards across agricultural regions.
  • Extension and Training Services: Fund comprehensive farmer training programs on system design and operation, establish demonstration farms showcasing micro irrigation benefits, and develop agronomic advisory services addressing crop-specific irrigation scheduling and fertigation management.
  • Infrastructure Development Support: Invest in electricity grid extensions and solar pumping solutions enabling pressurized irrigation, support community-scale micro irrigation projects in water-scarce regions, and provide technical assistance for irrigation service centers offering maintenance and repair capabilities.
  • Research and Development Funding: Finance university research on locally-adapted drip line designs, support development of low-cost filtration solutions for challenging water quality conditions, and invest in smart irrigation technologies addressing specific regional crop and climate requirements.

How Industry Bodies Could Support Market Development?

  • Quality Standards and Certification: Define standardized testing protocols for emitter flow uniformity, pressure compensation, and clogging resistance across drip irrigation systems (76.6% market dominance), enabling reliable quality assurance and farmer confidence in equipment performance.
  • Best Management Practices: Develop comprehensive guidelines for system design principles, installation procedures, and maintenance schedules specific to orchards and vineyards (35.4% crop segment), field crops (31.0%), and protected cultivation applications ensuring optimal performance.
  • Technical Training Programs: Establish certification courses for irrigation system designers, installer training programs addressing proper equipment handling, and agronomist education on fertigation management and precision irrigation scheduling methodologies.
  • Market Information Services: Create databases tracking irrigation adoption rates by crop and region, publish benchmark data on system costs and water savings achievements, and disseminate case studies demonstrating return on investment across diverse farming scenarios.

How OEMs and Technology Players Could Strengthen the Ecosystem?

  • Affordable Product Innovation: Develop cost-optimized drip line designs for price-sensitive markets, engineer robust emitters resistant to clogging under challenging water quality, and create modular system components enabling phased installation matching farmer budget constraints.
  • Smart Irrigation Solutions: Provide IoT-enabled controllers with soil moisture sensor integration, develop mobile applications for remote system monitoring and control, and offer weather-based scheduling algorithms optimizing irrigation timing and duration automatically.
  • Fertigation Integration: Design systems enabling precise nutrient delivery through irrigation infrastructure, develop injection equipment for synchronized fertilizer application, and create crop-specific fertigation programs optimizing nutrition management while conserving water.
  • After-Sales Support Networks: Establish regional service centers providing maintenance and troubleshooting assistance, train local technicians on system repair and component replacement, and offer performance monitoring services identifying optimization opportunities across installed systems.

How Suppliers Could Navigate the Shift?

  • Crop-Focused Product Lines: Develop specialized irrigation systems for orchards and vineyards (35.4% market dominance), field crops (31.0% share), and plantation crops (21.0% share), with component specifications optimized for each application's water delivery and fertigation requirements.
  • Geographic Market Strategy: Establish manufacturing and distribution capabilities in high-growth markets like India (12.2% CAGR) and China (11.5% CAGR), while maintaining technology leadership through partnerships in established markets like United States (8.8% CAGR) and Europe.
  • End User Segmentation: Create tailored offerings for farmers segment (44.0% share) emphasizing affordability and subsidy program compatibility, while developing premium solutions for large corporate farms (28.0% share) featuring advanced automation and data analytics integration.
  • Technology Differentiation: Invest in proprietary emitter designs with superior clogging resistance, develop advanced filtration systems for challenging water sources, and offer integrated smart controllers providing differentiation beyond commodity drip line products.

How Investors and Financial Enablers Could Unlock Value?

  • Equipment Manufacturing Expansion: Finance leading irrigation companies for production capacity expansion, support domestic manufacturing development in high-growth regions, and enable backward integration into component production reducing supply chain dependencies.
  • Technology Innovation: Back agricultural technology startups developing AI-based irrigation optimization platforms, finance sensor technology companies creating affordable soil moisture monitoring solutions, and support precision agriculture integration addressing complete farm management systems.
  • Smallholder Financing Programs: Provide working capital for irrigation dealer networks serving small farmers, establish equipment leasing schemes enabling affordable access without large capital outlays, and support microfinance institutions incorporating irrigation loans in agricultural lending portfolios.
  • Market Consolidation Opportunities: Finance strategic acquisitions consolidating fragmented regional players, support partnerships between international technology leaders and local distribution networks, and enable vertical integration creating comprehensive irrigation solution providers with manufacturing through service capabilities.

Key Players in the Micro Irrigation System Market

  • Netafim Ltd.
  • Jain Irrigation Systems Ltd.
  • The Toro Company
  • Rain Bird Corporation
  • Hunter Industries
  • Valmont Industries
  • Rivulis Irrigation Ltd.
  • Lindsay Corporation
  • Reinke Manufacturing Co.
  • EPC Industries Ltd.

Scope of the Report

Item Value
Quantitative Units USD 11.9 billion
Mechanism Drip Irrigation Systems, Sprinkler Systems, Bubbler Irrigation, Spray Irrigation
Component Drippers & Emitters, Tubing & Laterals, Control Valves and Filters, Smart Controllers & Flow Meters, Fittings and Others
Crop Type Orchards and Vineyards, Field Crops, Plantation Crops, Other Crop Types
Farming Technique Open Field Cultivation, Protected Cultivation
End User Farmers, Large Private & Corporate Farms, Government Projects, Others
Regions Covered Asia Pacific, Europe, North America, Latin America, Middle East & Africa
Country Covered India, China, United States, Japan, Spain, Australia, Brazil, and 40+ countries
Key Companies Profiled Netafim Ltd., Jain Irrigation Systems Ltd., The Toro Company, Rain Bird Corporation, Hunter Industries, Valmont Industries, Rivulis Irrigation Ltd., Lindsay Corporation, Reinke Manufacturing Co., EPC Industries Ltd.
Additional Attributes Dollar sales by mechanism, component, crop type, farming technique, and end user categories, regional adoption trends across Asia Pacific, Europe, and North America, competitive landscape with irrigation equipment manufacturers and distribution networks, system installation requirements and specifications, integration with precision agriculture platforms and IoT technologies, innovations in smart controllers and fertigation systems, and development of specialized products with enhanced water efficiency and crop-specific capabilities.

Micro Irrigation System Market by Segments

Mechanism:

  • Drip Irrigation Systems
  • Sprinkler Systems
  • Bubbler Irrigation
  • Spray Irrigation

Component:

  • Drippers & Emitters
  • Tubing & Laterals
  • Control Valves and Filters
  • Smart Controllers & Flow Meters
  • Fittings and Others

Crop Type:

  • Orchards and Vineyards
  • Field Crops
  • Plantation Crops
  • Other Crop Types

Farming Technique:

  • Open Field Cultivation
  • Protected Cultivation

End User:

  • Farmers
  • Large Private & Corporate Farms
  • Government Projects
  • Others

Region:

  • Asia Pacific
    • India
    • China
    • Japan
    • South Korea
    • Vietnam
    • Australia & New Zealand
    • ASEAN
    • Rest of Asia Pacific
  • Europe
    • Spain
    • Italy
    • France
    • Germany
    • United Kingdom
    • Netherlands
    • Nordic
    • BENELUX
    • Rest of Europe
  • North America
    • United States
    • Canada
    • Mexico
  • Latin America
    • Brazil
    • Argentina
    • Rest of Latin America
  • Middle East & Africa
    • Kingdom of Saudi Arabia
    • Other GCC Countries
    • Turkey
    • South Africa
    • Other African Union
    • Rest of Middle East & Africa

Frequently Asked Questions

How big is the micro irrigation system market in 2025?

The global micro irrigation system market is estimated to be valued at USD 11.9 billion in 2025.

What will be the size of micro irrigation system market in 2035?

The market size for the micro irrigation system market is projected to reach USD 30.0 billion by 2035.

How much will be the micro irrigation system market growth between 2025 and 2035?

The micro irrigation system market is expected to grow at a 9.7% CAGR between 2025 and 2035.

What are the key product types in the micro irrigation system market?

The key product types in micro irrigation system market are drip irrigation systems, sprinkler systems, bubbler irrigation and spray irrigation.

Which component segment to contribute significant share in the micro irrigation system market in 2025?

In terms of component, drippers & emitters segment to command 27.0% share in the micro irrigation system market in 2025.

Table of Content

  1. Executive Summary
    • Global Market Outlook
    • Demand to side Trends
    • Supply to side Trends
    • Technology Roadmap Analysis
    • Analysis and Recommendations
  2. Market Overview
    • Market Coverage / Taxonomy
    • Market Definition / Scope / Limitations
  3. Market Background
    • Market Dynamics
      • Drivers
      • Restraints
      • Opportunity
      • Trends
    • Scenario Forecast
      • Demand in Optimistic Scenario
      • Demand in Likely Scenario
      • Demand in Conservative Scenario
    • Opportunity Map Analysis
    • Product Life Cycle Analysis
    • Supply Chain Analysis
    • Investment Feasibility Matrix
    • Value Chain Analysis
    • PESTLE and Porter’s Analysis
    • Regulatory Landscape
    • Regional Parent Market Outlook
    • Production and Consumption Statistics
    • Import and Export Statistics
  4. Global Market Analysis 2020 to 2024 and Forecast, 2025 to 2035
    • Historical Market Size Value (USD Million) Analysis, 2020 to 2024
    • Current and Future Market Size Value (USD Million) Projections, 2025 to 2035
      • Y to o to Y Growth Trend Analysis
      • Absolute $ Opportunity Analysis
  5. Global Market Pricing Analysis 2020 to 2024 and Forecast 2025 to 2035
  6. Global Market Analysis 2020 to 2024 and Forecast 2025 to 2035, By Mechanism
    • Introduction / Key Findings
    • Historical Market Size Value (USD Million) Analysis By Mechanism , 2020 to 2024
    • Current and Future Market Size Value (USD Million) Analysis and Forecast By Mechanism , 2025 to 2035
      • Drip Irrigation Systems
      • Sprinkler Systems
      • Bubbler Irrigation
      • Spray Irrigation
    • Y to o to Y Growth Trend Analysis By Mechanism , 2020 to 2024
    • Absolute $ Opportunity Analysis By Mechanism , 2025 to 2035
  7. Global Market Analysis 2020 to 2024 and Forecast 2025 to 2035, By Component
    • Introduction / Key Findings
    • Historical Market Size Value (USD Million) Analysis By Component, 2020 to 2024
    • Current and Future Market Size Value (USD Million) Analysis and Forecast By Component, 2025 to 2035
      • Drippers & Emitters
      • Tubing & Laterals
      • Control Valves and Filters
      • Smart Controllers & Flow Meters
      • Fittings and Others
    • Y to o to Y Growth Trend Analysis By Component, 2020 to 2024
    • Absolute $ Opportunity Analysis By Component, 2025 to 2035
  8. Global Market Analysis 2020 to 2024 and Forecast 2025 to 2035, By End User
    • Introduction / Key Findings
    • Historical Market Size Value (USD Million) Analysis By End User, 2020 to 2024
    • Current and Future Market Size Value (USD Million) Analysis and Forecast By End User, 2025 to 2035
      • Farmers
      • Large Private & Corporate Farms
      • Government Projects
      • Others
    • Y to o to Y Growth Trend Analysis By End User, 2020 to 2024
    • Absolute $ Opportunity Analysis By End User, 2025 to 2035
  9. Global Market Analysis 2020 to 2024 and Forecast 2025 to 2035, By Region
    • Introduction
    • Historical Market Size Value (USD Million) Analysis By Region, 2020 to 2024
    • Current Market Size Value (USD Million) Analysis and Forecast By Region, 2025 to 2035
      • North America
      • Latin America
      • Western Europe
      • Eastern Europe
      • East Asia
      • South Asia and Pacific
      • Middle East & Africa
    • Market Attractiveness Analysis By Region
  10. North America Market Analysis 2020 to 2024 and Forecast 2025 to 2035, By Country
    • Historical Market Size Value (USD Million) Trend Analysis By Market Taxonomy, 2020 to 2024
    • Market Size Value (USD Million) Forecast By Market Taxonomy, 2025 to 2035
      • By Country
        • USA
        • Canada
        • Mexico
      • By Mechanism
      • By Component
      • By End User
    • Market Attractiveness Analysis
      • By Country
      • By Mechanism
      • By Component
      • By End User
    • Key Takeaways
  11. Latin America Market Analysis 2020 to 2024 and Forecast 2025 to 2035, By Country
    • Historical Market Size Value (USD Million) Trend Analysis By Market Taxonomy, 2020 to 2024
    • Market Size Value (USD Million) Forecast By Market Taxonomy, 2025 to 2035
      • By Country
        • Brazil
        • Chile
        • Rest of Latin America
      • By Mechanism
      • By Component
      • By End User
    • Market Attractiveness Analysis
      • By Country
      • By Mechanism
      • By Component
      • By End User
    • Key Takeaways
  12. Western Europe Market Analysis 2020 to 2024 and Forecast 2025 to 2035, By Country
    • Historical Market Size Value (USD Million) Trend Analysis By Market Taxonomy, 2020 to 2024
    • Market Size Value (USD Million) Forecast By Market Taxonomy, 2025 to 2035
      • By Country
        • Germany
        • UK
        • Italy
        • Spain
        • France
        • Nordic
        • BENELUX
        • Rest of Western Europe
      • By Mechanism
      • By Component
      • By End User
    • Market Attractiveness Analysis
      • By Country
      • By Mechanism
      • By Component
      • By End User
    • Key Takeaways
  13. Eastern Europe Market Analysis 2020 to 2024 and Forecast 2025 to 2035, By Country
    • Historical Market Size Value (USD Million) Trend Analysis By Market Taxonomy, 2020 to 2024
    • Market Size Value (USD Million) Forecast By Market Taxonomy, 2025 to 2035
      • By Country
        • Russia
        • Poland
        • Hungary
        • Balkan & Baltic
        • Rest of Eastern Europe
      • By Mechanism
      • By Component
      • By End User
    • Market Attractiveness Analysis
      • By Country
      • By Mechanism
      • By Component
      • By End User
    • Key Takeaways
  14. East Asia Market Analysis 2020 to 2024 and Forecast 2025 to 2035, By Country
    • Historical Market Size Value (USD Million) Trend Analysis By Market Taxonomy, 2020 to 2024
    • Market Size Value (USD Million) Forecast By Market Taxonomy, 2025 to 2035
      • By Country
        • China
        • Japan
        • South Korea
      • By Mechanism
      • By Component
      • By End User
    • Market Attractiveness Analysis
      • By Country
      • By Mechanism
      • By Component
      • By End User
    • Key Takeaways
  15. South Asia and Pacific Market Analysis 2020 to 2024 and Forecast 2025 to 2035, By Country
    • Historical Market Size Value (USD Million) Trend Analysis By Market Taxonomy, 2020 to 2024
    • Market Size Value (USD Million) Forecast By Market Taxonomy, 2025 to 2035
      • By Country
        • India
        • ASEAN
        • Australia & New Zealand
        • Rest of South Asia and Pacific
      • By Mechanism
      • By Component
      • By End User
    • Market Attractiveness Analysis
      • By Country
      • By Mechanism
      • By Component
      • By End User
    • Key Takeaways
  16. Middle East & Africa Market Analysis 2020 to 2024 and Forecast 2025 to 2035, By Country
    • Historical Market Size Value (USD Million) Trend Analysis By Market Taxonomy, 2020 to 2024
    • Market Size Value (USD Million) Forecast By Market Taxonomy, 2025 to 2035
      • By Country
        • Kingdom of Saudi Arabia
        • Other GCC Countries
        • Turkiye
        • South Africa
        • Other African Union
        • Rest of Middle East & Africa
      • By Mechanism
      • By Component
      • By End User
    • Market Attractiveness Analysis
      • By Country
      • By Mechanism
      • By Component
      • By End User
    • Key Takeaways
  17. Key Countries Market Analysis
    • USA
      • Pricing Analysis
      • Market Share Analysis, 2024
        • By Mechanism
        • By Component
        • By End User
    • Canada
      • Pricing Analysis
      • Market Share Analysis, 2024
        • By Mechanism
        • By Component
        • By End User
    • Mexico
      • Pricing Analysis
      • Market Share Analysis, 2024
        • By Mechanism
        • By Component
        • By End User
    • Brazil
      • Pricing Analysis
      • Market Share Analysis, 2024
        • By Mechanism
        • By Component
        • By End User
    • Chile
      • Pricing Analysis
      • Market Share Analysis, 2024
        • By Mechanism
        • By Component
        • By End User
    • Germany
      • Pricing Analysis
      • Market Share Analysis, 2024
        • By Mechanism
        • By Component
        • By End User
    • UK
      • Pricing Analysis
      • Market Share Analysis, 2024
        • By Mechanism
        • By Component
        • By End User
    • Italy
      • Pricing Analysis
      • Market Share Analysis, 2024
        • By Mechanism
        • By Component
        • By End User
    • Spain
      • Pricing Analysis
      • Market Share Analysis, 2024
        • By Mechanism
        • By Component
        • By End User
    • France
      • Pricing Analysis
      • Market Share Analysis, 2024
        • By Mechanism
        • By Component
        • By End User
    • India
      • Pricing Analysis
      • Market Share Analysis, 2024
        • By Mechanism
        • By Component
        • By End User
    • ASEAN
      • Pricing Analysis
      • Market Share Analysis, 2024
        • By Mechanism
        • By Component
        • By End User
    • Australia & New Zealand
      • Pricing Analysis
      • Market Share Analysis, 2024
        • By Mechanism
        • By Component
        • By End User
    • China
      • Pricing Analysis
      • Market Share Analysis, 2024
        • By Mechanism
        • By Component
        • By End User
    • Japan
      • Pricing Analysis
      • Market Share Analysis, 2024
        • By Mechanism
        • By Component
        • By End User
    • South Korea
      • Pricing Analysis
      • Market Share Analysis, 2024
        • By Mechanism
        • By Component
        • By End User
    • Russia
      • Pricing Analysis
      • Market Share Analysis, 2024
        • By Mechanism
        • By Component
        • By End User
    • Poland
      • Pricing Analysis
      • Market Share Analysis, 2024
        • By Mechanism
        • By Component
        • By End User
    • Hungary
      • Pricing Analysis
      • Market Share Analysis, 2024
        • By Mechanism
        • By Component
        • By End User
    • Kingdom of Saudi Arabia
      • Pricing Analysis
      • Market Share Analysis, 2024
        • By Mechanism
        • By Component
        • By End User
    • Turkiye
      • Pricing Analysis
      • Market Share Analysis, 2024
        • By Mechanism
        • By Component
        • By End User
    • South Africa
      • Pricing Analysis
      • Market Share Analysis, 2024
        • By Mechanism
        • By Component
        • By End User
  18. Market Structure Analysis
    • Competition Dashboard
    • Competition Benchmarking
    • Market Share Analysis of Top Players
      • By Regional
      • By Mechanism
      • By Component
      • By End User
  19. Competition Analysis
    • Competition Deep Dive
      • Netafim Ltd.
        • Overview
        • Product Portfolio
        • Profitability by Market Segments (Product/Age /Sales Channel/Region)
        • Sales Footprint
        • Strategy Overview
          • Marketing Strategy
          • Product Strategy
          • Channel Strategy
      • Jain Irrigation Systems Ltd.
      • The Toro Company
      • Rain Bird Corporation
      • Hunter Industries
      • Valmont Industries
      • Rivulis Irrigation Ltd.
      • Lindsay Corporation
      • Reinke Manufacturing Co.
      • EPC Industries Ltd.
  20. Assumptions & Acronyms Used
  21. Research Methodology

List of Tables

  • Table 1: Global Market Value (USD Million) Forecast by Region, 2020 to 2035
  • Table 2: Global Market Value (USD Million) Forecast by Mechanism , 2020 to 2035
  • Table 3: Global Market Value (USD Million) Forecast by Component, 2020 to 2035
  • Table 4: Global Market Value (USD Million) Forecast by End User, 2020 to 2035
  • Table 5: North America Market Value (USD Million) Forecast by Country, 2020 to 2035
  • Table 6: North America Market Value (USD Million) Forecast by Mechanism , 2020 to 2035
  • Table 7: North America Market Value (USD Million) Forecast by Component, 2020 to 2035
  • Table 8: North America Market Value (USD Million) Forecast by End User, 2020 to 2035
  • Table 9: Latin America Market Value (USD Million) Forecast by Country, 2020 to 2035
  • Table 10: Latin America Market Value (USD Million) Forecast by Mechanism , 2020 to 2035
  • Table 11: Latin America Market Value (USD Million) Forecast by Component, 2020 to 2035
  • Table 12: Latin America Market Value (USD Million) Forecast by End User, 2020 to 2035
  • Table 13: Western Europe Market Value (USD Million) Forecast by Country, 2020 to 2035
  • Table 14: Western Europe Market Value (USD Million) Forecast by Mechanism , 2020 to 2035
  • Table 15: Western Europe Market Value (USD Million) Forecast by Component, 2020 to 2035
  • Table 16: Western Europe Market Value (USD Million) Forecast by End User, 2020 to 2035
  • Table 17: Eastern Europe Market Value (USD Million) Forecast by Country, 2020 to 2035
  • Table 18: Eastern Europe Market Value (USD Million) Forecast by Mechanism , 2020 to 2035
  • Table 19: Eastern Europe Market Value (USD Million) Forecast by Component, 2020 to 2035
  • Table 20: Eastern Europe Market Value (USD Million) Forecast by End User, 2020 to 2035
  • Table 21: East Asia Market Value (USD Million) Forecast by Country, 2020 to 2035
  • Table 22: East Asia Market Value (USD Million) Forecast by Mechanism , 2020 to 2035
  • Table 23: East Asia Market Value (USD Million) Forecast by Component, 2020 to 2035
  • Table 24: East Asia Market Value (USD Million) Forecast by End User, 2020 to 2035
  • Table 25: South Asia and Pacific Market Value (USD Million) Forecast by Country, 2020 to 2035
  • Table 26: South Asia and Pacific Market Value (USD Million) Forecast by Mechanism , 2020 to 2035
  • Table 27: South Asia and Pacific Market Value (USD Million) Forecast by Component, 2020 to 2035
  • Table 28: South Asia and Pacific Market Value (USD Million) Forecast by End User, 2020 to 2035
  • Table 29: Middle East & Africa Market Value (USD Million) Forecast by Country, 2020 to 2035
  • Table 30: Middle East & Africa Market Value (USD Million) Forecast by Mechanism , 2020 to 2035
  • Table 31: Middle East & Africa Market Value (USD Million) Forecast by Component, 2020 to 2035
  • Table 32: Middle East & Africa Market Value (USD Million) Forecast by End User, 2020 to 2035

List of Figures

  • Figure 1: Global Market Pricing Analysis
  • Figure 2: Global Market Value (USD Million) Forecast 2020-2035
  • Figure 3: Global Market Value Share and BPS Analysis by Mechanism , 2025 and 2035
  • Figure 4: Global Market Y to o to Y Growth Comparison by Mechanism , 2025-2035
  • Figure 5: Global Market Attractiveness Analysis by Mechanism
  • Figure 6: Global Market Value Share and BPS Analysis by Component, 2025 and 2035
  • Figure 7: Global Market Y to o to Y Growth Comparison by Component, 2025-2035
  • Figure 8: Global Market Attractiveness Analysis by Component
  • Figure 9: Global Market Value Share and BPS Analysis by End User, 2025 and 2035
  • Figure 10: Global Market Y to o to Y Growth Comparison by End User, 2025-2035
  • Figure 11: Global Market Attractiveness Analysis by End User
  • Figure 12: Global Market Value (USD Million) Share and BPS Analysis by Region, 2025 and 2035
  • Figure 13: Global Market Y to o to Y Growth Comparison by Region, 2025-2035
  • Figure 14: Global Market Attractiveness Analysis by Region
  • Figure 15: North America Market Incremental Dollar Opportunity, 2025-2035
  • Figure 16: Latin America Market Incremental Dollar Opportunity, 2025-2035
  • Figure 17: Western Europe Market Incremental Dollar Opportunity, 2025-2035
  • Figure 18: Eastern Europe Market Incremental Dollar Opportunity, 2025-2035
  • Figure 19: East Asia Market Incremental Dollar Opportunity, 2025-2035
  • Figure 20: South Asia and Pacific Market Incremental Dollar Opportunity, 2025-2035
  • Figure 21: Middle East & Africa Market Incremental Dollar Opportunity, 2025-2035
  • Figure 22: North America Market Value Share and BPS Analysis by Country, 2025 and 2035
  • Figure 23: North America Market Value Share and BPS Analysis by Mechanism , 2025 and 2035
  • Figure 24: North America Market Y to o to Y Growth Comparison by Mechanism , 2025-2035
  • Figure 25: North America Market Attractiveness Analysis by Mechanism
  • Figure 26: North America Market Value Share and BPS Analysis by Component, 2025 and 2035
  • Figure 27: North America Market Y to o to Y Growth Comparison by Component, 2025-2035
  • Figure 28: North America Market Attractiveness Analysis by Component
  • Figure 29: North America Market Value Share and BPS Analysis by End User, 2025 and 2035
  • Figure 30: North America Market Y to o to Y Growth Comparison by End User, 2025-2035
  • Figure 31: North America Market Attractiveness Analysis by End User
  • Figure 32: Latin America Market Value Share and BPS Analysis by Country, 2025 and 2035
  • Figure 33: Latin America Market Value Share and BPS Analysis by Mechanism , 2025 and 2035
  • Figure 34: Latin America Market Y to o to Y Growth Comparison by Mechanism , 2025-2035
  • Figure 35: Latin America Market Attractiveness Analysis by Mechanism
  • Figure 36: Latin America Market Value Share and BPS Analysis by Component, 2025 and 2035
  • Figure 37: Latin America Market Y to o to Y Growth Comparison by Component, 2025-2035
  • Figure 38: Latin America Market Attractiveness Analysis by Component
  • Figure 39: Latin America Market Value Share and BPS Analysis by End User, 2025 and 2035
  • Figure 40: Latin America Market Y to o to Y Growth Comparison by End User, 2025-2035
  • Figure 41: Latin America Market Attractiveness Analysis by End User
  • Figure 42: Western Europe Market Value Share and BPS Analysis by Country, 2025 and 2035
  • Figure 43: Western Europe Market Value Share and BPS Analysis by Mechanism , 2025 and 2035
  • Figure 44: Western Europe Market Y to o to Y Growth Comparison by Mechanism , 2025-2035
  • Figure 45: Western Europe Market Attractiveness Analysis by Mechanism
  • Figure 46: Western Europe Market Value Share and BPS Analysis by Component, 2025 and 2035
  • Figure 47: Western Europe Market Y to o to Y Growth Comparison by Component, 2025-2035
  • Figure 48: Western Europe Market Attractiveness Analysis by Component
  • Figure 49: Western Europe Market Value Share and BPS Analysis by End User, 2025 and 2035
  • Figure 50: Western Europe Market Y to o to Y Growth Comparison by End User, 2025-2035
  • Figure 51: Western Europe Market Attractiveness Analysis by End User
  • Figure 52: Eastern Europe Market Value Share and BPS Analysis by Country, 2025 and 2035
  • Figure 53: Eastern Europe Market Value Share and BPS Analysis by Mechanism , 2025 and 2035
  • Figure 54: Eastern Europe Market Y to o to Y Growth Comparison by Mechanism , 2025-2035
  • Figure 55: Eastern Europe Market Attractiveness Analysis by Mechanism
  • Figure 56: Eastern Europe Market Value Share and BPS Analysis by Component, 2025 and 2035
  • Figure 57: Eastern Europe Market Y to o to Y Growth Comparison by Component, 2025-2035
  • Figure 58: Eastern Europe Market Attractiveness Analysis by Component
  • Figure 59: Eastern Europe Market Value Share and BPS Analysis by End User, 2025 and 2035
  • Figure 60: Eastern Europe Market Y to o to Y Growth Comparison by End User, 2025-2035
  • Figure 61: Eastern Europe Market Attractiveness Analysis by End User
  • Figure 62: East Asia Market Value Share and BPS Analysis by Country, 2025 and 2035
  • Figure 63: East Asia Market Value Share and BPS Analysis by Mechanism , 2025 and 2035
  • Figure 64: East Asia Market Y to o to Y Growth Comparison by Mechanism , 2025-2035
  • Figure 65: East Asia Market Attractiveness Analysis by Mechanism
  • Figure 66: East Asia Market Value Share and BPS Analysis by Component, 2025 and 2035
  • Figure 67: East Asia Market Y to o to Y Growth Comparison by Component, 2025-2035
  • Figure 68: East Asia Market Attractiveness Analysis by Component
  • Figure 69: East Asia Market Value Share and BPS Analysis by End User, 2025 and 2035
  • Figure 70: East Asia Market Y to o to Y Growth Comparison by End User, 2025-2035
  • Figure 71: East Asia Market Attractiveness Analysis by End User
  • Figure 72: South Asia and Pacific Market Value Share and BPS Analysis by Country, 2025 and 2035
  • Figure 73: South Asia and Pacific Market Value Share and BPS Analysis by Mechanism , 2025 and 2035
  • Figure 74: South Asia and Pacific Market Y to o to Y Growth Comparison by Mechanism , 2025-2035
  • Figure 75: South Asia and Pacific Market Attractiveness Analysis by Mechanism
  • Figure 76: South Asia and Pacific Market Value Share and BPS Analysis by Component, 2025 and 2035
  • Figure 77: South Asia and Pacific Market Y to o to Y Growth Comparison by Component, 2025-2035
  • Figure 78: South Asia and Pacific Market Attractiveness Analysis by Component
  • Figure 79: South Asia and Pacific Market Value Share and BPS Analysis by End User, 2025 and 2035
  • Figure 80: South Asia and Pacific Market Y to o to Y Growth Comparison by End User, 2025-2035
  • Figure 81: South Asia and Pacific Market Attractiveness Analysis by End User
  • Figure 82: Middle East & Africa Market Value Share and BPS Analysis by Country, 2025 and 2035
  • Figure 83: Middle East & Africa Market Value Share and BPS Analysis by Mechanism , 2025 and 2035
  • Figure 84: Middle East & Africa Market Y to o to Y Growth Comparison by Mechanism , 2025-2035
  • Figure 85: Middle East & Africa Market Attractiveness Analysis by Mechanism
  • Figure 86: Middle East & Africa Market Value Share and BPS Analysis by Component, 2025 and 2035
  • Figure 87: Middle East & Africa Market Y to o to Y Growth Comparison by Component, 2025-2035
  • Figure 88: Middle East & Africa Market Attractiveness Analysis by Component
  • Figure 89: Middle East & Africa Market Value Share and BPS Analysis by End User, 2025 and 2035
  • Figure 90: Middle East & Africa Market Y to o to Y Growth Comparison by End User, 2025-2035
  • Figure 91: Middle East & Africa Market Attractiveness Analysis by End User
  • Figure 92: Global Market - Tier Structure Analysis
  • Figure 93: Global Market - Company Share Analysis
Dashboard
Dashboard
Dashboard
Dashboard
Dashboard
Dashboard

Full Research Suite comprises of:

Market outlook & trends analysis

Market outlook & trends analysis

Interviews & case studies

Interviews & case studies

Strategic recommendations

Strategic recommendations

Vendor profiles & capabilities analysis

Vendor profiles & capabilities analysis

5-year forecasts

5-year forecasts

8 regions and 60+ country-level data splits

8 regions and 60+ country-level data splits

Market segment data splits

Market segment data splits

12 months of continuous data updates

12 months of continuous data updates

DELIVERED AS:

PDF EXCEL ONLINE

Full Research Suite


$5000

$7500

$10000

Buy Report Now
Similar Industry Reports

Similar Industry Reports

Micro Hotel Market
Micro Hotel Market

Micro Hotel Market Size and Share Forecast Outlook 2025 to 2035

Microwave Source Market

Microwave Source Market Size and Share Forecast Outlook 2025 to 2035

Micro CHP Market
Micro CHP Market

Micro CHP Market Size and Share Forecast Outlook 2025 to 2035

Micro Flute Paper Market

Micro Flute Paper Market Size and Share Forecast Outlook 2025 to 2035

Microcrystalline Cellulose Market

Microcrystalline Cellulose Market Size and Share Forecast Outlook 2025 to 2035

Micro Balances Market

Micro Balances Market Size and Share Forecast Outlook 2025 to 2035

Micro Perforated Films Packaging Market

Micro Perforated Films Packaging Market Size and Share Forecast Outlook 2025 to 2035

Microbial Coagulants Market

Microbial Coagulants Market Size and Share Forecast Outlook 2025 to 2035

Microserver IC Market

Microserver IC Market Size and Share Forecast Outlook 2025 to 2035

Microplate Handling Instruments Market

Microplate Handling Instruments Market Size and Share Forecast Outlook 2025 to 2035

Microsclerotherapy Treatment Market

Microsclerotherapy Treatment Market Size and Share Forecast Outlook 2025 to 2035

Micro-Scale VFFS Modules Market

Micro-Scale VFFS Modules Market Analysis - Size and Share Forecast Outlook 2025 to 2035

Microscope Digital Camera Market

Microscope Digital Camera Market Size and Share Forecast Outlook 2025 to 2035

Micro Guide Catheter Market

Micro Guide Catheter Market Size and Share Forecast Outlook 2025 to 2035

Micro Perforation Machines Market

Micro Perforation Machines Market Size and Share Forecast Outlook 2025 to 2035

Micro Battery Market

Micro Battery Market Size and Share Forecast Outlook 2025 to 2035

Microwave Monolithic Integrated Circuits Market

Microwave Monolithic Integrated Circuits Market Size and Share Forecast Outlook 2025 to 2035

Microchip Electrophoresis Market

Microchip Electrophoresis Market Size and Share Forecast Outlook 2025 to 2035

Micropipette Puller Market

Micropipette Puller Market Size and Share Forecast Outlook 2025 to 2035

Microwave Cable Assemblies Market

Microwave Cable Assemblies Market Size and Share Forecast Outlook 2025 to 2035

Future Market Insights

Micro Irrigation System Market

Chat With MaRIA

Chat With

MaRIA

Hi There, I am MaRIA, Your Market Research Intelligence Assistant. How may I help you?