Reports

- Global Locations -

Headquarters

Future Market Insights, Inc.

Christiana Corporate, 200
Continental Drive, Suite 401,
Newark, Delaware - 19713,
United States

T: +1-845-579-5705

Americas

Future Market Insights, Inc.

616 Corporate Way, Suite 2-9018,
Valley Cottage, NY 10989, United States

T: +1-347-918-3531

MEA

Future Market Insights

1602-6 Jumeirah Bay X2 Tower, Plot No: JLT-PH2-X2A,
Jumeirah Lakes Towers, Dubai,
United Arab Emirates

Europe

Future Market Insights

3rd Floor, 207 Regent Street,
W1B 3HH London
United Kingdom

T: + 44 (0) 20 8123 9659
D: +44 (0) 20 3287 4268

Asia Pacific

Future Market Insights

IndiaLand Global Tech Park, Unit UG-1, Behind Grand HighStreet, Phase 1, Hinjawadi, MH, Pune – 411057, India

Global Microplate Instrumentation and Supplies Market Outlook

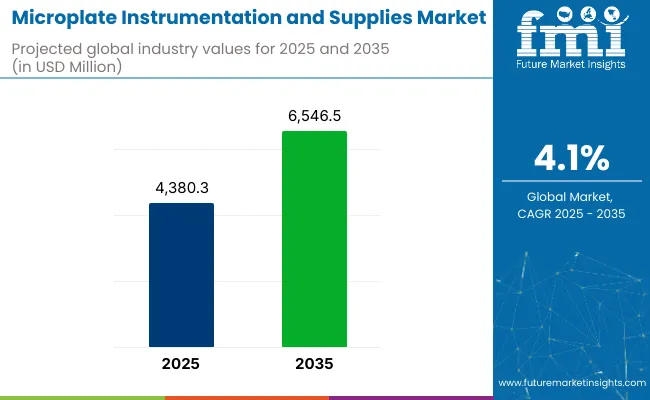
In the year 2023, it is anticipated that the global microplate instrumentation and supplies market is expected to be valued at US$ 6.4 billion. According to the market analysis figures, the global market size is anticipated to expand at a CAGR of 4.3% over the next ten years. Further, the report predicts the overall microplate instrumentation and supplies market valuation of the market to reach US$ 9.8 billion by 2033.

Microplate instrumentation and supplies play a pivotal role in laboratory automation and the simplification of research processes. Microplate instrumentation and supplies also help improve accuracy and save time for researchers while conducting experiments as compared to conventional test tubes.

Microplate instrumentation includes microplate readers that are used to detect the chemical, biological, and physical events on samples. It is primarily used for various applications such as drug discovery, assay development, etc in laboratories.

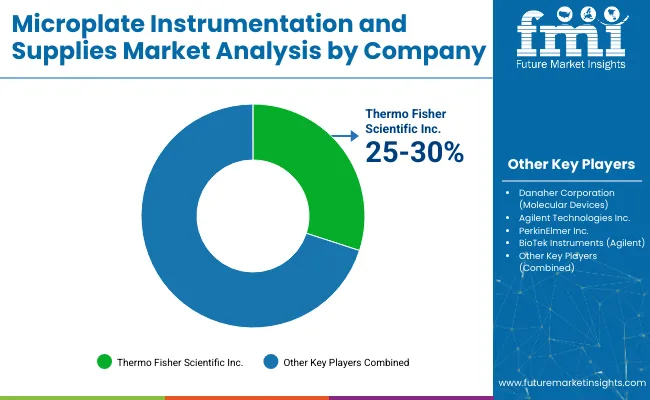
The demand for microplate instrumentation and supplies is driven by the high need for accurate testing results in healthcare and pharmaceutical research. Few of the leading players in the market are Thermo Fisher Scientific, Inc. (US), Agilent Technologies, Tecan Group Ltd, Berthold Technologies GmbH & Co. KG, and Perkin Elmer.

Microplate readers (one of the product segments of microplate instrumentation and supplies) are commonly used for the high-throughput screening of drugs in the pharmaceutical industry. The performance of microplate readers, which includes parameters such as sensitivity and throughput, are of prime importance in the pharmaceutical industry.

The growing demand for sophisticated microplate equipment is anticipated to offer lucrative prospects for market participants over the next several years. Owing to the growing demand for advanced instruments, the glass microplate market segment is poised to experience significant growth in the future.

Attributes Details
Microplate Instrumentation and Supplies Market Share (2022) US$ 6.1 billion
Microplate Instrumentation and Supplies Market Size Value (2023) US$ 6.4 billion
Microplate Instrumentation and Supplies Market Size Value (2033) US$ 9.8 billion
Microplate Instrumentation and Supplies Market Growth Rate (2023 to 2033) 4.3%

Don't pay for what you don't need

Customize your report by selecting specific countries or regions and save 30%!

Global Microplate Instrumentation and Supplies Market Historical Analysis (2017 to 2022) Vs. Forecast Outlook (2023 to 2033)

As per the previous microplate instrumentation and supplies market survey report data, the sales number has slowed down in comparison to the 2017 to 2022 period. Over those five years, the overall market progressed at an average annual rate of 5.6% and concluded at around US$ 6.1 billion in 2022.

Though the market followed a predictable low growth rate in 2018 and 2019, demand for the product skyrocketed after the outbreak of the Covid-19 pandemic. High sales of microplate instrumentation and supplies in the year 2020 and 2021 brought up the growth to a high average CAGR. However, the overall demand for microplate instrumentation and supplies has come back to normal and is anticipated to increase gradually in the future.

Increasing expenditure on research and development in the pharmaceutical & healthcare sector is expected to drive the microplate instrumentation and supplies market

Continuous growth and investments across the healthcare sector are among the key factors fueling the demand for microplate instrumentation and supplies. In addition, growth in the number of research and development activities in the pharmaceutical, healthcare, virology, and microbiology industries has strengthened over the years. These advancements in leading economies, such as the United States, Japan, and Germany, have a direct impact on the sales of microplate instrumentation and supplies.

International and local government funding has increased in various regions, driven by the development of large-scale healthcare & pharmaceutical projects. In addition, the high demand for drug discovery across the globe is ultimately bolstering the microplate instrumentation and supplies market.

Microplate sealing type instrumentation is also gaining traction owing to the need for the screening of a large number of compounds/samples. This type is used for the measurement of enzyme assays, cells, and protein assays in biological laboratories. Moreover, the high demand from drug discovery research and the need for the automation of laboratory tasks is driving the microplate sealing type market.

Nikhil Kaitwade
Nikhil Kaitwade

Principal Consultant

Talk to Analyst

Find your sweet spots for generating winning opportunities in this market.

Comparative View of Adjacent Microplate Instrumentation and Supplies Market

Microplate Instrumentation and Supplies Market:

Attributes Microplate Instrumentation and Supplies Market
CAGR (2023 to 2033) 4.3%
Market Value (2023) US$ 6.4 billion
Growth Factor Growing requirement of chemical sample testing in various sectors.
Future Opportunities Advancement in biotechnology and healthcare diagnosis technologies.
Market Trends Higher R&D spending by private players to improve the device performance.

Laboratory Balances and Scales Market:

Attributes Laboratory Balances and Scales Market
CAGR (2023 to 2033) 4.3%
Market Value (2023) US$ 1.31 billion
Growth Factor Increasing amount of research and testing facilities across the countries.
Future Opportunities Adoption of more smart laboratories in schools and higher education institutes.
Market Trends Adoption of modern technologies to improve the accuracy and precision.

Soil Field Testing Equipment Market:

Attributes Soil Field Testing Equipment Market
CAGR (2023 to 2033) 10.5%
Market Value (2023) US$ 4.5 billion
Growth Factor Growing adoption of precision farming methods and technologies.
Future Opportunities Government support in emerging nations to assist farmers in soil testing.
Market Trends Global players are mostly shifting to Asia Pacific and African countries.

Category-wise Insights

Rapid adoption of microplate readers to achieve high-throughput screening of samples

Attributes Details
Top Product Type Microplate Reader
CAGR % 2017 to 2022 5.4%
CAGR % 2023 End of Forecast (2033) 4.1%

The microplate readers segment is predicted to have the significant market share worldwide during the forecast years. With more than an estimated share of 41.3%, the microplate reader segment witnessed some downfall after the pandemic years according to a new analysis by Future Market Insights.

The demand for microplate instrumentation with various benefits, such as high throughput screening and high sensitivity, has increased significantly. Hence, the sales of microplate shaker and microplate washer segments are also estimated to register moderate growth over the forecast years.

The microplate washer market segment is also anticipated to expand significantly during the next ten years with the establishment of more research facilities. Also, the proliferation of commercial research facilities is expected to augment the microplate shaker market segment during the forecast years.

Extensive usage of microplate instrumentation and supplies in the pharmaceutical sector

Attributes Details
Top End User Industry Pharmaceuticals
CAGR % 2017 to 2022 5.2%
CAGR % 2023 End of Forecast (2033) 3.7%

Based on the industry segments of the microplate instrumentation and supplies market, the pharmaceutical segment is expected to dominate the market. The pharmaceutical segment of the market is estimated to create a revenue opportunity of over US$ 500 million between 2023 and 2033.

Other end-user industries, such as food & beverages, have also emerged as important segments for the market players recently. The enactment of strict laws for food safety and export has necessitated the high adoption of microplate instrumentation and supplies in this sector. Other than that, the chemical and polymer industries have also generated huge demand for microplate instrumentation and supplies these days. This end-user segment has primarily supported the emerging trends in the microplate strips market segment further augmenting the overall market.

Get the data you need at a Fraction of the cost

Personalize your report by choosing insights you need
and save 40%!

Country-wise Insights

North America is expected to dominate the global microplate instrumentation and supplies market due to high spending by the federation on research infrastructure. Moreover, the presence of many leading pharmaceutical companies in the region and their high spending on research and development has also strengthened the said market.

Attributes Details
United States Market Size (2033) US$ 3.5 billion
United States Absolute Dollar Growth US$ 1.2 billion
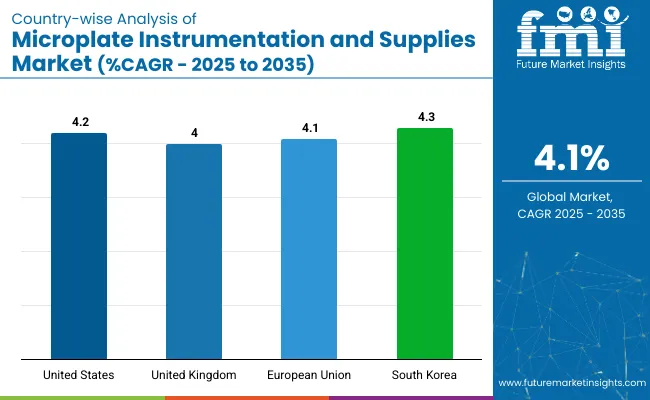
United States Market CAGR (2023 to 2033) 3.4%

The United States is one of the most prominent countries in terms of research and deveopment spending and manufacturing of sophisticated instruments. So the microplate instruments and supplies market players together are expected to contribute 33% of the market in the coming years. Moreover, the regional players focus on introducing innovative products and customizing microplate instrumentation and supplies to remain competitive.

Attributes Details
United Kingdom Market Size (2033) US$ 411.6 million
United Kingdom Absolute Dollar Growth US$ 118.1 million
United Kingdom Market CAGR (2023 to 2033) 3.2%

The demand for microplate instruments in Europe region is dominated by the United Kingdom. It is primarily due to the growing medical tourism sector in the country along with the existence of certain significant players operating in the industry.

The revenue contribution of Asia Pacific market is expected to increase at a CAGR of 5.8% during the forecast period.

Attributes Details
China Market Size (2033) US$ 701.8 million
China Absolute Dollar Growth US$ 216.1 million
China Market CAGR (2023 to 2033) 3.7%

In Asia Pacific, China invested around US$ 475 billion in research and development in 2018, which is expected to increase in the coming years. Growing government support to strengthen China’s research capabilities is projected to favor the domestic microplate instrumentation and supplies market players.

Attributes Details
India Market Size (2033) US$ 337.4 million
India Absolute Dollar Growth US$ 65.1 million
India Market CAGR (2023 to 2033) 2.2%

The usage of microplate instruments in India is expected to rise as a result of increased public funding for creating robust healthcare facilities. In addition to this, India's fast economic development, improved manufacturing facilities, and availability of trained labor have also strengthened the bio-medical research sector. However, the Indian market is still filled with certain barriers for startups and small enterprises entering the microplate instrumentation and supplies sector. Substantial financial investment is needed for the creation and commercialization of innovative products and they must make large investments to compete globally.

Attributes Details
Japan Market Size (2033) US$ 573.6 million
Japan Absolute Dollar Growth US$ 142.3 million
Japan Market CAGR (2023 to 2033) 2.9%

Japan is considered to be a well-established market for the supply and use of microplate instrumentation and supplies for its robust medical research activities. Unfortunately, in comparison to emerging economies in Asia Pacific, the performance of the regional market might be limited.

Microplate Instrumentation and Supplies Market: Competitive Landscape

As per FMI analysis, leading manufacturers in the microplate instrumentation and supplies market are focusing on the innovation of instruments. Advancements such as microplate strips can be used to analyze samples across manyl applications such as drug discovery, assay development, cell proliferation, and others.

Microplate shaker and reader manufacturers focus on introducing microplate readers that offer high-throughput screening along with high sensitivity. For example, BMG LABTECH based in Germany showcased its microplate reader products at the exhibition SLAS Europe 2018. The company has recently launched various microplate readers for high-throughput screening.

Leading players, such as Perkin Elmer and Thermo Fischer Scientific, have launched customized microplate washers with upgraded technology. Nano microplate readers for the quantification of protein and cell proliferation are also gaining traction in the glass microplate market.

Key Players Profiled in the Microplate Instrumentation and Supplies Market Report

  • Biohit Oyj
  • Bio-Rad Laboratories, Inc.
  • Beckman Coulter, Inc.
  • BioTek Instruments, Inc.
  • BMG LABTECH GmbH
  • Eppendorf AG
  • Danaher Corporation
  • PerkinElmer, Inc.
  • Thermo Fisher Scientific, Inc.
  • Tecan Group Ltd.
  • Agilent Technologies
  • Berthold Technologies GmbH & Co. KG
  • Promega Corporation.

Key Segments of Microplate Instrumentation and Supplies Market

By Product Type:

  • Microplate Readers
  • Microplate Washers
  • Microplate Dispensers
  • Microplate Accessories
  • Other Accessories

By Sales Channel:

  • Direct Sales
  • Indirect Sales

By End User Industries:

  • Pharmaceuticals
  • Food and Beverages
  • Chemicals & Polymer
  • Others

Key Regions:

  • North America
    • United States
    • Canada
  • Latin America
    • Brazil
    • Mexico
    • Rest of Latin America
  • Europe
    • Germany
    • Unite Kingdom
    • France
    • Spain
    • Russia
    • Rest of Europe
  • APEJ
    • China
    • India
    • Malaysia
    • Singapore
    • Australia
    • Rest of APEJ
  • Japan
  • MEA
    • GCC Countries
    • Israel
    • South Africa
    • Rest of MEA

Frequently Asked Questions

What is the Current Microplate Instrumentation and Supplies Market Valuation?

The market is estimated to secure a valuation of US$ 6.4 billion in 2023.

What is the Projected Size of the Microplate Instrumentation and Supplies Market by 2033?

The global market size is expected to reach US$ 9.8 billion by 2033.

What is the Growth Potential of the Microplate Instrumentation and Supplies Market?

The growth potential of the market is 4.3% through 2033.

Which Opportunities are Enhancing the Scope of the Market?

Enhancements in healthcare diagnosis technologies are creating prospects for growth.

What is China’s Growth Potential?

China market is expected to register a CAGR of 3.7% through 2033.

Table of Content

1. Executive Summary | Microplate Instrumentation and Supplies Market

    1.1. Global Market Outlook

    1.2. Demand-side Trends

    1.3. Supply-side Trends

    1.4. Technology Roadmap Analysis

    1.5. Analysis and Recommendations

2. Market Overview

    2.1. Market Coverage / Taxonomy

    2.2. Market Definition / Scope / Limitations

3. Market Background

    3.1. Market Dynamics

        3.1.1. Drivers

        3.1.2. Restraints

        3.1.3. Opportunity

        3.1.4. Trends

    3.2. Scenario Forecast

        3.2.1. Demand in Optimistic Scenario

        3.2.2. Demand in Likely Scenario

        3.2.3. Demand in Conservative Scenario

    3.3. Opportunity Map Analysis

    3.4. Product Life Cycle Analysis

    3.5. Supply Chain Analysis

        3.5.1. Supply Side Participants and their Roles

            3.5.1.1. Producers

            3.5.1.2. Mid-Level Participants (Traders/ Agents/ Brokers)

            3.5.1.3. Wholesalers and Distributors

        3.5.2. Value Added and Value Created at Node in the Supply Chain

        3.5.3. List of Raw Material Suppliers

        3.5.4. List of Existing and Potential Buyer’s

    3.6. Investment Feasibility Matrix

    3.7. Value Chain Analysis

        3.7.1. Profit Margin Analysis

        3.7.2. Wholesalers and Distributors

        3.7.3. Retailers

    3.8. PESTLE and Porter’s Analysis

    3.9. Regulatory Landscape

        3.9.1. By Key Regions

        3.9.2. By Key Countries

    3.10. Regional Parent Market Outlook

    3.11. Production and Consumption Statistics

    3.12. Import and Export Statistics

4. Global Market Analysis 2017 to 2022 and Forecast, 2023 to 2033

    4.1. Historical Market Size Value (US$ Million) & Volume (Units) Analysis, 2017 to 2022

    4.2. Current and Future Market Size Value (US$ Million) & Volume (Units) Projections, 2023 to 2033

        4.2.1. Y-o-Y Growth Trend Analysis

        4.2.2. Absolute $ Opportunity Analysis

5. Global Market Analysis 2017 to 2022 and Forecast 2023 to 2033, By Product Type

    5.1. Introduction / Key Findings

    5.2. Historical Market Size Value (US$ Million) & Volume (Units) Analysis By Product Type, 2017 to 2022

    5.3. Current and Future Market Size Value (US$ Million) & Volume (Units) Analysis and Forecast By Product Type, 2023 to 2033

        5.3.1. Microplate Reader

        5.3.2. Microplate Washer

        5.3.3. Microplate Dispenser

        5.3.4. Microplate Accessories

    5.4. Y-o-Y Growth Trend Analysis By Product Type, 2017 to 2022

    5.5. Absolute $ Opportunity Analysis By Product Type, 2023 to 2033

6. Global Market Analysis 2017 to 2022 and Forecast 2023 to 2033, By Sales Channel

    6.1. Introduction / Key Findings

    6.2. Historical Market Size Value (US$ Million) & Volume (Units) Analysis By Sales Channel, 2017 to 2022

    6.3. Current and Future Market Size Value (US$ Million) & Volume (Units) Analysis and Forecast By Sales Channel, 2023 to 2033

        6.3.1. Direct Sales

        6.3.2. Indirect Sales

    6.4. Y-o-Y Growth Trend Analysis By Sales Channel, 2017 to 2022

    6.5. Absolute $ Opportunity Analysis By Sales Channel, 2023 to 2033

7. Global Market Analysis 2017 to 2022 and Forecast 2023 to 2033, By Industry

    7.1. Introduction / Key Findings

    7.2. Historical Market Size Value (US$ Million) & Volume (Units) Analysis By Industry, 2017 to 2022

    7.3. Current and Future Market Size Value (US$ Million) & Volume (Units) Analysis and Forecast By Industry, 2023 to 2033

        7.3.1. Pharmaceuticals

        7.3.2. Food & Beverages

        7.3.3. Chemical & Polymer

        7.3.4. Others

    7.4. Y-o-Y Growth Trend Analysis By Industry, 2017 to 2022

    7.5. Absolute $ Opportunity Analysis By Industry, 2023 to 2033

8. Global Market Analysis 2017 to 2022 and Forecast 2023 to 2033, By Region

    8.1. Introduction

    8.2. Historical Market Size Value (US$ Million) & Volume (Units) Analysis By Region, 2017 to 2022

    8.3. Current Market Size Value (US$ Million) & Volume (Units) Analysis and Forecast By Region, 2023 to 2033

        8.3.1. North America

        8.3.2. Latin America

        8.3.3. Europe

        8.3.4. Asia Pacific Excluding Japan

        8.3.5. Japan

        8.3.6. Middle East and Africa

    8.4. Market Attractiveness Analysis By Region

9. North America Market Analysis 2017 to 2022 and Forecast 2023 to 2033, By Country

    9.1. Historical Market Size Value (US$ Million) & Volume (Units) Trend Analysis By Market Taxonomy, 2017 to 2022

    9.2. Market Size Value (US$ Million) & Volume (Units) Forecast By Market Taxonomy, 2023 to 2033

        9.2.1. By Country

            9.2.1.1. The USA

            9.2.1.2. Canada

        9.2.2. By Product Type

        9.2.3. By Sales Channel

        9.2.4. By Industry

    9.3. Market Attractiveness Analysis

        9.3.1. By Country

        9.3.2. By Product Type

        9.3.3. By Sales Channel

        9.3.4. By Industry

    9.4. Key Takeaways

10. Latin America Market Analysis 2017 to 2022 and Forecast 2023 to 2033, By Country

    10.1. Historical Market Size Value (US$ Million) & Volume (Units) Trend Analysis By Market Taxonomy, 2017 to 2022

    10.2. Market Size Value (US$ Million) & Volume (Units) Forecast By Market Taxonomy, 2023 to 2033

        10.2.1. By Country

            10.2.1.1. Brazil

            10.2.1.2. Mexico

            10.2.1.3. Rest of Latin America

        10.2.2. By Product Type

        10.2.3. By Sales Channel

        10.2.4. By Industry

    10.3. Market Attractiveness Analysis

        10.3.1. By Country

        10.3.2. By Product Type

        10.3.3. By Sales Channel

        10.3.4. By Industry

    10.4. Key Takeaways

11. Europe Market Analysis 2017 to 2022 and Forecast 2023 to 2033, By Country

    11.1. Historical Market Size Value (US$ Million) & Volume (Units) Trend Analysis By Market Taxonomy, 2017 to 2022

    11.2. Market Size Value (US$ Million) & Volume (Units) Forecast By Market Taxonomy, 2023 to 2033

        11.2.1. By Country

            11.2.1.1. Germany

            11.2.1.2. France

            11.2.1.3. United Kingdom

            11.2.1.4. Italy

            11.2.1.5. Spain

            11.2.1.6. Rest of Europe

        11.2.2. By Product Type

        11.2.3. By Sales Channel

        11.2.4. By Industry

    11.3. Market Attractiveness Analysis

        11.3.1. By Country

        11.3.2. By Product Type

        11.3.3. By Sales Channel

        11.3.4. By Industry

    11.4. Key Takeaways

12. Asia Pacific Excluding Japan Market Analysis 2017 to 2022 and Forecast 2023 to 2033, By Country

    12.1. Historical Market Size Value (US$ Million) & Volume (Units) Trend Analysis By Market Taxonomy, 2017 to 2022

    12.2. Market Size Value (US$ Million) & Volume (Units) Forecast By Market Taxonomy, 2023 to 2033

        12.2.1. By Country

            12.2.1.1. China

            12.2.1.2. India

            12.2.1.3. ASEAN

            12.2.1.4. Rest of Asia Pacific Excluding Japan

        12.2.2. By Product Type

        12.2.3. By Sales Channel

        12.2.4. By Industry

    12.3. Market Attractiveness Analysis

        12.3.1. By Country

        12.3.2. By Product Type

        12.3.3. By Sales Channel

        12.3.4. By Industry

    12.4. Key Takeaways

13. Japan Market Analysis 2017 to 2022 and Forecast 2023 to 2033, By Country

    13.1. Historical Market Size Value (US$ Million) & Volume (Units) Trend Analysis By Market Taxonomy, 2017 to 2022

    13.2. Market Size Value (US$ Million) & Volume (Units) Forecast By Market Taxonomy, 2023 to 2033

        13.2.1. By Country

        13.2.2. By Product Type

        13.2.3. By Sales Channel

        13.2.4. By Industry

    13.3. Market Attractiveness Analysis

        13.3.1. By Country

        13.3.2. By Product Type

        13.3.3. By Sales Channel

        13.3.4. By Industry

    13.4. Key Takeaways

14. Middle East and Africa Market Analysis 2017 to 2022 and Forecast 2023 to 2033, By Country

    14.1. Historical Market Size Value (US$ Million) & Volume (Units) Trend Analysis By Market Taxonomy, 2017 to 2022

    14.2. Market Size Value (US$ Million) & Volume (Units) Forecast By Market Taxonomy, 2023 to 2033

        14.2.1. By Country

            14.2.1.1. South Africa

            14.2.1.2. Türkiye

            14.2.1.3. Rest of Middle East and Africa

        14.2.2. By Product Type

        14.2.3. By Sales Channel

        14.2.4. By Industry

    14.3. Market Attractiveness Analysis

        14.3.1. By Country

        14.3.2. By Product Type

        14.3.3. By Sales Channel

        14.3.4. By Industry

    14.4. Key Takeaways

15. Key Countries Market Analysis

    15.1. USA

        15.1.1. Pricing Analysis

        15.1.2. Market Share Analysis, 2022

            15.1.2.1. By Product Type

            15.1.2.2. By Sales Channel

            15.1.2.3. By Industry

    15.2. Canada

        15.2.1. Pricing Analysis

        15.2.2. Market Share Analysis, 2022

            15.2.2.1. By Product Type

            15.2.2.2. By Sales Channel

            15.2.2.3. By Industry

    15.3. Brazil

        15.3.1. Pricing Analysis

        15.3.2. Market Share Analysis, 2022

            15.3.2.1. By Product Type

            15.3.2.2. By Sales Channel

            15.3.2.3. By Industry

    15.4. Mexico

        15.4.1. Pricing Analysis

        15.4.2. Market Share Analysis, 2022

            15.4.2.1. By Product Type

            15.4.2.2. By Sales Channel

            15.4.2.3. By Industry

    15.5. Germany

        15.5.1. Pricing Analysis

        15.5.2. Market Share Analysis, 2022

            15.5.2.1. By Product Type

            15.5.2.2. By Sales Channel

            15.5.2.3. By Industry

    15.6. France

        15.6.1. Pricing Analysis

        15.6.2. Market Share Analysis, 2022

            15.6.2.1. By Product Type

            15.6.2.2. By Sales Channel

            15.6.2.3. By Industry

    15.7. United Kingdom

        15.7.1. Pricing Analysis

        15.7.2. Market Share Analysis, 2022

            15.7.2.1. By Product Type

            15.7.2.2. By Sales Channel

            15.7.2.3. By Industry

    15.8. Italy

        15.8.1. Pricing Analysis

        15.8.2. Market Share Analysis, 2022

            15.8.2.1. By Product Type

            15.8.2.2. By Sales Channel

            15.8.2.3. By Industry

    15.9. Spain

        15.9.1. Pricing Analysis

        15.9.2. Market Share Analysis, 2022

            15.9.2.1. By Product Type

            15.9.2.2. By Sales Channel

            15.9.2.3. By Industry

    15.10. China

        15.10.1. Pricing Analysis

        15.10.2. Market Share Analysis, 2022

            15.10.2.1. By Product Type

            15.10.2.2. By Sales Channel

            15.10.2.3. By Industry

    15.11. India

        15.11.1. Pricing Analysis

        15.11.2. Market Share Analysis, 2022

            15.11.2.1. By Product Type

            15.11.2.2. By Sales Channel

            15.11.2.3. By Industry

    15.12. ASEAN

        15.12.1. Pricing Analysis

        15.12.2. Market Share Analysis, 2022

            15.12.2.1. By Product Type

            15.12.2.2. By Sales Channel

            15.12.2.3. By Industry

    15.13. Japan

        15.13.1. Pricing Analysis

        15.13.2. Market Share Analysis, 2022

            15.13.2.1. By Product Type

            15.13.2.2. By Sales Channel

            15.13.2.3. By Industry

    15.14. South Africa

        15.14.1. Pricing Analysis

        15.14.2. Market Share Analysis, 2022

            15.14.2.1. By Product Type

            15.14.2.2. By Sales Channel

            15.14.2.3. By Industry

    15.15. Türkiye

        15.15.1. Pricing Analysis

        15.15.2. Market Share Analysis, 2022

            15.15.2.1. By Product Type

            15.15.2.2. By Sales Channel

            15.15.2.3. By Industry

16. Market Structure Analysis

    16.1. Competition Dashboard

    16.2. Competition Benchmarking

    16.3. Market Share Analysis of Top Players

        16.3.1. By Regional

        16.3.2. By Product Type

        16.3.3. By Sales Channel

        16.3.4. By Industry

17. Competition Analysis

    17.1. Competition Deep Dive

        17.1.1. Beckman Coulter, Inc.

            17.1.1.1. Overview

            17.1.1.2. Product Portfolio

            17.1.1.3. Profitability by Market Segments

            17.1.1.4. Sales Footprint

            17.1.1.5. Strategy Overview

                17.1.1.5.1. Marketing Strategy

                17.1.1.5.2. Product Strategy

                17.1.1.5.3. Channel Strategy

        17.1.2. Biohit Oyj

            17.1.2.1. Overview

            17.1.2.2. Product Portfolio

            17.1.2.3. Profitability by Market Segments

            17.1.2.4. Sales Footprint

            17.1.2.5. Strategy Overview

                17.1.2.5.1. Marketing Strategy

                17.1.2.5.2. Product Strategy

                17.1.2.5.3. Channel Strategy

        17.1.3. Bio-Rad Laboratories, Inc.

            17.1.3.1. Overview

            17.1.3.2. Product Portfolio

            17.1.3.3. Profitability by Market Segments

            17.1.3.4. Sales Footprint

            17.1.3.5. Strategy Overview

                17.1.3.5.1. Marketing Strategy

                17.1.3.5.2. Product Strategy

                17.1.3.5.3. Channel Strategy

        17.1.4. Agilent

            17.1.4.1. Overview

            17.1.4.2. Product Portfolio

            17.1.4.3. Profitability by Market Segments

            17.1.4.4. Sales Footprint

            17.1.4.5. Strategy Overview

                17.1.4.5.1. Marketing Strategy

                17.1.4.5.2. Product Strategy

                17.1.4.5.3. Channel Strategy

        17.1.5. BMG Labtech GmbH

            17.1.5.1. Overview

            17.1.5.2. Product Portfolio

            17.1.5.3. Profitability by Market Segments

            17.1.5.4. Sales Footprint

            17.1.5.5. Strategy Overview

                17.1.5.5.1. Marketing Strategy

                17.1.5.5.2. Product Strategy

                17.1.5.5.3. Channel Strategy

        17.1.6. Eppendorf AG

            17.1.6.1. Overview

            17.1.6.2. Product Portfolio

            17.1.6.3. Profitability by Market Segments

            17.1.6.4. Sales Footprint

            17.1.6.5. Strategy Overview

                17.1.6.5.1. Marketing Strategy

                17.1.6.5.2. Product Strategy

                17.1.6.5.3. Channel Strategy

        17.1.7. Danaher Corporation

            17.1.7.1. Overview

            17.1.7.2. Product Portfolio

            17.1.7.3. Profitability by Market Segments

            17.1.7.4. Sales Footprint

            17.1.7.5. Strategy Overview

                17.1.7.5.1. Marketing Strategy

                17.1.7.5.2. Product Strategy

                17.1.7.5.3. Channel Strategy

        17.1.8. PerkinElmer, Inc.

            17.1.8.1. Overview

            17.1.8.2. Product Portfolio

            17.1.8.3. Profitability by Market Segments

            17.1.8.4. Sales Footprint

            17.1.8.5. Strategy Overview

                17.1.8.5.1. Marketing Strategy

                17.1.8.5.2. Product Strategy

                17.1.8.5.3. Channel Strategy

        17.1.9. Tecan Group Ltd.

            17.1.9.1. Overview

            17.1.9.2. Product Portfolio

            17.1.9.3. Profitability by Market Segments

            17.1.9.4. Sales Footprint

            17.1.9.5. Strategy Overview

                17.1.9.5.1. Marketing Strategy

                17.1.9.5.2. Product Strategy

                17.1.9.5.3. Channel Strategy

        17.1.10. Thermo Fisher Scientific, Inc.

            17.1.10.1. Overview

            17.1.10.2. Product Portfolio

            17.1.10.3. Profitability by Market Segments

            17.1.10.4. Sales Footprint

            17.1.10.5. Strategy Overview

                17.1.10.5.1. Marketing Strategy

                17.1.10.5.2. Product Strategy

                17.1.10.5.3. Channel Strategy

18. Assumptions & Acronyms Used

19. Research Methodology

Don't pay for what you don't need

Customize your report by selecting specific countries or regions and save 30%!

List of Tables

Table 1: Global Market Value (US$ Million) Forecast by Region, 2017 to 2033

Table 2: Global Market Volume (Units) Forecast by Region, 2017 to 2033

Table 3: Global Market Value (US$ Million) Forecast by Product Type, 2017 to 2033

Table 4: Global Market Volume (Units) Forecast by Product Type, 2017 to 2033

Table 5: Global Market Value (US$ Million) Forecast by Sales Channel, 2017 to 2033

Table 6: Global Market Volume (Units) Forecast by Sales Channel, 2017 to 2033

Table 7: Global Market Value (US$ Million) Forecast by Industry, 2017 to 2033

Table 8: Global Market Volume (Units) Forecast by Industry, 2017 to 2033

Table 9: North America Market Value (US$ Million) Forecast by Country, 2017 to 2033

Table 10: North America Market Volume (Units) Forecast by Country, 2017 to 2033

Table 11: North America Market Value (US$ Million) Forecast by Product Type, 2017 to 2033

Table 12: North America Market Volume (Units) Forecast by Product Type, 2017 to 2033

Table 13: North America Market Value (US$ Million) Forecast by Sales Channel, 2017 to 2033

Table 14: North America Market Volume (Units) Forecast by Sales Channel, 2017 to 2033

Table 15: North America Market Value (US$ Million) Forecast by Industry, 2017 to 2033

Table 16: North America Market Volume (Units) Forecast by Industry, 2017 to 2033

Table 17: Latin America Market Value (US$ Million) Forecast by Country, 2017 to 2033

Table 18: Latin America Market Volume (Units) Forecast by Country, 2017 to 2033

Table 19: Latin America Market Value (US$ Million) Forecast by Product Type, 2017 to 2033

Table 20: Latin America Market Volume (Units) Forecast by Product Type, 2017 to 2033

Table 21: Latin America Market Value (US$ Million) Forecast by Sales Channel, 2017 to 2033

Table 22: Latin America Market Volume (Units) Forecast by Sales Channel, 2017 to 2033

Table 23: Latin America Market Value (US$ Million) Forecast by Industry, 2017 to 2033

Table 24: Latin America Market Volume (Units) Forecast by Industry, 2017 to 2033

Table 25: Europe Market Value (US$ Million) Forecast by Country, 2017 to 2033

Table 26: Europe Market Volume (Units) Forecast by Country, 2017 to 2033

Table 27: Europe Market Value (US$ Million) Forecast by Product Type, 2017 to 2033

Table 28: Europe Market Volume (Units) Forecast by Product Type, 2017 to 2033

Table 29: Europe Market Value (US$ Million) Forecast by Sales Channel, 2017 to 2033

Table 30: Europe Market Volume (Units) Forecast by Sales Channel, 2017 to 2033

Table 31: Europe Market Value (US$ Million) Forecast by Industry, 2017 to 2033

Table 32: Europe Market Volume (Units) Forecast by Industry, 2017 to 2033

Table 33: Asia Pacific Excluding Japan Market Value (US$ Million) Forecast by Country, 2017 to 2033

Table 34: Asia Pacific Excluding Japan Market Volume (Units) Forecast by Country, 2017 to 2033

Table 35: Asia Pacific Excluding Japan Market Value (US$ Million) Forecast by Product Type, 2017 to 2033

Table 36: Asia Pacific Excluding Japan Market Volume (Units) Forecast by Product Type, 2017 to 2033

Table 37: Asia Pacific Excluding Japan Market Value (US$ Million) Forecast by Sales Channel, 2017 to 2033

Table 38: Asia Pacific Excluding Japan Market Volume (Units) Forecast by Sales Channel, 2017 to 2033

Table 39: Asia Pacific Excluding Japan Market Value (US$ Million) Forecast by Industry, 2017 to 2033

Table 40: Asia Pacific Excluding Japan Market Volume (Units) Forecast by Industry, 2017 to 2033

Table 41: Japan Market Value (US$ Million) Forecast by Country, 2017 to 2033

Table 42: Japan Market Volume (Units) Forecast by Country, 2017 to 2033

Table 43: Japan Market Value (US$ Million) Forecast by Product Type, 2017 to 2033

Table 44: Japan Market Volume (Units) Forecast by Product Type, 2017 to 2033

Table 45: Japan Market Value (US$ Million) Forecast by Sales Channel, 2017 to 2033

Table 46: Japan Market Volume (Units) Forecast by Sales Channel, 2017 to 2033

Table 47: Japan Market Value (US$ Million) Forecast by Industry, 2017 to 2033

Table 48: Japan Market Volume (Units) Forecast by Industry, 2017 to 2033

Table 49: Middle East and Africa Market Value (US$ Million) Forecast by Country, 2017 to 2033

Table 50: Middle East and Africa Market Volume (Units) Forecast by Country, 2017 to 2033

Table 51: Middle East and Africa Market Value (US$ Million) Forecast by Product Type, 2017 to 2033

Table 52: Middle East and Africa Market Volume (Units) Forecast by Product Type, 2017 to 2033

Table 53: Middle East and Africa Market Value (US$ Million) Forecast by Sales Channel, 2017 to 2033

Table 54: Middle East and Africa Market Volume (Units) Forecast by Sales Channel, 2017 to 2033

Table 55: Middle East and Africa Market Value (US$ Million) Forecast by Industry, 2017 to 2033

Table 56: Middle East and Africa Market Volume (Units) Forecast by Industry, 2017 to 2033
Nikhil Kaitwade
Nikhil Kaitwade

Principal Consultant

Talk to Analyst

Find your sweet spots for generating winning opportunities in this market.

List of Charts

Figure 1: Global Market Value (US$ Million) by Product Type, 2023 to 2033

Figure 2: Global Market Value (US$ Million) by Sales Channel, 2023 to 2033

Figure 3: Global Market Value (US$ Million) by Industry, 2023 to 2033

Figure 4: Global Market Value (US$ Million) by Region, 2023 to 2033

Figure 5: Global Market Value (US$ Million) Analysis by Region, 2017 to 2033

Figure 6: Global Market Volume (Units) Analysis by Region, 2017 to 2033

Figure 7: Global Market Value Share (%) and BPS Analysis by Region, 2023 to 2033

Figure 8: Global Market Y-o-Y Growth (%) Projections by Region, 2023 to 2033

Figure 9: Global Market Value (US$ Million) Analysis by Product Type, 2017 to 2033

Figure 10: Global Market Volume (Units) Analysis by Product Type, 2017 to 2033

Figure 11: Global Market Value Share (%) and BPS Analysis by Product Type, 2023 to 2033

Figure 12: Global Market Y-o-Y Growth (%) Projections by Product Type, 2023 to 2033

Figure 13: Global Market Value (US$ Million) Analysis by Sales Channel, 2017 to 2033

Figure 14: Global Market Volume (Units) Analysis by Sales Channel, 2017 to 2033

Figure 15: Global Market Value Share (%) and BPS Analysis by Sales Channel, 2023 to 2033

Figure 16: Global Market Y-o-Y Growth (%) Projections by Sales Channel, 2023 to 2033

Figure 17: Global Market Value (US$ Million) Analysis by Industry, 2017 to 2033

Figure 18: Global Market Volume (Units) Analysis by Industry, 2017 to 2033

Figure 19: Global Market Value Share (%) and BPS Analysis by Industry, 2023 to 2033

Figure 20: Global Market Y-o-Y Growth (%) Projections by Industry, 2023 to 2033

Figure 21: Global Market Attractiveness by Product Type, 2023 to 2033

Figure 22: Global Market Attractiveness by Sales Channel, 2023 to 2033

Figure 23: Global Market Attractiveness by Industry, 2023 to 2033

Figure 24: Global Market Attractiveness by Region, 2023 to 2033

Figure 25: North America Market Value (US$ Million) by Product Type, 2023 to 2033

Figure 26: North America Market Value (US$ Million) by Sales Channel, 2023 to 2033

Figure 27: North America Market Value (US$ Million) by Industry, 2023 to 2033

Figure 28: North America Market Value (US$ Million) by Country, 2023 to 2033

Figure 29: North America Market Value (US$ Million) Analysis by Country, 2017 to 2033

Figure 30: North America Market Volume (Units) Analysis by Country, 2017 to 2033

Figure 31: North America Market Value Share (%) and BPS Analysis by Country, 2023 to 2033

Figure 32: North America Market Y-o-Y Growth (%) Projections by Country, 2023 to 2033

Figure 33: North America Market Value (US$ Million) Analysis by Product Type, 2017 to 2033

Figure 34: North America Market Volume (Units) Analysis by Product Type, 2017 to 2033

Figure 35: North America Market Value Share (%) and BPS Analysis by Product Type, 2023 to 2033

Figure 36: North America Market Y-o-Y Growth (%) Projections by Product Type, 2023 to 2033

Figure 37: North America Market Value (US$ Million) Analysis by Sales Channel, 2017 to 2033

Figure 38: North America Market Volume (Units) Analysis by Sales Channel, 2017 to 2033

Figure 39: North America Market Value Share (%) and BPS Analysis by Sales Channel, 2023 to 2033

Figure 40: North America Market Y-o-Y Growth (%) Projections by Sales Channel, 2023 to 2033

Figure 41: North America Market Value (US$ Million) Analysis by Industry, 2017 to 2033

Figure 42: North America Market Volume (Units) Analysis by Industry, 2017 to 2033

Figure 43: North America Market Value Share (%) and BPS Analysis by Industry, 2023 to 2033

Figure 44: North America Market Y-o-Y Growth (%) Projections by Industry, 2023 to 2033

Figure 45: North America Market Attractiveness by Product Type, 2023 to 2033

Figure 46: North America Market Attractiveness by Sales Channel, 2023 to 2033

Figure 47: North America Market Attractiveness by Industry, 2023 to 2033

Figure 48: North America Market Attractiveness by Country, 2023 to 2033

Figure 49: Latin America Market Value (US$ Million) by Product Type, 2023 to 2033

Figure 50: Latin America Market Value (US$ Million) by Sales Channel, 2023 to 2033

Figure 51: Latin America Market Value (US$ Million) by Industry, 2023 to 2033

Figure 52: Latin America Market Value (US$ Million) by Country, 2023 to 2033

Figure 53: Latin America Market Value (US$ Million) Analysis by Country, 2017 to 2033

Figure 54: Latin America Market Volume (Units) Analysis by Country, 2017 to 2033

Figure 55: Latin America Market Value Share (%) and BPS Analysis by Country, 2023 to 2033

Figure 56: Latin America Market Y-o-Y Growth (%) Projections by Country, 2023 to 2033

Figure 57: Latin America Market Value (US$ Million) Analysis by Product Type, 2017 to 2033

Figure 58: Latin America Market Volume (Units) Analysis by Product Type, 2017 to 2033

Figure 59: Latin America Market Value Share (%) and BPS Analysis by Product Type, 2023 to 2033

Figure 60: Latin America Market Y-o-Y Growth (%) Projections by Product Type, 2023 to 2033

Figure 61: Latin America Market Value (US$ Million) Analysis by Sales Channel, 2017 to 2033

Figure 62: Latin America Market Volume (Units) Analysis by Sales Channel, 2017 to 2033

Figure 63: Latin America Market Value Share (%) and BPS Analysis by Sales Channel, 2023 to 2033

Figure 64: Latin America Market Y-o-Y Growth (%) Projections by Sales Channel, 2023 to 2033

Figure 65: Latin America Market Value (US$ Million) Analysis by Industry, 2017 to 2033

Figure 66: Latin America Market Volume (Units) Analysis by Industry, 2017 to 2033

Figure 67: Latin America Market Value Share (%) and BPS Analysis by Industry, 2023 to 2033

Figure 68: Latin America Market Y-o-Y Growth (%) Projections by Industry, 2023 to 2033

Figure 69: Latin America Market Attractiveness by Product Type, 2023 to 2033

Figure 70: Latin America Market Attractiveness by Sales Channel, 2023 to 2033

Figure 71: Latin America Market Attractiveness by Industry, 2023 to 2033

Figure 72: Latin America Market Attractiveness by Country, 2023 to 2033

Figure 73: Europe Market Value (US$ Million) by Product Type, 2023 to 2033

Figure 74: Europe Market Value (US$ Million) by Sales Channel, 2023 to 2033

Figure 75: Europe Market Value (US$ Million) by Industry, 2023 to 2033

Figure 76: Europe Market Value (US$ Million) by Country, 2023 to 2033

Figure 77: Europe Market Value (US$ Million) Analysis by Country, 2017 to 2033

Figure 78: Europe Market Volume (Units) Analysis by Country, 2017 to 2033

Figure 79: Europe Market Value Share (%) and BPS Analysis by Country, 2023 to 2033

Figure 80: Europe Market Y-o-Y Growth (%) Projections by Country, 2023 to 2033

Figure 81: Europe Market Value (US$ Million) Analysis by Product Type, 2017 to 2033

Figure 82: Europe Market Volume (Units) Analysis by Product Type, 2017 to 2033

Figure 83: Europe Market Value Share (%) and BPS Analysis by Product Type, 2023 to 2033

Figure 84: Europe Market Y-o-Y Growth (%) Projections by Product Type, 2023 to 2033

Figure 85: Europe Market Value (US$ Million) Analysis by Sales Channel, 2017 to 2033

Figure 86: Europe Market Volume (Units) Analysis by Sales Channel, 2017 to 2033

Figure 87: Europe Market Value Share (%) and BPS Analysis by Sales Channel, 2023 to 2033

Figure 88: Europe Market Y-o-Y Growth (%) Projections by Sales Channel, 2023 to 2033

Figure 89: Europe Market Value (US$ Million) Analysis by Industry, 2017 to 2033

Figure 90: Europe Market Volume (Units) Analysis by Industry, 2017 to 2033

Figure 91: Europe Market Value Share (%) and BPS Analysis by Industry, 2023 to 2033

Figure 92: Europe Market Y-o-Y Growth (%) Projections by Industry, 2023 to 2033

Figure 93: Europe Market Attractiveness by Product Type, 2023 to 2033

Figure 94: Europe Market Attractiveness by Sales Channel, 2023 to 2033

Figure 95: Europe Market Attractiveness by Industry, 2023 to 2033

Figure 96: Europe Market Attractiveness by Country, 2023 to 2033

Figure 97: Asia Pacific Excluding Japan Market Value (US$ Million) by Product Type, 2023 to 2033

Figure 98: Asia Pacific Excluding Japan Market Value (US$ Million) by Sales Channel, 2023 to 2033

Figure 99: Asia Pacific Excluding Japan Market Value (US$ Million) by Industry, 2023 to 2033

Figure 100: Asia Pacific Excluding Japan Market Value (US$ Million) by Country, 2023 to 2033

Figure 101: Asia Pacific Excluding Japan Market Value (US$ Million) Analysis by Country, 2017 to 2033

Figure 102: Asia Pacific Excluding Japan Market Volume (Units) Analysis by Country, 2017 to 2033

Figure 103: Asia Pacific Excluding Japan Market Value Share (%) and BPS Analysis by Country, 2023 to 2033

Figure 104: Asia Pacific Excluding Japan Market Y-o-Y Growth (%) Projections by Country, 2023 to 2033

Figure 105: Asia Pacific Excluding Japan Market Value (US$ Million) Analysis by Product Type, 2017 to 2033

Figure 106: Asia Pacific Excluding Japan Market Volume (Units) Analysis by Product Type, 2017 to 2033

Figure 107: Asia Pacific Excluding Japan Market Value Share (%) and BPS Analysis by Product Type, 2023 to 2033

Figure 108: Asia Pacific Excluding Japan Market Y-o-Y Growth (%) Projections by Product Type, 2023 to 2033

Figure 109: Asia Pacific Excluding Japan Market Value (US$ Million) Analysis by Sales Channel, 2017 to 2033

Figure 110: Asia Pacific Excluding Japan Market Volume (Units) Analysis by Sales Channel, 2017 to 2033

Figure 111: Asia Pacific Excluding Japan Market Value Share (%) and BPS Analysis by Sales Channel, 2023 to 2033

Figure 112: Asia Pacific Excluding Japan Market Y-o-Y Growth (%) Projections by Sales Channel, 2023 to 2033

Figure 113: Asia Pacific Excluding Japan Market Value (US$ Million) Analysis by Industry, 2017 to 2033

Figure 114: Asia Pacific Excluding Japan Market Volume (Units) Analysis by Industry, 2017 to 2033

Figure 115: Asia Pacific Excluding Japan Market Value Share (%) and BPS Analysis by Industry, 2023 to 2033

Figure 116: Asia Pacific Excluding Japan Market Y-o-Y Growth (%) Projections by Industry, 2023 to 2033

Figure 117: Asia Pacific Excluding Japan Market Attractiveness by Product Type, 2023 to 2033

Figure 118: Asia Pacific Excluding Japan Market Attractiveness by Sales Channel, 2023 to 2033

Figure 119: Asia Pacific Excluding Japan Market Attractiveness by Industry, 2023 to 2033

Figure 120: Asia Pacific Excluding Japan Market Attractiveness by Country, 2023 to 2033

Figure 121: Japan Market Value (US$ Million) by Product Type, 2023 to 2033

Figure 122: Japan Market Value (US$ Million) by Sales Channel, 2023 to 2033

Figure 123: Japan Market Value (US$ Million) by Industry, 2023 to 2033

Figure 124: Japan Market Value (US$ Million) by Country, 2023 to 2033

Figure 125: Japan Market Value (US$ Million) Analysis by Country, 2017 to 2033

Figure 126: Japan Market Volume (Units) Analysis by Country, 2017 to 2033

Figure 127: Japan Market Value Share (%) and BPS Analysis by Country, 2023 to 2033

Figure 128: Japan Market Y-o-Y Growth (%) Projections by Country, 2023 to 2033

Figure 129: Japan Market Value (US$ Million) Analysis by Product Type, 2017 to 2033

Figure 130: Japan Market Volume (Units) Analysis by Product Type, 2017 to 2033

Figure 131: Japan Market Value Share (%) and BPS Analysis by Product Type, 2023 to 2033

Figure 132: Japan Market Y-o-Y Growth (%) Projections by Product Type, 2023 to 2033

Figure 133: Japan Market Value (US$ Million) Analysis by Sales Channel, 2017 to 2033

Figure 134: Japan Market Volume (Units) Analysis by Sales Channel, 2017 to 2033

Figure 135: Japan Market Value Share (%) and BPS Analysis by Sales Channel, 2023 to 2033

Figure 136: Japan Market Y-o-Y Growth (%) Projections by Sales Channel, 2023 to 2033

Figure 137: Japan Market Value (US$ Million) Analysis by Industry, 2017 to 2033

Figure 138: Japan Market Volume (Units) Analysis by Industry, 2017 to 2033

Figure 139: Japan Market Value Share (%) and BPS Analysis by Industry, 2023 to 2033

Figure 140: Japan Market Y-o-Y Growth (%) Projections by Industry, 2023 to 2033

Figure 141: Japan Market Attractiveness by Product Type, 2023 to 2033

Figure 142: Japan Market Attractiveness by Sales Channel, 2023 to 2033

Figure 143: Japan Market Attractiveness by Industry, 2023 to 2033

Figure 144: Japan Market Attractiveness by Country, 2023 to 2033

Figure 145: Middle East and Africa Market Value (US$ Million) by Product Type, 2023 to 2033

Figure 146: Middle East and Africa Market Value (US$ Million) by Sales Channel, 2023 to 2033

Figure 147: Middle East and Africa Market Value (US$ Million) by Industry, 2023 to 2033

Figure 148: Middle East and Africa Market Value (US$ Million) by Country, 2023 to 2033

Figure 149: Middle East and Africa Market Value (US$ Million) Analysis by Country, 2017 to 2033

Figure 150: Middle East and Africa Market Volume (Units) Analysis by Country, 2017 to 2033

Figure 151: Middle East and Africa Market Value Share (%) and BPS Analysis by Country, 2023 to 2033

Figure 152: Middle East and Africa Market Y-o-Y Growth (%) Projections by Country, 2023 to 2033

Figure 153: Middle East and Africa Market Value (US$ Million) Analysis by Product Type, 2017 to 2033

Figure 154: Middle East and Africa Market Volume (Units) Analysis by Product Type, 2017 to 2033

Figure 155: Middle East and Africa Market Value Share (%) and BPS Analysis by Product Type, 2023 to 2033

Figure 156: Middle East and Africa Market Y-o-Y Growth (%) Projections by Product Type, 2023 to 2033

Figure 157: Middle East and Africa Market Value (US$ Million) Analysis by Sales Channel, 2017 to 2033

Figure 158: Middle East and Africa Market Volume (Units) Analysis by Sales Channel, 2017 to 2033

Figure 159: Middle East and Africa Market Value Share (%) and BPS Analysis by Sales Channel, 2023 to 2033

Figure 160: Middle East and Africa Market Y-o-Y Growth (%) Projections by Sales Channel, 2023 to 2033

Figure 161: Middle East and Africa Market Value (US$ Million) Analysis by Industry, 2017 to 2033

Figure 162: Middle East and Africa Market Volume (Units) Analysis by Industry, 2017 to 2033

Figure 163: Middle East and Africa Market Value Share (%) and BPS Analysis by Industry, 2023 to 2033

Figure 164: Middle East and Africa Market Y-o-Y Growth (%) Projections by Industry, 2023 to 2033

Figure 165: Middle East and Africa Market Attractiveness by Product Type, 2023 to 2033

Figure 166: Middle East and Africa Market Attractiveness by Sales Channel, 2023 to 2033

Figure 167: Middle East and Africa Market Attractiveness by Industry, 2023 to 2033

Figure 168: Middle East and Africa Market Attractiveness by Country, 2023 to 2033

Explore Testing Equipment Insights

View Reports

Microplate Instrumentation and Supplies Market