Chromatography Instrumentation Market Outlook from 2024 to 2034

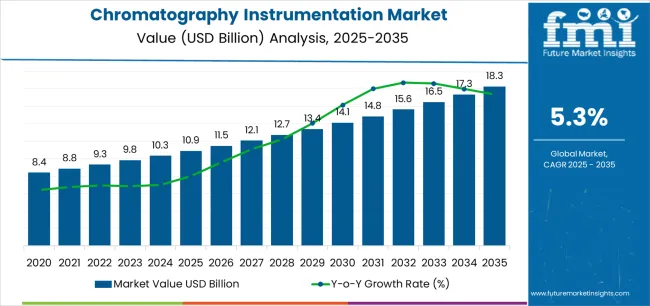
The global chromatography instrumentation market is expected to grow from US$ 10.3 billion in 2024 to US$ 17.7 billion by 2034. By 2034, the market is projected to surge at a 5.6% CAGR.

Attributes Key Insights
Estimated Global Chromatography Instrumentation Market Size (2024E) US$ 10.3 billion
Projected Chromatography Instrumentation Market Value (2034F) US$ 17.7 billion
Value-based CAGR (2024 to 2034) 5.6%

Don't pay for what you don't need

Customize your report by selecting specific countries or regions and save 30%!

Chromatography Instrumentation Market Overview

  • Growing applications in proteomics & metabolomics, rising demand for biopharmaceuticals, and increased research & development efforts are fueling the chromatography instrumentation market.
  • Chromatography is a key component of quality control, testing, and drug development in the pharmaceutical and biotechnology sectors. Strict quality standards and the growing need for innovative medications influence the market.
  • The necessity for chromatography instrumentations in the purification and analysis of biologics is surging due to the growing demand for biopharmaceuticals, which include vaccines and monoclonal antibodies.
  • The need for chromatography instrumentations is further fueled by the expansion of research & development initiatives across several industries, including biotechnology, pharmaceuticals, environmental science, and healthcare.
  • The efficiency and throughput of chromatography instrumentations are growing with the incorporation of automation in sample handling and data processing, which is driving the demand for chromatography instrumentations in laboratory settings.

2019 to 2023 Chromatography Instrumentation Market Growth Vs. 2024 to 2034

The global chromatography instrumentation sales grew at a CAGR of 8.1% from 2019 to 2023. The growth of chromatography instrumentations from 2019 to 2023 can be attributed to a convergence of factors:

  • Automation emerged as a prominent trend with the advent of automated systems for sample preparation, data collection, and analysis. Integrating chromatographic instrumentations with cutting-edge software solutions improved efficiency, minimized human error, and streamlined workflows.
  • Chromatography instrumentations have become more widely used in the pharmaceutical and life science sectors for quality control, medication development, and discovery. Chromatography was essential in guaranteeing the effectiveness and safety of pharmaceuticals.
  • Chromatography instrumentations are used in environmental analysis, especially for air and water quality monitoring. Chromatography applications in this field have grown due to the technology's capacity to identify and measure environmental pollutants.
  • Chromatography has become an increasingly important tool for quality assurance and safety testing in the food & beverage sector. The capacity to examine food ingredients, preservatives, and pollutants helped raise food safety regulations.

By 2034, the market for chromatography instrumentations is expected to rise at a 5.6% CAGR.

  • The market for chromatography instrumentations has much room to expand, especially in developing regions such as Asia Pacific and Latin America. The market in these regions is growing due to increased industrialization, research endeavors, and an emphasis on enhancing healthcare infrastructure.
  • Customers are looking for more adaptable solutions to satisfy certain analytical needs. One noteworthy trend is integrating chromatography instrumentations with other analytical tools and techniques to create comprehensive analytical platforms.
Sabyasachi Ghosh
Sabyasachi Ghosh

Principal Consultant

Talk to Analyst

Find your sweet spots for generating winning opportunities in this market.

Key Chromatography Instrumentation Market Trends

  • The market is expanding due to continuous technical developments in chromatography instrumentations, such as better detectors, column technologies, and software solutions. These developments are improving chromatographic sensitivity, speed, and efficiency.
  • To increase productivity, minimize human error, and streamline processes, the market for chromatography instrumentations is witnessing a growth in demand for automated systems. Solutions for automated data analysis and sample preparation are gaining traction in the market.
  • Chromatography instrumentation is extensively utilized in pharmaceutical industries for research, quality assurance, and medication development.
  • The growing emphasis on biopharmaceuticals and personalized treatment is fueling the market expansion.

Restraining Factors in the Chromatography Instrumentation Market

  • The initial outlay needed to buy chromatography instrumentations is substantial and includes the price of the apparatus, consumables, and upkeep.
  • Certain chromatographic instrumentations are difficult to operate and require expert staff to ensure correct handling. The need for skilled professionals is set to hamper adoption in small-scale facilities or those with limited access to specialized expertise.
  • Although spectroscopy and mass spectrometry are common analytical techniques, they are more cost-effective for several applications than chromatography. The accessibility of substitute techniques is set to impact the development of the chromatography instrumentation market.

Get the data you need at a Fraction of the cost

Personalize your report by choosing insights you need
and save 40%!

Comparative View of Adjacent Markets

A comprehensive analysis of growth and challenges has been tabulated below. The chromatography instrumentation market is compared with two industries that have the potential to compete rigorously: the podiatry service market and the aortic endograft market.

The growth rates and key market trends are mentioned in the table below. Among the mentioned markets, the chromatography instrumentation market is poised to rise more rapidly during the forecast period.

Chromatography Instrumentation Market:

Attributes Chromatography Instrumentation Market
CAGR (2024 to 2034) 5.6%
Growth Avenues in the Chromatography Instrumentationation Companies have an opportunity to provide advanced data management and analytics solutions to enable improved interpretation & usage of analytical results due to the rising volume of data created by chromatography instrumentations.
Key Trends Chromatography instrumentations have found prospects in drug development due to the growing emphasis on personalized medicine and targeted therapy. These technologies are crucial for analyzing complicated biomolecules and guaranteeing the quality of the final product.

Podiatry Service Market:

Attributes Podiatry Service Market
CAGR (2024 to 2034) 3.6%
Growth Factor Preventive podiatry treatment, particularly for high-risk patient populations such as diabetics, is becoming increasingly popular. This care includes education on foot health, early diagnosis of problems, and proactive therapy to prevent complications.
Key Trends In order to empower people to take better care of their feet, podiatrists are putting more of a focus on patient education and awareness. This involves teaching patients about preventative care, foot exercises, and appropriate footwear.

Aortic Endograft Market:

Attributes Aortic Endograft Market
CAGR (2024 to 2034) 4.9%
Growth Factor To enhance device performance, longevity, and patient outcomes, ongoing scientific breakthroughs in endograft design, materials, and delivery methods are being made. Branching and fenestrated endografts are innovations for more complicated anatomy.
Key Trends The increasing need for aortic endograft is partly due to the rising incidence of aortic aneurysms and dissections, frequently linked to aging populations and lifestyle factors.

Country-wise Insights

The table below shows the estimated growth rates of the top five countries. The United Kingdom, South Korea, and Japan are set to record high CAGRs of 6.6%, 7.6%, and 6.4%, respectively, through 2034.

Countries Projected CAGR (2024 to 2034)
United States 5.7%
United Kingdom 6.6%
China 6.2%
South Korea 7.6%
Japan 6.4%

The table below explains the chromatography instrumentation market size of the top five countries for 2034. Among them, the United States is anticipated to remain at the forefront by reaching a valuation of US$ 3.2 billion. China is expected to reach a valuation of US$ 2.7 billion by 2034.

Countries Market Values (2034)
United States US$ 3.2 billion
United Kingdom US$ 676.4 million
China US$ 2.7 billion
South Korea US$ 1.1 billion
Japan US$ 1.9 billion

Growing Technological Developments in the United States to Surge Sales

The United States chromatography instrumentation industry is poised to exhibit a CAGR of 5.7% during the assessment period. By 2034, the United States market is expected to reach US$ 3.2 billion. The factors driving the market growth are as follows:

  • The existence of leading companies in the analytical instrumentation market is the defining feature of the United States chromatography instrumentation market.
  • The market is witnessing ongoing technology developments, such as enhancements in automation, detector sensitivity, and column technologies.
  • The biotech and pharmaceutical industries are driving the United States market for chromatography instrumentations.
  • Clinical laboratories in the United States employ chromatography instrumentations for diagnostic work.

Growing Demand in Food and Beverage Sector Propelling Demand in China

The demand for chromatography instrumentations in China is anticipated to rise at a steady CAGR of 6.2% during the forecast period. This is attributable to a combination of factors, including:

  • China is a leader in using chromatographic instrumentations due to its emphasis on environmental monitoring and compliance with environmental standards. This equipment analyzes air, water, and soil samples to guarantee environmental safety and compliance.
  • Chromatography instrumentations are essential to the food and beverage sector in China as they allow for testing and verifying food products' safety and quality. This includes examining pollutants, additions, and nutritional elements.

Increasing Research and Development Activities to Boost Demand in Japan

Japan's chromatography instrumentation market is expected to reach a valuation of around US$ 1.9 billion by 2034. Emerging patterns in Japan’s market are as follows:

  • In Japan, chromatography instrumentations are used in clinical diagnostics and healthcare settings. They are employed in essential clinical testing, therapeutic medication monitoring, and biomarker analysis.
  • As environmental sustainability is widely recognized, ‘green chromatography’ techniques, which emphasize using environmentally friendly solvents and sustainable analytical techniques, are gaining traction in Japan.

Booming Pharmaceutical Industry in the United Kingdom Upscaling the Market

The demand for chromatography instrumentations is increasing in the United Kingdom, with a projected CAGR of 6.6% through 2034. Top factors supporting the market expansion in the country include:

  • The United Kingdom has strict regulations, particularly in the healthcare and pharmaceutical sectors. A chromatography instrumentation is made and used by these criteria, guaranteeing the precision and dependability of analytical findings.
  • Chromatography instrumentations are becoming increasingly common in environmental forensics, petrochemicals, and forensics fields in the United Kingdom.

Technological Innovations in South Korea Paving the Road for Market Success

The chromatography instrumentation market is projected to increase in South Korea at a CAGR of 7.6% through 2034. Key factors supporting the market growth are:

  • The demand for chromatography instrumentations in South Korea is increasing because of the growing emphasis on customized medicine and precision healthcare.
  • The need for complex chromatography instrumentations is driven by the adoption of advanced chromatography technologies like mass spectrometry (MS) and high-performance liquid chromatography (HPLC) in South Korea, a center for technological innovation.

Category-wise Insights

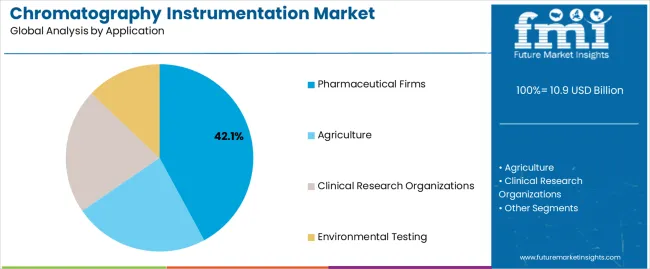
The section below shows the chromatography systems segment dominated by the device category. It is predicted to surge at a CAGR of 5.4% through 2034. Based on application, the agriculture segment is anticipated to generate a dominant share through 2024. It is set to rise at a CAGR of 5.3% through 2034.

Segment CAGR (2024 to 2034)
Chromatography Systems (Devices) 5.4%
Agriculture (Application) 5.3%

Chromatography System Segment Tops the Devices Category

Based on devices, the demand for chromatography systems is expected to remain high during the evaluation period.

  • In proteomics and metabolomics research, where the separation and examination of intricate biological materials are critical, liquid chromatography (LC) is an indispensable tool.
  • The adoption of liquid chromatography systems that provide automation, quick separations, and effective sample processing is a result of the need for high-throughput analysis. This is especially crucial for sectors where precise and timely analysis of a large number of samples is required.
  • Regulations pertaining to the food, pharmaceutical, and environmental sectors are strictly followed. Systems for liquid chromatography are ideal for fulfilling regulatory standards because of their capacity to produce precise and repeatable results.

Adoption of Chromatography Instrumentations in Agriculture Sector to Surge

Based on application, the agriculture segment is expected to surge at a CAGR of 5.3% through 2034.

  • Mycotoxins are poisonous fungus-made substances that infect crops such as grains and nuts.
  • Liquid chromatography coupled with tandem mass spectrometry, or LC-MS/MS, is frequently employed for mycotoxin analysis.
  • Chromatography instrumentation determines the amount and presence of additives like flavorings, colorants, and preservatives in food products. This guarantees that food products are safe to eat and meet all legal requirements.
  • Plant-derived essential oils are frequently analyzed using gas chromatography. This guarantees the quality and authenticity of the oils by enabling the identification and quantification of particular chemicals within them.

Competitive Landscape

Leading companies and manufacturers in the chromatography instrumentation market are concentrating on introducing cutting-edge liquid chromatography systems and parts. Key companies are concentrating on partnerships, mergers, and acquisitions in order to broaden their market reach. In order to improve their company’s position, they are also investing in a number of growth tactics.

For instance

  • In June 2020, Waters Corporation launched the Waters Arc High-performance Liquid Chromatography System.
  • In November 2020, PerkinElmer Inc. launched a new UHPLC, HPLC, and next-generation software solution (SimplicityChromTM software and LC 300TM platform).
  • In March 2020, Scion Instrumentations launched the LC6000 series HPLC to their array of chromatography products.
  • In 2021, Thermo Fisher Scientific launched its Vanquish Online 2D-Liquid Chromatography (LC) system, which bids versatility for multidimensional liquid chromatography.

Key Companies Profiled

  • Agilent Technologies
  • Waters Corporation
  • Shimadzu Corporation
  • Thermo Fisher Scientific
  • Perkinelmer, Inc.
  • Merck KGaA
  • Bio-Rad Laboratories
  • Restek Corporation
  • Gilson, Inc.
  • Phenomenex

Chromatography Instrumentation Market Segmentation by Category

By Devices:

  • Chromatography Systems
    • Gas Chromatography Systems
    • Liquid Chromatography Systems
    • Fluid Chromatography Systems
    • Thin Layer Chromatography Systems
  • Consumables
    • Columns
    • Solvents/Reagents/Adsorbents
    • Syringes/Needles
    • Others
  • Accessories
    • Column Accessories
    • Auto-sampler Accessories
    • Pumps
    • Other Accessories

By Application:

  • Agriculture
  • Pharmaceutical Firms
  • Clinical Research Organizations
  • Environmental Testing

By Region:

  • North America
  • Latin America
  • Europe
  • East Asia
  • South Asia
  • Oceania
  • Middle East and Africa

Frequently Asked Questions

How big is the chromatography instrumentation market?

The market is expected to reach US$ 10.3 billion in 2024.

What is the forecast for the chromatography instrumentation market?

Demand for chromatography instrumentations is slated to expand at a 5.6% CAGR by 2034.

What is the outlook for the chromatography instrumentation market?

The market is set to reach US$ 17.7 billion in 2034.

Who are the key players in the chromatography instrumentation market?

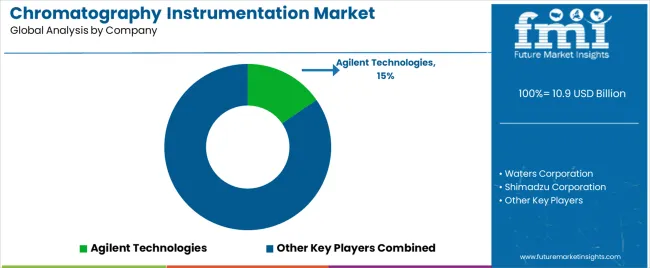
The key players are Agilent Technologies, Waters Corporation, and Shimadzu Corporation.

Which device would lead the chromatography instrumentation market?

The chromatography system is estimated to hold a significant market share in 2024.

Table of Content
1. Executive Summary

    1.1. Global Market Outlook

    1.2. Demand-side Trends

    1.3. Supply-side Trends

    1.4. Technology Roadmap Analysis

    1.5. Analysis and Recommendations

2. Market Overview

    2.1. Market Coverage / Taxonomy

    2.2. Market Definition / Scope / Limitations

3. Market Background

    3.1. Market Dynamics

        3.1.1. Drivers

        3.1.2. Restraints

        3.1.3. Opportunity

        3.1.4. Trends

    3.2. Scenario Forecast

        3.2.1. Demand in Optimistic Scenario

        3.2.2. Demand in Likely Scenario

        3.2.3. Demand in Conservative Scenario

    3.3. Opportunity Map Analysis

    3.4. Product Life Cycle Analysis

    3.5. Supply Chain Analysis

        3.5.1. Supply Side Participants and their Roles

            3.5.1.1. Producers

            3.5.1.2. Mid-Level Participants (Traders/ Agents/ Brokers)

            3.5.1.3. Wholesalers and Distributors

        3.5.2. Value Added and Value Created at Node in the Supply Chain

        3.5.3. List of Raw Material Suppliers

        3.5.4. List of Existing and Potential Buyer’s

    3.6. Investment Feasibility Matrix

    3.7. Value Chain Analysis

        3.7.1. Profit Margin Analysis

        3.7.2. Wholesalers and Distributors

        3.7.3. Retailers

    3.8. PESTLE and Porter’s Analysis

    3.9. Regulatory Landscape

        3.9.1. By Key Regions

        3.9.2. By Key Countries

    3.10. Regional Parent Market Outlook

    3.11. Production and Consumption Statistics

    3.12. Import and Export Statistics

4. Global Market Analysis 2019 to 2023 and Forecast, 2024 to 2034

    4.1. Historical Market Size Value (US$ billion) & Volume (Units) Analysis, 2019 to 2023

    4.2. Current and Future Market Size Value (US$ billion) & Volume (Units) Projections, 2024 to 2034

        4.2.1. Y-o-Y Growth Trend Analysis

        4.2.2. Absolute $ Opportunity Analysis

5. Global Market Analysis 2019 to 2023 and Forecast 2024 to 2034, By Devices

    5.1. Introduction / Key Findings

    5.2. Historical Market Size Value (US$ billion) & Volume (Units) Analysis By Devices, 2019 to 2023

    5.3. Current and Future Market Size Value (US$ billion) & Volume (Units) Analysis and Forecast By Devices, 2024 to 2034

        5.3.1. Chromatography Systems

            5.3.1.1. Gas Chromatography Systems

            5.3.1.2. Liquid Chromatography Systems

            5.3.1.3. Fluid Chromatography Systems

            5.3.1.4. Thin Layer Chromatography Systems

        5.3.2. Consumables

            5.3.2.1. Columns

            5.3.2.2. Solvents/Reagents/Adsorbents

            5.3.2.3. Syringes/Needles

            5.3.2.4. Others

        5.3.3. Accessories

            5.3.3.1. Column Accessories

            5.3.3.2. Auto-sampler Accessories

            5.3.3.3. Pumps

            5.3.3.4. Other Accessories

    5.4. Y-o-Y Growth Trend Analysis By Devices, 2019 to 2023

    5.5. Absolute $ Opportunity Analysis By Devices, 2024 to 2034

6. Global Market Analysis 2019 to 2023 and Forecast 2024 to 2034, By Application

    6.1. Introduction / Key Findings

    6.2. Historical Market Size Value (US$ billion) & Volume (Units) Analysis By Application, 2019 to 2023

    6.3. Current and Future Market Size Value (US$ billion) & Volume (Units) Analysis and Forecast By Application, 2024 to 2034

        6.3.1. Agriculture

        6.3.2. Pharmaceutical Firms

        6.3.3. Clinical Research Organizations

        6.3.4. Environmental Testing

    6.4. Y-o-Y Growth Trend Analysis By Application, 2019 to 2023

    6.5. Absolute $ Opportunity Analysis By Application, 2024 to 2034

7. Global Market Analysis 2019 to 2023 and Forecast 2024 to 2034, By Region

    7.1. Introduction

    7.2. Historical Market Size Value (US$ billion) & Volume (Units) Analysis By Region, 2019 to 2023

    7.3. Current Market Size Value (US$ billion) & Volume (Units) Analysis and Forecast By Region, 2024 to 2034

        7.3.1. North America

        7.3.2. Latin America

        7.3.3. Western Europe

        7.3.4. Eastern Europe

        7.3.5. South Asia and Pacific

        7.3.6. East Asia

        7.3.7. Middle East and Africa

    7.4. Market Attractiveness Analysis By Region

8. North America Market Analysis 2019 to 2023 and Forecast 2024 to 2034, By Country

    8.1. Historical Market Size Value (US$ billion) & Volume (Units) Trend Analysis By Market Taxonomy, 2019 to 2023

    8.2. Market Size Value (US$ billion) & Volume (Units) Forecast By Market Taxonomy, 2024 to 2034

        8.2.1. By Country

            8.2.1.1. United States

            8.2.1.2. Canada

        8.2.2. By Devices

        8.2.3. By Application

    8.3. Market Attractiveness Analysis

        8.3.1. By Country

        8.3.2. By Devices

        8.3.3. By Application

    8.4. Key Takeaways

9. Latin America Market Analysis 2019 to 2023 and Forecast 2024 to 2034, By Country

    9.1. Historical Market Size Value (US$ billion) & Volume (Units) Trend Analysis By Market Taxonomy, 2019 to 2023

    9.2. Market Size Value (US$ billion) & Volume (Units) Forecast By Market Taxonomy, 2024 to 2034

        9.2.1. By Country

            9.2.1.1. Brazil

            9.2.1.2. Mexico

            9.2.1.3. Rest of Latin America

        9.2.2. By Devices

        9.2.3. By Application

    9.3. Market Attractiveness Analysis

        9.3.1. By Country

        9.3.2. By Devices

        9.3.3. By Application

    9.4. Key Takeaways

10. Western Europe Market Analysis 2019 to 2023 and Forecast 2024 to 2034, By Country

    10.1. Historical Market Size Value (US$ billion) & Volume (Units) Trend Analysis By Market Taxonomy, 2019 to 2023

    10.2. Market Size Value (US$ billion) & Volume (Units) Forecast By Market Taxonomy, 2024 to 2034

        10.2.1. By Country

            10.2.1.1. Germany

            10.2.1.2. United Kingdom

            10.2.1.3. France

            10.2.1.4. Spain

            10.2.1.5. Italy

            10.2.1.6. Rest of Western Europe

        10.2.2. By Devices

        10.2.3. By Application

    10.3. Market Attractiveness Analysis

        10.3.1. By Country

        10.3.2. By Devices

        10.3.3. By Application

    10.4. Key Takeaways

11. Eastern Europe Market Analysis 2019 to 2023 and Forecast 2024 to 2034, By Country

    11.1. Historical Market Size Value (US$ billion) & Volume (Units) Trend Analysis By Market Taxonomy, 2019 to 2023

    11.2. Market Size Value (US$ billion) & Volume (Units) Forecast By Market Taxonomy, 2024 to 2034

        11.2.1. By Country

            11.2.1.1. Poland

            11.2.1.2. Russia

            11.2.1.3. Czech Republic

            11.2.1.4. Romania

            11.2.1.5. Rest of Eastern Europe

        11.2.2. By Devices

        11.2.3. By Application

    11.3. Market Attractiveness Analysis

        11.3.1. By Country

        11.3.2. By Devices

        11.3.3. By Application

    11.4. Key Takeaways

12. South Asia and Pacific Market Analysis 2019 to 2023 and Forecast 2024 to 2034, By Country

    12.1. Historical Market Size Value (US$ billion) & Volume (Units) Trend Analysis By Market Taxonomy, 2019 to 2023

    12.2. Market Size Value (US$ billion) & Volume (Units) Forecast By Market Taxonomy, 2024 to 2034

        12.2.1. By Country

            12.2.1.1. India

            12.2.1.2. Bangladesh

            12.2.1.3. Australia

            12.2.1.4. New Zealand

            12.2.1.5. Rest of South Asia and Pacific

        12.2.2. By Devices

        12.2.3. By Application

    12.3. Market Attractiveness Analysis

        12.3.1. By Country

        12.3.2. By Devices

        12.3.3. By Application

    12.4. Key Takeaways

13. East Asia Market Analysis 2019 to 2023 and Forecast 2024 to 2034, By Country

    13.1. Historical Market Size Value (US$ billion) & Volume (Units) Trend Analysis By Market Taxonomy, 2019 to 2023

    13.2. Market Size Value (US$ billion) & Volume (Units) Forecast By Market Taxonomy, 2024 to 2034

        13.2.1. By Country

            13.2.1.1. China

            13.2.1.2. Japan

            13.2.1.3. South Korea

        13.2.2. By Devices

        13.2.3. By Application

    13.3. Market Attractiveness Analysis

        13.3.1. By Country

        13.3.2. By Devices

        13.3.3. By Application

    13.4. Key Takeaways

14. Middle East and Africa Market Analysis 2019 to 2023 and Forecast 2024 to 2034, By Country

    14.1. Historical Market Size Value (US$ billion) & Volume (Units) Trend Analysis By Market Taxonomy, 2019 to 2023

    14.2. Market Size Value (US$ billion) & Volume (Units) Forecast By Market Taxonomy, 2024 to 2034

        14.2.1. By Country

            14.2.1.1. GCC Countries

            14.2.1.2. South Africa

            14.2.1.3. Israel

            14.2.1.4. Rest of Middle East and Africa

        14.2.2. By Devices

        14.2.3. By Application

    14.3. Market Attractiveness Analysis

        14.3.1. By Country

        14.3.2. By Devices

        14.3.3. By Application

    14.4. Key Takeaways

15. Key Countries Market Analysis

    15.1. United States

        15.1.1. Pricing Analysis

        15.1.2. Market Share Analysis, 2023

            15.1.2.1. By Devices

            15.1.2.2. By Application

    15.2. Canada

        15.2.1. Pricing Analysis

        15.2.2. Market Share Analysis, 2023

            15.2.2.1. By Devices

            15.2.2.2. By Application

    15.3. Brazil

        15.3.1. Pricing Analysis

        15.3.2. Market Share Analysis, 2023

            15.3.2.1. By Devices

            15.3.2.2. By Application

    15.4. Mexico

        15.4.1. Pricing Analysis

        15.4.2. Market Share Analysis, 2023

            15.4.2.1. By Devices

            15.4.2.2. By Application

    15.5. Germany

        15.5.1. Pricing Analysis

        15.5.2. Market Share Analysis, 2023

            15.5.2.1. By Devices

            15.5.2.2. By Application

    15.6. United Kingdom

        15.6.1. Pricing Analysis

        15.6.2. Market Share Analysis, 2023

            15.6.2.1. By Devices

            15.6.2.2. By Application

    15.7. France

        15.7.1. Pricing Analysis

        15.7.2. Market Share Analysis, 2023

            15.7.2.1. By Devices

            15.7.2.2. By Application

    15.8. Spain

        15.8.1. Pricing Analysis

        15.8.2. Market Share Analysis, 2023

            15.8.2.1. By Devices

            15.8.2.2. By Application

    15.9. Italy

        15.9.1. Pricing Analysis

        15.9.2. Market Share Analysis, 2023

            15.9.2.1. By Devices

            15.9.2.2. By Application

    15.10. Poland

        15.10.1. Pricing Analysis

        15.10.2. Market Share Analysis, 2023

            15.10.2.1. By Devices

            15.10.2.2. By Application

    15.11. Russia

        15.11.1. Pricing Analysis

        15.11.2. Market Share Analysis, 2023

            15.11.2.1. By Devices

            15.11.2.2. By Application

    15.12. Czech Republic

        15.12.1. Pricing Analysis

        15.12.2. Market Share Analysis, 2023

            15.12.2.1. By Devices

            15.12.2.2. By Application

    15.13. Romania

        15.13.1. Pricing Analysis

        15.13.2. Market Share Analysis, 2023

            15.13.2.1. By Devices

            15.13.2.2. By Application

    15.14. India

        15.14.1. Pricing Analysis

        15.14.2. Market Share Analysis, 2023

            15.14.2.1. By Devices

            15.14.2.2. By Application

    15.15. Bangladesh

        15.15.1. Pricing Analysis

        15.15.2. Market Share Analysis, 2023

            15.15.2.1. By Devices

            15.15.2.2. By Application

    15.16. Australia

        15.16.1. Pricing Analysis

        15.16.2. Market Share Analysis, 2023

            15.16.2.1. By Devices

            15.16.2.2. By Application

    15.17. New Zealand

        15.17.1. Pricing Analysis

        15.17.2. Market Share Analysis, 2023

            15.17.2.1. By Devices

            15.17.2.2. By Application

    15.18. China

        15.18.1. Pricing Analysis

        15.18.2. Market Share Analysis, 2023

            15.18.2.1. By Devices

            15.18.2.2. By Application

    15.19. Japan

        15.19.1. Pricing Analysis

        15.19.2. Market Share Analysis, 2023

            15.19.2.1. By Devices

            15.19.2.2. By Application

    15.20. South Korea

        15.20.1. Pricing Analysis

        15.20.2. Market Share Analysis, 2023

            15.20.2.1. By Devices

            15.20.2.2. By Application

    15.21. GCC Countries

        15.21.1. Pricing Analysis

        15.21.2. Market Share Analysis, 2023

            15.21.2.1. By Devices

            15.21.2.2. By Application

    15.22. South Africa

        15.22.1. Pricing Analysis

        15.22.2. Market Share Analysis, 2023

            15.22.2.1. By Devices

            15.22.2.2. By Application

    15.23. Israel

        15.23.1. Pricing Analysis

        15.23.2. Market Share Analysis, 2023

            15.23.2.1. By Devices

            15.23.2.2. By Application

16. Market Structure Analysis

    16.1. Competition Dashboard

    16.2. Competition Benchmarking

    16.3. Market Share Analysis of Top Players

        16.3.1. By Regional

        16.3.2. By Devices

        16.3.3. By Application

17. Competition Analysis

    17.1. Competition Deep Dive

        17.1.1. Agilent Technologies

            17.1.1.1. Overview

            17.1.1.2. Product Portfolio

            17.1.1.3. Profitability by Market Segments

            17.1.1.4. Sales Footprint

            17.1.1.5. Strategy Overview

                17.1.1.5.1. Marketing Strategy

                17.1.1.5.2. Product Strategy

                17.1.1.5.3. Channel Strategy

        17.1.2. Waters Corporation

            17.1.2.1. Overview

            17.1.2.2. Product Portfolio

            17.1.2.3. Profitability by Market Segments

            17.1.2.4. Sales Footprint

            17.1.2.5. Strategy Overview

                17.1.2.5.1. Marketing Strategy

                17.1.2.5.2. Product Strategy

                17.1.2.5.3. Channel Strategy

        17.1.3. Shimadzu Corporation

            17.1.3.1. Overview

            17.1.3.2. Product Portfolio

            17.1.3.3. Profitability by Market Segments

            17.1.3.4. Sales Footprint

            17.1.3.5. Strategy Overview

                17.1.3.5.1. Marketing Strategy

                17.1.3.5.2. Product Strategy

                17.1.3.5.3. Channel Strategy

        17.1.4. Thermo Fisher Scientific

            17.1.4.1. Overview

            17.1.4.2. Product Portfolio

            17.1.4.3. Profitability by Market Segments

            17.1.4.4. Sales Footprint

            17.1.4.5. Strategy Overview

                17.1.4.5.1. Marketing Strategy

                17.1.4.5.2. Product Strategy

                17.1.4.5.3. Channel Strategy

        17.1.5. Perkinelmer, Inc.

            17.1.5.1. Overview

            17.1.5.2. Product Portfolio

            17.1.5.3. Profitability by Market Segments

            17.1.5.4. Sales Footprint

            17.1.5.5. Strategy Overview

                17.1.5.5.1. Marketing Strategy

                17.1.5.5.2. Product Strategy

                17.1.5.5.3. Channel Strategy

        17.1.6. Merck KGaA

            17.1.6.1. Overview

            17.1.6.2. Product Portfolio

            17.1.6.3. Profitability by Market Segments

            17.1.6.4. Sales Footprint

            17.1.6.5. Strategy Overview

                17.1.6.5.1. Marketing Strategy

                17.1.6.5.2. Product Strategy

                17.1.6.5.3. Channel Strategy

        17.1.7. Sartorius AG

            17.1.7.1. Overview

            17.1.7.2. Product Portfolio

            17.1.7.3. Profitability by Market Segments

            17.1.7.4. Sales Footprint

            17.1.7.5. Strategy Overview

                17.1.7.5.1. Marketing Strategy

                17.1.7.5.2. Product Strategy

                17.1.7.5.3. Channel Strategy

        17.1.8. Bio-Rad Laboratories

            17.1.8.1. Overview

            17.1.8.2. Product Portfolio

            17.1.8.3. Profitability by Market Segments

            17.1.8.4. Sales Footprint

            17.1.8.5. Strategy Overview

                17.1.8.5.1. Marketing Strategy

                17.1.8.5.2. Product Strategy

                17.1.8.5.3. Channel Strategy

        17.1.9. Restek Corporation

            17.1.9.1. Overview

            17.1.9.2. Product Portfolio

            17.1.9.3. Profitability by Market Segments

            17.1.9.4. Sales Footprint

            17.1.9.5. Strategy Overview

                17.1.9.5.1. Marketing Strategy

                17.1.9.5.2. Product Strategy

                17.1.9.5.3. Channel Strategy

        17.1.10. Gilson, Inc.

            17.1.10.1. Overview

            17.1.10.2. Product Portfolio

            17.1.10.3. Profitability by Market Segments

            17.1.10.4. Sales Footprint

            17.1.10.5. Strategy Overview

                17.1.10.5.1. Marketing Strategy

                17.1.10.5.2. Product Strategy

                17.1.10.5.3. Channel Strategy

        17.1.11. Phenomenex

            17.1.11.1. Overview

            17.1.11.2. Product Portfolio

            17.1.11.3. Profitability by Market Segments

            17.1.11.4. Sales Footprint

            17.1.11.5. Strategy Overview

                17.1.11.5.1. Marketing Strategy

                17.1.11.5.2. Product Strategy

                17.1.11.5.3. Channel Strategy

18. Assumptions & Acronyms Used

19. Research Methodology
Recommendations

Healthcare

Podiatry Service Market

January 2023

REP-GB-16492

January 2024

545 pages

Healthcare

Small Molecule CMO/CDMO Market

November 2023

REP-GB-18438

January 2024

281 pages

Healthcare

Fructosamine Test Market

July 2018

REP-GB-7030

January 2024

316 pages

Healthcare

Aortic Endograft Market

December 2023

REP-GB-18736

392 pages

Explore Healthcare Insights

View Reports
Future Market Insights

Chromatography Instrumentation Market