Reports

- Global Locations -

Headquarters

Future Market Insights, Inc.

Christiana Corporate, 200
Continental Drive, Suite 401,
Newark, Delaware - 19713,
United States

T: +1-845-579-5705

Americas

Future Market Insights, Inc.

616 Corporate Way, Suite 2-9018,
Valley Cottage, NY 10989, United States

T: +1-347-918-3531

MEA

Future Market Insights

1602-6 Jumeirah Bay X2 Tower, Plot No: JLT-PH2-X2A,
Jumeirah Lakes Towers, Dubai,
United Arab Emirates

Europe

Future Market Insights

3rd Floor, 207 Regent Street,
W1B 3HH London
United Kingdom

T: + 44 (0) 20 8123 9659
D: +44 (0) 20 3287 4268

Asia Pacific

Future Market Insights

IndiaLand Global Tech Park, Unit UG-1, Behind Grand HighStreet, Phase 1, Hinjawadi, MH, Pune – 411057, India

Preparative Chromatography Market Outlook from 2024 to 2034

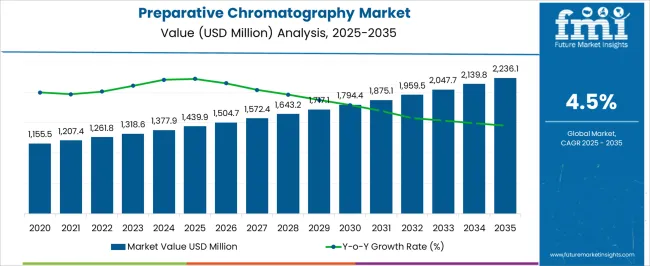
The global preparative chromatography market was valued at US$ 1,311.8 million in 2023 and is expected to reach US$ 2,139.4 million by 2034. The market is expected to rise at a CAGR of 4.5% over the forecast period. It is projected to attain a valuation of US$ 1,377.9 million by 2024.

Attributes Key Insights
Base Value, 2023 US$ 1,311.8 million
Estimated Global Preparative Chromatography Market Size (2024E) US$ 1,377.9 million
Projected Preparative Chromatography Market Value (2034F) US$ 2,139.4 million
Value-based CAGR (2024 to 2034) 4.5%

Growing research efforts in the biotechnology and pharmaceutical industries are propelling the global market for preparative chromatography. The market is further expanding due to the increasing demand for preparative techniques and the widespread use of liquid chromatographic methods, which are effective in downstream processing.

The need for more rapid medication research and production drives the demand for high-throughput purification methods, augmenting growth. Preparative chromatography solutions are increasingly used to purify biomolecules as the biopharmaceutical sector expands and more drug components are developed.

The globalization of the pharmaceutical and biotechnology sectors is reflected in the growing acceptance of preparative chromatography solutions. Leading companies are providing end customers with more effective and adaptable purification alternatives by customizing preparative chromatography solutions for certain applications and industries.

Partnerships between research organizations, academic institutions, and industries are fostering innovation in preparative chromatography. The goal of partnerships is to create new techniques and technologies for purifying procedures that are more effective.

Don't pay for what you don't need

Customize your report by selecting specific countries or regions and save 30%!

2019 to 2023 Preparative Chromatography Market Sales Outlook Vs. 2024 to 2034

The preparative chromatography market grew at a CAGR of 4.3% from 2019 to 2023. Several chromatography methods have been created and improved over time, including flash chromatography, simulated moving bed (SMB) chromatography, and high-performance liquid chromatography (HPLC). These advancements have helped to increase scalability and efficiency.

The pharmaceutical industry saw a dramatic change in the late 2020s toward biopharmaceuticals, such as recombinant proteins and monoclonal antibodies. Preparative chromatography is a critical stage in purifying these complex compounds, and this transition fueled its demand.

Improvements in instrumentation, stationary phase materials, and column technology have all been crucial in raising the efficiency and potential of preparative chromatography systems. Regulation of the purification procedures came under more attention as the biotechnology and pharmaceutical sectors grew. The implementation of proven preparative chromatographic procedures has been prompted by stringent product quality and safety laws.

High-throughput preparative chromatography systems were adopted because of the necessity for rapid medication discovery and production. Preparative chromatography has seen a shift in the use of single-use devices in recent years. These systems benefit from flexibility, a lower chance of cross-contamination, and cheaper operating expenses.

Preparative Chromatography Trends

  • Preparative chromatography is increasingly efficient and has high resolution due to ongoing developments in equipment, packing materials, and chromatography column design.
  • Biopharmaceutical companies continue to be the key source of demand for preparative chromatography, particularly for purifying therapeutic proteins, monoclonal antibodies, and other biologics.
  • Single-use preparative chromatography systems are gaining traction because of their flexibility, low risk of cross-contamination, and affordability in cleaning & validation procedures.
  • The goal of ongoing research is to create new stationary phase materials with high selectivity, efficiency, and stability, thereby improving preparative chromatography's overall performance.
  • The preparative chromatography industry is increasingly focusing on establishing environmentally friendly processes. This covers trash generation reduction, recycling techniques, and the investigation of substitute solvents.
Sabyasachi Ghosh
Sabyasachi Ghosh

Principal Consultant

Talk to Analyst

Find your sweet spots for generating winning opportunities in this market.

Key Opportunities Paving Global Preparative Chromatography Market Growth

The growing focus on customized and precision medicine is driving the need for preparative chromatography. Targeted therapies are advancing, and this method's capacity to handle complicated biological materials like proteins and antibodies matches well with the recent development.

The influx of funds into research & development strengthens the crucial role of preparative chromatography in promoting drug development, ultimately determining the future of pharmaceutical research and patient care. Hence, growing investments in global healthcare infrastructure and research & development activities are creating new opportunities for the growth of the preparative chromatography market.

Overview of Restrictive Factors for Preparative Chromatography Market

  • Preparative chromatography setup and equipment are costly. High initial capital expenditure is a deterrent, particularly for research institutes with tight resources or small and medium-sized enterprises (SMEs).
  • The process of preparative chromatography is laborious, and the length of time required for separation and purification may not be suitable for applications with a need for rapid turnaround.

Get the data you need at a Fraction of the cost

Personalize your report by choosing insights you need
and save 40%!

Comparative View of Adjacent Preparative Chromatography Markets

The global preparative chromatography market is set to be impacted by the peer or tangential markets in the healthcare division. These include other markets, such as podiatry service and orthopedic prosthetic industries.

Analysis of these related industries can provide deeper insights that help develop unique differentiating strategies to pursue growth and opportunity in the preparative and process chromatography market.

Demand for podiatry services is projected to expand at a 3.6% CAGR during the forecast period. Podiatrists are vital in the treatment of foot issues related to chronic diseases such as diabetes, which are on the rise.

On the contrary, the orthopedic prosthetic industry is poised to thrive at a higher CAGR of 5% through 2034. Orthopedic prosthetic manufacturers are focusing on improving the prosthetics' comfort and appearance. Improved weight distribution, realistic designs, and lightweight materials add to a better overall user experience.

Preparative Chromatography Market:

Attributes Preparative Chromatography Market
CAGR (2024 to 2034) 4.5%
Growth Factor Single-use methods are gaining traction in preparative chromatography because of their affordability, flexibility, and low danger of contamination. Manufacturers who provide creative single-use solutions stand a chance to satisfy the market's increasing need.
Key Trend in Preparative Chromatography Market The potential of continuous chromatographic processes to lower production costs and increase efficiency is drawing more attention.

Podiatry Service Market:

Attributes Podiatry Service Market
CAGR (2024 to 2034) 3.6%
Growth Factor Implementing individualized treatment regimens as per patient preferences, lifestyle, and heredity by podiatrists is gaining momentum in the market.
Key Trends Preventive care is gaining importance in the healthcare system. In order to treat problems before they worsen, podiatrists place a greater emphasis on teaching patients about foot health, preventative measures, and early intervention.

Orthopedic Prosthetic Market:

Attributes Orthopedic Prosthetic Market
CAGR (2024 to 2034) 5%
Growth Factor Remote monitoring of usage patterns, gait analysis, and other pertinent data is made possible by prosthetic systems' integration of sensors and networking elements. This pattern is in favor of continuous patient care, device modifications, and performance enhancement.
Key Trends Orthopedic prostheses that are more advanced and useful are the result of ongoing developments in materials, sensors, and manufacturing processes. Advanced materials, robotics, and myoelectric control are a few examples of innovations that enhance user experience and performance.

Country-wise Insights

The table below shows the estimated growth rates of the top five countries. China, India, and the United Kingdom are set to record high CAGRs of 8.6%, 8.8%, and 2.8%, respectively, through 2034.

Country Value CAGR
United States 2.3%
India 8.8%
United Kingdom 2.8%
China 8.6%
Italy 4.9%

Growing Government Regulations in the United States to Surge Demand

The United States is expected to surge at a CAGR of 2.3% through 2034. The factors driving the United States market growth are as follows:

  • The biopharmaceutical sector in the United States is thriving. The expansion of this industry is significantly fueling the market for preparative chromatography.
  • Preparative chromatography is often used in ongoing research endeavors and in the creation of novel medications and treatments for purification.
  • The need for reliable and proven preparative chromatography systems is fueled by strict regulations governing the biotech and pharmaceutical sectors in the United States.
  • Preparative chromatography techniques are developed and advanced in the United States by academic and research institutions. Industry and educational partnerships frequently spur innovation in the subject.

Growth Avenue for Key Players of Preparative Chromatography in India

Key players are investing significantly in India, as the country offers greater growth opportunities than its counterparts. Through 2034, India is projected to expand at a CAGR of 8.8%, driven by the following factors:

  • Growing awareness among the population, rising healthcare spending, and increasing prevalence of chronic disorders are expected to drive the market’s growth.
  • Preparative chromatography is set to be used for extracting and purifying bioactive substances from natural sources due to India's unique ecosystem, rich biodiversity, and longstanding traditions of using natural compounds.

Emerging Opportunities in China Attracting New Market Players

China’s preparative chromatography market is assessed to register a CAGR of 8.6% through 2034. The deployment of preparative chromatography is increasing on account of the following:

  • The market is expanding due to improvements in stationary phase materials, automation, and column design in preparative chromatography technologies.
  • The need for preparative chromatography to purify big macromolecules is increasing due to a move toward biologics and customized therapy. This trend is set to continue when more biologics move into clinical trials and commercial manufacturing.
  • China is home to several significant players in the preparative chromatography industry. Through product creation, strategic collaborations, and market expansion, these companies significantly impact market dynamics.

Category-wise Insights

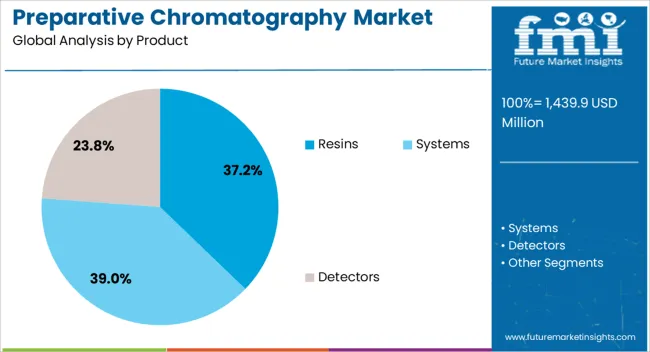
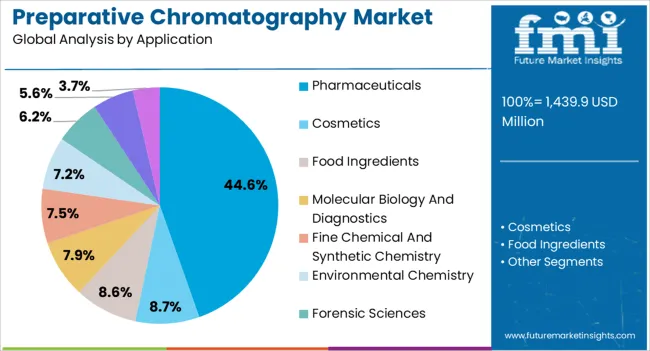
The below section shows the detector segment dominated by product type. It is expected to surge at a CAGR of 8.1% from 2024 to 2034. Based on application, the pharmaceutical segment is anticipated to hold a dominant share through 2024. It is set to expand at a CAGR of 2.6% by 2034.

Detectors to Have a Dominant Position in the Market Through 2034

Product Detectors
Value CAGR 8.1%

Based on the product, the detector segment is expected to surge at a CAGR of 8.1% by 2034. Detectors aid in identifying and measuring the separated components according to their distinct properties, such as fluorescence, UV absorbance, and changes in refractive index. This information is essential to evaluate the purity of the components that are gathered.

Detectors also enable operators to make quick modifications to maximize separation conditions by providing real-time monitoring of the elution process. This ability improves the purification process's efficiency in several applications.

Pharmaceuticals to Hold a Pivotal Position in the Market

Application Pharmaceuticals
Value CAGR 2.6%

Preparative high-performance liquid chromatography (HPLC) is important in reaching the essential purity levels for research, clinical trials, and production, making it a vital technology for pharmaceutical applications. Monoclonal antibodies, peptides, and proteins are frequently purified using preparative chromatography. It guarantees the synthesis of superior, physiologically active therapeutic proteins and aids in the removal of contaminants.

Natural products often contain pharmacological ingredients, typically derived from plants, microbes, or marine organisms. These complicated combinations are subjected to preparative chromatography to separate and isolate bioactive components.
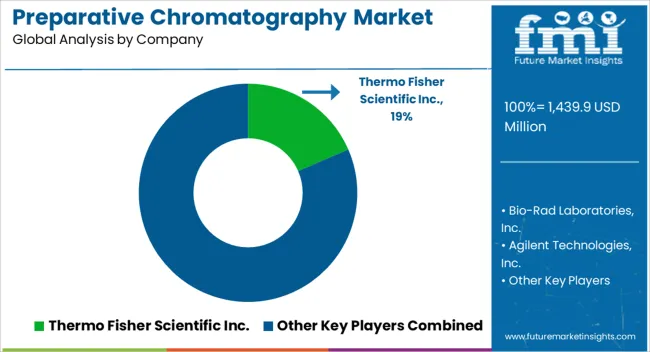
Competitive Landscape

Leading companies are strategically making collaborations and expanding their geographical reach to strengthen their positions. Through acquisitions and collaborations, they are expected to elevate their skills, penetrate new markets, and diversify their portfolios.

Key market players are entering new areas to reach a larger consumer base and take advantage of new opportunities by expanding geographically. By developing revenue sources, these players become stronger, specific to their position and competitiveness in the market, using their strategic growth approaches.

For instance:

  • In June 2022, Bio-Rad Laboratories, Inc. launched CHT™ prepacked Foresight Pro Columns, specifically designed to help downstream chromatography applications.
  • In 2021, CEM launched the Prodigy preparative high-performance liquid chromatography (HPLC) system.
  • In May 2022, the JASCO opened a new laboratory in collaboration with the Interdisciplinary Research Academy of Zhejiang Shuren University.

Key Companies Profiled

  • Thermo Fisher Scientific Inc.
  • Bio-Rad Laboratories, Inc.
  • Agilent Technologies, Inc.
  • Waters Corporation
  • Cytiva (Danaher)
  • Satorius AG
  • Shimazdu Corporation
  • PerkinElmer Inc.
  • Hitachi High-Tech Corporation
  • KNAUER Wissenschaftliche Geräte GmbH
  • Gilson Incorporated
  • JASCO Global
  • Jiangsu Hanbon Science&Technology Co., Ltd.
  • LPP Equipment AG
  • Teledyne ISCO
  • YMC CO., LTD.
  • ECOM spol. s r.o.
  • Sheng-Hanp.
  • Sykam GmbH
  • Postnova Analytics GmbH

Preparative Chromatography Market Segmentation by Category

By Product:

  • Systems
    • Semi-preparative HPLC Systems
    • Preparative HPLC Systems
  • Resins
    • Affinity Chromatography (AC)
    • Ion exchange Chromatography (IEX)
    • Size-exclusion Resins
    • Hydrophobic Interaction Resins
    • Mixed-mode/Multi-mode Resins
    • Other Resins
  • Detectors
    • UV/Vis Detectors
    • Diode-array Detectors
    • Refractive Index Detectors
    • Fluorescence Detectors
    • Mass Spectrometry Detectors
    • Evaporating Light Scattering Detectors
    • Electrochemical Detectors
  • Consumables
  • Columns
    • Prepacked Columns
    • Empty Columns

By Application:

  • Pharmaceuticals
    • Small Molecule
    • Peptides
    • Oligonucleotides
    • Monoclonal Antibodies
    • Others
  • Cosmetics
  • Food Ingredients
  • Molecular Biology and Diagnostics
  • Fine Chemical and Synthetic Chemistry
  • Environmental Chemistry
  • Forensic Sciences
  • Drugs of Abuse and Sports Drug Testing
  • Research Use
  • Other Application

By End User:

  • Pharmaceutical Companies
  • Biotechnology Companies
  • Contract Research Organizations
  • Cosmetic Manufacturers
  • Food and Beverage Industry
  • Chemical Industry
  • Diagnostic Laboratories
  • Reference Laboratories
  • National Anti-doping Organizations
  • Law-enforcement Agencies
  • Academic and Research Institutes

By Region:

  • North America
  • Latin America
  • East Asia
  • South Asia and Pacific
  • Western Europe
  • Eastern Europe
  • Middle East and Africa

Frequently Asked Questions

How big is the preparative chromatography market?

The market is set to reach US$ 1,377.9 million in 2024.

What is the forecast for the preparative chromatography market?

Demand for preparative chromatography is slated to expand at a 4.5% CAGR by 2034.

What is the outlook for the preparative chromatography market?

The market is expected to reach US$ 2,139.4 million in 2034.

Who are the key players in the preparative chromatography market?

Thermo Fisher Scientific Inc., Bio-Rad Laboratories, Inc., and Agilent Technologies, Inc.

Which product type would lead the preparative chromatography market?

The detector segment is estimated to surge at an 8.1% CAGR by 2034.

Table of Content

1. Executive Summary

    1.1. Global Market Outlook

    1.2. Demand Side Trends

    1.3. Supply-Side Trends

    1.4. Analysis and Recommendations

2. Market Overview

    2.1. Market Coverage / Taxonomy

    2.2. Market Definition / Scope / Limitations

    2.3. Inclusions and Exclusions

3. Key Market Trends

    3.1. Key Trends Impacting the Market

    3.2. Product Development/Innovation Trends

4. Value Added Insights

    4.1. Product Adoption/ Usage Analysis

    4.2. Product Specification Analysis

    4.3. Installed Base Scenario

    4.4. Regulatory Landscape

        4.4.1. United States Regulatory Scenario

        4.4.2. Europe Regulatory Scenario

        4.4.3. India Regulatory Scenario

        4.4.4. Australia Regulatory Scenario

    4.5. Porters Analysis

    4.6. PESTLE Analysis by Region

    4.7. Used case scenario of detectors by Preparative Chromatographic Systems

    4.8. Value Chain Assessment

5. Market Background

    5.1. Macro-economic Factors

        5.1.1. Global Healthcare Expenditure Outlook

        5.1.2. Global Research and Development Funding by Region

        5.1.3. Global Research and Development Funding by Country

        5.1.4. Parent Market Analysis (Preparative and Process Chromatography)

    5.2. Forecast Factors - Relevance and Impact

        5.2.1. Expanding Biopharmaceutical Sector and Personalized Medicine

        5.2.2. Ongoing Innovations in Chromatography Technologies

        5.2.3. Regulatory Landscape

        5.2.4. Increasing Demand for Biopharmaceuticals

        5.2.5. Market Consolidation Activities

        5.2.6. Investment and Funding

        5.2.7. Growing Awareness of Environmental Impact

        5.2.8. Demand for Large-scale Production

    5.3. Market Dynamics

        5.3.1. Drivers

        5.3.2. Restraints

        5.3.3. Opportunity Analysis

6. Global Market - Pricing Analysis

    6.1. Regional Level Pricing Analysis, By Product

    6.2. Pricing Assumptions

7. Global Market Demand (in Value or Size in US$ million) and Volume (Units) Analysis 2019 to 2023 and Forecast, 2024 to 2034

    7.1. Historical Market Value (US$ million) and Volume (Units) Analysis, 2019 to 2023

    7.2. Current and Future Market Value (US$ million) and Volume (Units) Projections, 2024 to 2034

        7.2.1. Y-o-Y Growth Trend Analysis

        7.2.2. Absolute $ Opportunity Analysis

    7.3. Revenue Opportunity Scenario- Likely/Conservative/Optimistic

8. Global Market Analysis 2019 to 2023 and Forecast 2024 to 2034, By Product

    8.1. Introduction / Key Findings

    8.2. Historical Market Size (US$ million) and Volume Analysis by Product, 2019 to 2023

    8.3. Current and Future Market Size (US$ million) and Volume Analysis and Forecast by Product, 2024 to 2034

        8.3.1. Systems

            8.3.1.1. Semi-preparative HPLC Systems

            8.3.1.2. Preparative HPLC Systems

        8.3.2. Resins

            8.3.2.1. Affinity Chromatography (AC)

            8.3.2.2. Ion exchange Chromatography (IEX)

            8.3.2.3. Size-exclusion Resins

            8.3.2.4. Hydrophobic Interaction Resins

            8.3.2.5. Mixed-mode/Multi-mode Resins

            8.3.2.6. Other Resins

        8.3.3. Detectors

            8.3.3.1. UV/Vis Detectors

            8.3.3.2. Diode-array Detectors

            8.3.3.3. Refractive Index Detectors

            8.3.3.4. Fluorescence Detectors

            8.3.3.5. Mass Spectrometry Detectors

            8.3.3.6. Evaporating Light Scattering Detectors

            8.3.3.7. Electrochemical Detectors

        8.3.4. Consumables

        8.3.5. Columns

            8.3.5.1. Prepacked Columns

            8.3.5.2. Empty Columns

    8.4. Market Attractiveness Analysis by Product

9. Global Market Analysis 2019 to 2023 and Forecast 2024 to 2034, By Application

    9.1. Introduction / Key Findings

    9.2. Historical Market Size (US$ million) By Application, 2019 to 2023

    9.3. Current and Future Market Size (US$ million) and Volume Analysis and Forecast by Application, 2024 to 2034

        9.3.1. Pharmaceuticals

            9.3.1.1. Small Molecule

            9.3.1.2. Peptides

            9.3.1.3. Oligonucleotides

            9.3.1.4. Monoclonal Antibodies

            9.3.1.5. Others

        9.3.2. Cosmetics

        9.3.3. Food Ingredients

        9.3.4. Molecular Biology and Diagnostics

        9.3.5. Fine Chemical and Synthetic Chemistry

        9.3.6. Environmental Chemistry

        9.3.7. Forensic Sciences

        9.3.8. Drugs of Abuse and Sports Drug Testing

        9.3.9. Research Use

    9.4. Market Attractiveness Analysis by Application

10. Global Market Analysis 2019 to 2023 and Forecast 2024 to 2034, By End-user

    10.1. Introduction / Key Findings

    10.2. Historical Market Size (US$ million) By End-user, 2019 to 2023

    10.3. Current and Future Market Size (US$ million) and Volume Analysis and Forecast by End-user, 2024 to 2034

        10.3.1. Pharmaceutical Companies

        10.3.2. Biotechnology Companies

        10.3.3. Contract Research Organizations

        10.3.4. Cosmetic Manufacturers

        10.3.5. Food and Beverage Industry

        10.3.6. Chemical Industry

        10.3.7. Diagnostic Laboratories

        10.3.8. Reference Laboratories

        10.3.9. National Anti-doping Organizations

        10.3.10. Law-enforcement Agencies

        10.3.11. Academic and Research Institutes

    10.4. Market Attractiveness Analysis by End-user

11. Global Market Analysis 2019 to 2023 and Forecast 2024 to 2034, By Region

    11.1. Introduction / Key Findings

    11.2. Historical Market Size (US$ million) and Volume Analysis by Region, 2019 to 2023

    11.3. Current and Future Market Size (US$ million) and Volume Analysis and Forecast by Region, 2024 to 2034

        11.3.1. North America

        11.3.2. Latin America

        11.3.3. East Asia

        11.3.4. South Asia and Pacific

        11.3.5. Western Europe

        11.3.6. Eastern Europe

        11.3.7. Middle East and Africa

    11.4. Market Attractiveness Analysis by Region

12. North America Market Analysis 2019 to 2023 and Forecast 2024 to 2034

    12.1. Introduction

    12.2. Historical Market Size (US$ million) and Volume Analysis by Market Taxonomy, 2019 to 2023

    12.3. Current and Future Market Size (US$ million) and Volume Analysis and Forecast by Market Taxonomy, 2024 to 2034

        12.3.1. By Country

            12.3.1.1. United States

            12.3.1.2. Canada

            12.3.1.3. Mexico

        12.3.2. By Product

        12.3.3. By Application

        12.3.4. By End-user

    12.4. Market Attractiveness Analysis

        12.4.1. By Country

        12.4.2. By Product

        12.4.3. By Application

        12.4.4. By End-user

    12.5. Market Trends

    12.6. Drivers and Restraints - Impact Analysis

    12.7. Country Level Analysis and Forecast

        12.7.1. United States Market Analysis

            12.7.1.1. Introduction

            12.7.1.2. Market Analysis and Forecast by Market Taxonomy

                12.7.1.2.1. By Product

                12.7.1.2.2. By Application

                12.7.1.2.3. By End-user

        12.7.2. Canada Market Analysis

            12.7.2.1. Introduction

            12.7.2.2. Market Analysis and Forecast by Market Taxonomy

                12.7.2.2.1. By Product

                12.7.2.2.2. By Application

                12.7.2.2.3. By End-user

        12.7.3. Mexico Market Analysis

            12.7.3.1. Introduction

            12.7.3.2. Market Analysis and Forecast by Market Taxonomy

                12.7.3.2.1. By Product

                12.7.3.2.2. By Application

                12.7.3.2.3. By End-user

13. Latin America Market Analysis 2019 to 2023 and Forecast 2024 to 2034

    13.1. Introduction

    13.2. Historical Market Size (US$ million) and Volume Analysis by Market Taxonomy, 2019 to 2023

    13.3. Current and Future Market Size (US$ million) and Volume Analysis and Forecast by Market Taxonomy, 2024 to 2034

        13.3.1. By Country

            13.3.1.1. Brazil

            13.3.1.2. Chile

            13.3.1.3. Rest of Latin America

        13.3.2. By Product

        13.3.3. By Application

        13.3.4. By End-user

    13.4. Market Attractiveness Analysis

        13.4.1. By Country

        13.4.2. By Product

        13.4.3. By Application

        13.4.4. By End-user

    13.5. Market Trends

    13.6. Drivers and Restraints - Impact Analysis

    13.7. Country Level Analysis and Forecast

        13.7.1. Brazil Market Analysis

            13.7.1.1. Introduction

            13.7.1.2. Market Analysis and Forecast by Market Taxonomy

                13.7.1.2.1. By Product

                13.7.1.2.2. By Application

                13.7.1.2.3. By End-user

        13.7.2. Chile Market Analysis

            13.7.2.1. Introduction

            13.7.2.2. Market Analysis and Forecast by Market Taxonomy

                13.7.2.2.1. By Product

                13.7.2.2.2. By Application

                13.7.2.2.3. By End-user

14. East Asia Market Analysis 2019 to 2023 and Forecast 2024 to 2034

    14.1. Introduction

    14.2. Historical Market Size (US$ million) and Volume Analysis by Market Taxonomy, 2019 to 2023

    14.3. Current and Future Market Size (US$ million) and Volume Analysis and Forecast by Market Taxonomy, 2024 to 2034

        14.3.1. By Country

            14.3.1.1. China

            14.3.1.2. Japan

            14.3.1.3. South Korea

        14.3.2. By Product

        14.3.3. By Application

        14.3.4. By End-user

    14.4. Market Attractiveness Analysis

        14.4.1. By Country

        14.4.2. By Product

        14.4.3. By Application

        14.4.4. By End-user

    14.5. Market Trends

    14.6. Drivers and Restraints - Impact Analysis

    14.7. Country Level Analysis and Forecast

        14.7.1. China Market Analysis

            14.7.1.1. Introduction

            14.7.1.2. Market Analysis and Forecast by Market Taxonomy

                14.7.1.2.1. By Product

                14.7.1.2.2. By Application

                14.7.1.2.3. By End-user

        14.7.2. Japan Market Analysis

            14.7.2.1. Introduction

            14.7.2.2. Market Analysis and Forecast by Market Taxonomy

                14.7.2.2.1. By Product

                14.7.2.2.2. By Application

                14.7.2.2.3. By End-user

        14.7.3. South Korea Market Analysis

            14.7.3.1. Introduction

            14.7.3.2. Market Analysis and Forecast by Market Taxonomy

                14.7.3.2.1. By Product

                14.7.3.2.2. By Application

                14.7.3.2.3. By End-user

15. South Asia and Pacific Market Analysis 2019 to 2023 and Forecast 2024 to 2034

    15.1. Introduction

    15.2. Historical Market Size (US$ million) and Volume Analysis by Market Taxonomy, 2019 to 2023

    15.3. Current and Future Market Size (US$ million) and Volume Analysis and Forecast by Market Taxonomy, 2024 to 2034

        15.3.1. By Country

            15.3.1.1. India

            15.3.1.2. ASEAN Countries

            15.3.1.3. Singapore

            15.3.1.4. Australia and New Zealand

            15.3.1.5. Rest of South Asia and Pacific

        15.3.2. By Product

        15.3.3. By Application

        15.3.4. By End-user

    15.4. Market Attractiveness Analysis

        15.4.1. By Country

        15.4.2. By Product

        15.4.3. By Application

        15.4.4. By End-user

    15.5. Market Trends

    15.6. Drivers and Restraints - Impact Analysis

    15.7. Country Level Analysis and Forecast

        15.7.1. India Market Analysis

            15.7.1.1. Introduction

            15.7.1.2. Market Analysis and Forecast by Market Taxonomy

                15.7.1.2.1. By Product

                15.7.1.2.2. By Application

                15.7.1.2.3. By End-user

        15.7.2. ASEAN Countries Market Analysis

            15.7.2.1. Introduction

            15.7.2.2. Market Analysis and Forecast by Market Taxonomy

                15.7.2.2.1. By Product

                15.7.2.2.2. By Application

                15.7.2.2.3. By End-user

        15.7.3. Singapore Countries Market Analysis

            15.7.3.1. Introduction

            15.7.3.2. Market Analysis and Forecast by Market Taxonomy

                15.7.3.2.1. By Product

                15.7.3.2.2. By Application

                15.7.3.2.3. By End-user

        15.7.4. Australia and New Zealand Market Analysis

            15.7.4.1. Introduction

            15.7.4.2. Market Analysis and Forecast by Market Taxonomy

                15.7.4.2.1. By Product

                15.7.4.2.2. By Application

                15.7.4.2.3. By End-user

16. Western Europe Market 2019 to 2023 and Forecast 2024 to 2034

    16.1. Introduction

    16.2. Historical Market Size (US$ million) and Volume Analysis by Market Taxonomy, 2019 to 2023

    16.3. Current and Future Market Size (US$ million) and Volume Analysis and Forecast by Market Taxonomy, 2024 to 2034

        16.3.1. By Country

            16.3.1.1. Germany

            16.3.1.2. Italy

            16.3.1.3. France

            16.3.1.4. United Kingdom

            16.3.1.5. Spain

            16.3.1.6. BENELUX

            16.3.1.7. Nordic Countries

            16.3.1.8. Switzerland

            16.3.1.9. Rest of Western Europe

        16.3.2. By Product

        16.3.3. By Application

        16.3.4. By End-user

    16.4. Market Attractiveness Analysis

        16.4.1. By Country

        16.4.2. By Product

        16.4.3. By Detectors

        16.4.4. By Application

        16.4.5. By End-user

    16.5. Market Trends

    16.6. Drivers and Restraints - Impact Analysis

    16.7. Country Level Analysis and Forecast

        16.7.1. Germany Market Analysis

            16.7.1.1. Introduction

            16.7.1.2. Market Analysis and Forecast by Market Taxonomy

                16.7.1.2.1. By Product

                16.7.1.2.2. By Application

                16.7.1.2.3. By End-user

        16.7.2. France Market Analysis

            16.7.2.1. Introduction

            16.7.2.2. Market Analysis and Forecast by Market Taxonomy

                16.7.2.2.1. By Product

                16.7.2.2.2. By Application

                16.7.2.2.3. By End-user

        16.7.3. Spain Market Analysis

            16.7.3.1. Introduction

            16.7.3.2. Market Analysis and Forecast by Market Taxonomy

                16.7.3.2.1. By Product

                16.7.3.2.2. By Application

                16.7.3.2.3. By End-user

        16.7.4. Italy Market Analysis

            16.7.4.1. Introduction

            16.7.4.2. Market Analysis and Forecast by Market Taxonomy

                16.7.4.2.1. By Product

                16.7.4.2.2. By Application

                16.7.4.2.3. By End-user

        16.7.5. BENELUX Market Analysis

            16.7.5.1. Introduction

            16.7.5.2. Market Analysis and Forecast by Market Taxonomy

                16.7.5.2.1. By Product

                16.7.5.2.2. By Application

                16.7.5.2.3. By End-user

        16.7.6. Nordic Countries Market Analysis

            16.7.6.1. Introduction

            16.7.6.2. Market Analysis and Forecast by Market Taxonomy

                16.7.6.2.1. By Product

                16.7.6.2.2. By Application

                16.7.6.2.3. By End-user

        16.7.7. United Kingdom Market Analysis

            16.7.7.1. Introduction

            16.7.7.2. Market Analysis and Forecast by Market Taxonomy

                16.7.7.2.1. By Product

                16.7.7.2.2. By Application

                16.7.7.2.3. By End-user

        16.7.8. Switzerland Market Analysis

            16.7.8.1. Introduction

            16.7.8.2. Market Analysis and Forecast by Market Taxonomy

                16.7.8.2.1. By Product

                16.7.8.2.2. By Application

                16.7.8.2.3. By End-user

        16.7.9. Rest of Western Europe Market Analysis

            16.7.9.1. Introduction

            16.7.9.2. Market Analysis and Forecast by Market Taxonomy

                16.7.9.2.1. By Product

                16.7.9.2.2. By Application

                16.7.9.2.3. By End-user

17. Eastern Europe Market Analysis 2019 to 2023 and Forecast 2024 to 2034

    17.1. Introduction

    17.2. Historical Market Size (US$ million) and Volume Analysis by Market Taxonomy, 2019 to 2023

    17.3. Current and Future Market Size (US$ million) and Volume Analysis and Forecast by Market Taxonomy, 2024 to 2034

        17.3.1. By Country

            17.3.1.1. Russia

            17.3.1.2. Hungary

            17.3.1.3. Poland

            17.3.1.4. Rest of Eastern Europe

        17.3.2. By Product

        17.3.3. By Application

        17.3.4. By End-user

    17.4. Market Attractiveness Analysis

        17.4.1. By Country

        17.4.2. By Product

        17.4.3. By Application

        17.4.4. By End-user

    17.5. Market Trends

    17.6. Drivers and Restraints - Impact Analysis

    17.7. Country Level Analysis and Forecast

        17.7.1. Russia Market Analysis

            17.7.1.1. Introduction

            17.7.1.2. Market Analysis and Forecast by Market Taxonomy

                17.7.1.2.1. By Product

                17.7.1.2.2. By Detectors

                17.7.1.2.3. By Application

                17.7.1.2.4. By End-user

        17.7.2. Hungary Market Analysis

            17.7.2.1. Introduction

            17.7.2.2. Market Analysis and Forecast by Market Taxonomy

                17.7.2.2.1. By Product

                17.7.2.2.2. By Application

                17.7.2.2.3. By End-user

        17.7.3. Poland Market Analysis

            17.7.3.1. Introduction

            17.7.3.2. Market Analysis and Forecast by Market Taxonomy

                17.7.3.2.1. By Product

                17.7.3.2.2. By Application

                17.7.3.2.3. By End-user

18. Middle East and Africa Market Analysis 2019 to 2023 and Forecast 2024 to 2034

    18.1. Introduction

    18.2. Key Players Analyzed

    18.3. Historical Market Size (US$ million) and Volume Analysis by Market Taxonomy, 2019 to 2023

    18.4. Current and Future Market Size (US$ million) and Volume Analysis and Forecast by Market Taxonomy, 2024 to 2034

        18.4.1. By Country

            18.4.1.1. Saudi Arabia

            18.4.1.2. Türkiye

            18.4.1.3. South Africa

            18.4.1.4. Other African Union

            18.4.1.5. Rest of Middle East and Africa

        18.4.2. By Product

        18.4.3. By Application

        18.4.4. By End-user

    18.5. Market Attractiveness Analysis

        18.5.1. By Country

        18.5.2. By Product

        18.5.3. By Application

        18.5.4. By End-user

    18.6. Market Trends

    18.7. Drivers and Restraints - Impact Analysis

    18.8. Country Level Analysis and Forecast

        18.8.1. Saudi Arabia Market Analysis

            18.8.1.1. Introduction

            18.8.1.2. Market Analysis and Forecast by Market Taxonomy

                18.8.1.2.1. By Product

                18.8.1.2.2. By Application

                18.8.1.2.3. By End-user

        18.8.2. Türkiye Market Analysis

            18.8.2.1. Introduction

            18.8.2.2. Market Analysis and Forecast by Market Taxonomy

                18.8.2.2.1. By Product

                18.8.2.2.2. By Application

                18.8.2.2.3. By End-user

        18.8.3. GCC countries Market Analysis

            18.8.3.1. Introduction

            18.8.3.2. Market Analysis and Forecast by Market Taxonomy

                18.8.3.2.1. By Product

                18.8.3.2.2. By Application

                18.8.3.2.3. By End-user

        18.8.4. South Africa Market Analysis

            18.8.4.1. Introduction

            18.8.4.2. Market Analysis and Forecast by Market Taxonomy

                18.8.4.2.1. By Product

                18.8.4.2.2. By Application

                18.8.4.2.3. By End-user

        18.8.5. Other African Union Market Analysis

            18.8.5.1. Introduction

            18.8.5.2. Market Analysis and Forecast by Market Taxonomy

                18.8.5.2.1. By Product

                18.8.5.2.2. By Application

                18.8.5.2.3. By End-user

19. Market Structure Analysis

    19.1. Market Analysis by Tier of Companies

    19.2. Market Share Analysis of Top Players

    19.3. Market Presence Analysis

        19.3.1. Regional Footprint Analysis

        19.3.2. Product Footprint Analysis

        19.3.3. Channel Footprint Analysis

20. Competition Analysis

    20.1. Competition Benchmarking

    20.2. Competition Ecosystem Analysis

    20.3. Branding and Promotional Strategies by Key Players

    20.4. Key Development Analysis

    20.5. Competition Dashboard

    20.6. Competition Deep Dive (Tentative List)

        20.6.1. Thermo Fisher Scientific Inc.

            20.6.1.1. Overview

            20.6.1.2. Product Portfolio

            20.6.1.3. Key Financials

            20.6.1.4. SWOT Analysis

            20.6.1.5. Key Developments

            20.6.1.6. Sales Footprint

            20.6.1.7. Strategy Overview

                20.6.1.7.1. Marketing Strategy

                20.6.1.7.2. Product Strategy

                20.6.1.7.3. Channel Strategy

        20.6.2. Bio-Rad Laboratories, Inc.

        20.6.3. Agilent Technologies, Inc.

        20.6.4. Waters Corporation

        20.6.5. Cytiva

        20.6.6. Satorius AG

        20.6.7. Shimazdu Corporation

        20.6.8. PerkinElmer Inc.

        20.6.9. Hitachi High-Tech Corporation

        20.6.10. KNAUER Wissenschaftliche Geräte GmbH

        20.6.11. Gilson Incorporated

        20.6.12. JASCO Global

        20.6.13. Jiangsu Hanbon Science&Technology Co., Ltd.

        20.6.14. LPP Equipment AG

        20.6.15. Teledyne ISCO

        20.6.16. YMC CO., LTD.

        20.6.17. ECOM spol. s r.o.

        20.6.18. Sheng-Hanp.

        20.6.19. Sykam GmbH

        20.6.20. Postnova Analytics GmbH

21. Assumptions and Acronyms Used

22. Research Methodology

List of Tables

Table 01: Global Market Size (US$ million) Analysis 2019 to 2023 and Forecast 2024 to 2034, By Product

Table 02: Global Market Volume (Units) Analysis 2019 to 2023 and Forecast 2024 to 2034, By Product

Table 03: Global Market Size (US$ million) Analysis 2019 to 2023 and Forecast 2024 to 2034, By Application

Table 04: Global Market Size (US$ million) Analysis 2019 to 2023 and Forecast 2024 to 2034, By End-user

Table 05: Global Market Size (US$ million) Analysis 2019 to 2023 and Forecast 2024 to 2034, By Region

Table 06: Global Market Volume (Units) Analysis 2019 to 2023 and Forecast 2024 to 2034, By Region

Table 07: North America Market Size (US$ million) Analysis 2019 to 2023 and Forecast 2024 to 2034, By Country

Table 08: North America Market Size (US$ million) Analysis 2019 to 2023 and Forecast 2024 to 2034, By Product

Table 09: North America Market Volume (Units) Analysis 2019 to 2023 and Forecast 2024 to 2034, By Product

Table 10: North America Market Size (US$ million) Analysis 2019 to 2023 and Forecast 2024 to 2034, By Application

Table 11: North America Market Size (US$ million) Analysis 2019 to 2023 and Forecast 2024 to 2034, By End-user

Table 12: Latin America Market Size (US$ million) Analysis 2019 to 2023 and Forecast 2024 to 2034, By Country

Table 13: Latin America Market Size (US$ million) Analysis 2019 to 2023 and Forecast 2024 to 2034, By Product

Table 14: Latin America Market Volume (Units) Analysis 2019 to 2023 and Forecast 2024 to 2034, By Product

Table 15: Latin America Market Size (US$ million) Analysis 2019 to 2023 and Forecast 2024 to 2034, By Application

Table 16: Latin America Market Size (US$ million) Analysis 2019 to 2023 and Forecast 2024 to 2034, By End-user

Table 17: East Asia Market Size (US$ million) Analysis 2019 to 2023 and Forecast 2024 to 2034, By Country

Table 18: East Asia Market Size (US$ million) Analysis 2019 to 2023 and Forecast 2024 to 2034, By Product

Table 19: East Asia Market Volume (Units) Analysis 2019 to 2023 and Forecast 2024 to 2034, By Product

Table 20: East Asia Market Size (US$ million) Analysis 2019 to 2023 and Forecast 2024 to 2034, By Application

Table 21: East Asia Market Size (US$ million) Analysis 2019 to 2023 and Forecast 2024 to 2034, By End-user

Table 22: South Asia and Pacific Market Size (US$ million) Analysis 2019 to 2023 and Forecast 2024 to 2034, By Country

Table 23: South Asia and Pacific Market Size (US$ million) Analysis 2019 to 2023 and Forecast 2024 to 2034, By Product

Table 24: South Asia and Pacific Market Volume (Units) Analysis 2019 to 2023 and Forecast 2024 to 2034, By Product

Table 25: South Asia and Pacific Market Size (US$ million) Analysis 2019 to 2023 and Forecast 2024 to 2034, By Application

Table 26: South Asia and Pacific Market Size (US$ million) Analysis 2019 to 2023 and Forecast 2024 to 2034, By End-user

Table 27: Western Europe Market Size (US$ million) Analysis 2019 to 2023 and Forecast 2024 to 2034, By Country

Table 28: Western Europe Market Size (US$ million) Analysis 2019 to 2023 and Forecast 2024 to 2034, By Product

Table 29: Western Europe Market Volume (Units) Analysis 2019 to 2023 and Forecast 2024 to 2034, By Product

Table 30: Western Europe Market Size (US$ million) Analysis 2019 to 2023 and Forecast 2024 to 2034, By Application

Table 31: Western Europe Market Size (US$ million) Analysis 2019 to 2023 and Forecast 2024 to 2034, By End-user

Table 32: Eastern Europe Market Size (US$ million) Analysis 2019 to 2023 and Forecast 2024 to 2034, By Country

Table 33: Eastern Europe Market Size (US$ million) Analysis 2019 to 2023 and Forecast 2024 to 2034, By Product

Table 34: Eastern Europe Market Volume (Units) Analysis 2019 to 2023 and Forecast 2024 to 2034, By Product

Table 35: Eastern Europe Market Size (US$ million) Analysis 2019 to 2023 and Forecast 2024 to 2034, By Application

Table 36: Eastern Europe Market Size (US$ million) Analysis 2019 to 2023 and Forecast 2024 to 2034, By End-user

Table 37: Middle East and Africa Market Size (US$ million) Analysis 2019 to 2023 and Forecast 2024 to 2034, By Country

Table 38: Middle East and Africa Market Size (US$ million) Analysis 2019 to 2023 and Forecast 2024 to 2034, By Product

Table 39: Middle East and Africa Market Volume (Units) Analysis 2019 to 2023 and Forecast 2024 to 2034, By Product

Table 40: Middle East and Africa Market Size (US$ million) Analysis 2019 to 2023 and Forecast 2024 to 2034, By Application

Table 41: Middle East and Africa Market Size (US$ million) Analysis 2019 to 2023 and Forecast 2024 to 2034, By End-user

List of Charts

Figure 1: Global Market Share, By Product, 2024 (E)

Figure 2: Global Market Share, By Application, 2024 (E)

Figure 3: Global Market Share, By End-user, 2024 (E)

Figure 4: Global Market Share, By Region, 2024 (E)

Figure 5: Global Market Volume Analysis (Units), 2019 to 2023

Figure 6: Global Market Volume Forecast (Units), 2024 to 2034

Figure 7: Global Average Pricing Analysis Benchmark US$ (Unit) (2024)

Figure 8: Semi-Preparative HPLC Systems Pricing Analysis (US$) for Per Unit, By Region, 2024

Figure 9: Preparative HPLC Systems Pricing Analysis (US$) for Per Unit, By Region, 2024

Figure 10: UV/Vis Detectors Pricing Analysis (US$) for Per Unit, By Region, 2024

Figure 11: Diode-Array Detectors Pricing Analysis (US$) for Per Unit, By Region, 2024

Figure 12: Refractive Index Detectors Pricing Analysis (US$) for Per Unit, By Region, 2024

Figure 13: Fluorescence Detectors Pricing Analysis (US$) for Per Unit, By Region, 2024

Figure 14: Mass Spectrometry Detectors Pricing Analysis (US$) for Per Unit, By Region, 2024

Figure 15: Evaporating Light Scattering Detectors Pricing Analysis (US$) for Per Unit, By Region, 2024

Figure 16: Electrochemical Detectors Pricing Analysis (US$) for Per Unit, By Region, 2024

Figure 17: Prepacked Columns Pricing Analysis (US$) for Per Unit, By Region, 2024

Figure 18: Empty Columns Pricing Analysis (US$) for Per Unit, By Region, 2024

Figure 19: Global Market Value Analysis (US$ million), 2019 to 2023

Figure 20: Global Market Value Forecast (US$ million), 2024 to 2034

Figure 21: Global Market Absolute Market Absolute $ Opportunity, 2024 to 2034

Figure 22: Global Market Share Analysis (%), By Product, 2024 (E) and 2034 (F)

Figure 23: Global Market Y-o-Y Analysis (%), By Product, 2024 to 2034

Figure 24: Global Market Attractiveness Analysis by Product, 2024 to 2034

Figure 25: Global Market Share Analysis (%), By Application, 2024 (E) and 2034 (F)

Figure 26: Global Market Y-o-Y Analysis (%), By Application, 2024 to 2034

Figure 27: Global Market Attractiveness Analysis by Application, 2024 to 2034

Figure 28: Global Market Share Analysis (%), By End-user, 2024 (E) and 2034 (F)

Figure 29: Global Market Y-o-Y Analysis (%), By End-user, 2024 to 2034

Figure 30: Global Market Attractiveness Analysis by End-user, 2024 to 2034

Figure 31: Global Market Share Analysis (%), By Region, 2024 (E) and 2034 (F)

Figure 32: Global Market Y-o-Y Analysis (%), By Region, 2024 to 2034

Figure 33: Global Market Attractiveness Analysis by Region, 2024 to 2034

Figure 34: North America Market Share, By Product, 2024 (E)

Figure 35: North America Market Share, By Application, 2024 (E)

Figure 36: North America Market Share, By End-user, 2024 (E)

Figure 37: North America Market Share, By Country, 2024 (E)

Figure 38: North America Market Value (US$ million) Analysis 2019 to 2023

Figure 39: North America Market Value (US$ million) Analysis 2024 to 2034

Figure 40: North America Market Attractiveness Analysis by Product, 2024 to 2034

Figure 41: North America Market Attractiveness Analysis by Technology, 2024 to 2034

Figure 42: North America Market Attractiveness Analysis by End-user, 2024 to 2034

Figure 43: North America Market Attractiveness Analysis by Country, 2024 to 2034

Figure 44: United States Market Share Analysis (%) By Product, 2024 and 2034

Figure 45: United States Market Share Analysis (%) By Application, 2024 and 2034

Figure 46: United States Market Share Analysis (%) By End-user, 2024 and 2034

Figure 47: Canada Market Share Analysis (%) By Product, 2024 and 2034

Figure 48: Canada Market Share Analysis (%) By Application, 2024 and 2034

Figure 49: Canada Market Share Analysis (%) By End-user, 2024 and 2034

Figure 50: Mexico Market Share Analysis (%) By Product, 2024 and 2034

Figure 51: Mexico Market Share Analysis (%) By Application, 2024 and 2034

Figure 52: Mexico Market Share Analysis (%) By End-user, 2024 and 2034

Figure 53: Latin America Market Share, By Product, 2024 (E)

Figure 54: Latin America Market Share, By Application, 2024 (E)

Figure 55: Latin America Market Share, By End-user, 2024 (E)

Figure 56: Latin America Market Share, By Country, 2024 (E)

Figure 57: Latin America Market Value (US$ million) Analysis 2019 to 2023

Figure 58: Latin America Market Value (US$ million) Analysis 2024 to 2034

Figure 59: Latin America Market Attractiveness Analysis by Product, 2024 to 2034

Figure 60: Latin America Market Attractiveness Analysis by Technology, 2024 to 2034

Figure 61: Latin America Market Attractiveness Analysis by End-user, 2024 to 2034

Figure 62: Latin America Market Attractiveness Analysis by Country, 2024 to 2034

Figure 63: Brazil Market Share Analysis (%) By Product, 2024 and 2034

Figure 64: Brazil Market Share Analysis (%) By Application, 2024 and 2034

Figure 65: Brazil Market Share Analysis (%) By End-user, 2024 and 2034

Figure 66: Chile Market Share Analysis (%) By Product, 2024 and 2034

Figure 67: Chile Market Share Analysis (%) By Application, 2024 and 2034

Figure 68: Chile Market Share Analysis (%) By End-user, 2024 and 2034

Figure 69: East Asia Market Share, By Product, 2024 (E)

Figure 70: East Asia Market Share, By Application, 2024 (E)

Figure 71: East Asia Market Share, By End-user, 2024 (E)

Figure 72: East Asia Market Share, By Country, 2024 (E)

Figure 73: East Asia Market Value (US$ million) Analysis 2019 to 2023

Figure 74: East Asia Market Value (US$ million) Analysis 2024 to 2034

Figure 75: East Asia Market Attractiveness Analysis by Product, 2024 to 2034

Figure 76: East Asia Market Attractiveness Analysis by Technology, 2024 to 2034

Figure 77: East Asia Market Attractiveness Analysis by End-user, 2024 to 2034

Figure 78: East Asia Market Attractiveness Analysis by Country, 2024 to 2034

Figure 79: China Market Share Analysis (%) By Product, 2024 and 2034

Figure 80: China Market Share Analysis (%) By Application, 2024 and 2034

Figure 81: China Market Share Analysis (%) By End-user, 2024 and 2034

Figure 82: Japan Market Share Analysis (%) By Product, 2024 and 2034

Figure 83: Japan Market Share Analysis (%) By Application, 2024 and 2034

Figure 84: Japan Market Share Analysis (%) By End-user, 2024 and 2034

Figure 85: South Korea Market Share Analysis (%) By Product, 2024 and 2034

Figure 86: South Korea Market Share Analysis (%) By Application, 2024 and 2034

Figure 87: South Korea Market Share Analysis (%) By End-user, 2024 and 2034

Figure 88: South Asia and Pacific Market Share, By Product, 2024 (E)

Figure 89: South Asia and Pacific Market Share, By Application, 2024 (E)

Figure 90: South Asia and Pacific Market Share, By End-user, 2024 (E)

Figure 91: South Asia and Pacific Market Share, By Country, 2024 (E)

Figure 92: South Asia and Pacific Market Value (US$ million) Analysis 2019 to 2023

Figure 93: South Asia and Pacific Market Value (US$ million) Analysis 2024 to 2034

Figure 94: South Asia and Pacific Market Attractiveness Analysis by Product, 2024 to 2034

Figure 95: South Asia and Pacific Market Attractiveness Analysis by Technology, 2024 to 2034

Figure 96: South Asia and Pacific Market Attractiveness Analysis by End-user, 2024 to 2034

Figure 97: South Asia and Pacific Market Attractiveness Analysis by Country, 2024 to 2034

Figure 98: India Market Share Analysis (%) By Product, 2024 and 2034

Figure 99: India Market Share Analysis (%) By Application, 2024 and 2034

Figure 100: India Market Share Analysis (%) By End-user, 2024 and 2034

Figure 101: AESAN Countries Market Share Analysis (%) By Product, 2024 and 2034

Figure 102: AESAN Countries Market Share Analysis (%) By Application, 2024 and 2034

Figure 103: AESAN Countries Market Share Analysis (%) By End-user, 2024 and 2034

Figure 104: Australia and New Zealand Market Share Analysis (%) By Product, 2024 and 2034

Figure 105: Australia and New Zealand Market Share Analysis (%) By Application, 2024 and 2034

Figure 106: Australia and New Zealand Market Share Analysis (%) By End-user, 2024 and 2034

Figure 107: Western Europe Market Share, By Product, 2024 (E)

Figure 108: Western Europe Market Share, By Application, 2024 (E)

Figure 109: Western Europe Market Share, By End-user, 2024 (E)

Figure 110: Western Europe Market Share, By Country, 2024 (E)

Figure 111: Western Europe Market Value (US$ million) Analysis 2019 to 2023

Figure 112: Western Europe Market Value (US$ million) Analysis 2024 to 2034

Figure 113: Western Europe Market Attractiveness Analysis by Product, 2024 to 2034

Figure 114: Western Europe Market Attractiveness Analysis by Technology, 2024 to 2034

Figure 115: Western Europe Market Attractiveness Analysis by End-user, 2024 to 2034

Figure 116: Western Europe Market Attractiveness Analysis by Country, 2024 to 2034

Figure 117: Germany Market Share Analysis (%) By Product, 2024 and 2034

Figure 118: Germany Market Share Analysis (%) By Application, 2024 and 2034

Figure 119: Germany Market Share Analysis (%) By End-user, 2024 and 2034

Figure 120: Italy Market Share Analysis (%) By Product, 2024 and 2034

Figure 121: Italy Market Share Analysis (%) By Application, 2024 and 2034

Figure 122: Italy Market Share Analysis (%) By End-user, 2024 and 2034

Figure 123: France Market Share Analysis (%) By Product, 2024 and 2034

Figure 124: France Market Share Analysis (%) By Application, 2024 and 2034

Figure 125: France Market Share Analysis (%) By End-user, 2024 and 2034

Figure 126: United Kingdom Market Share Analysis (%) By Product, 2024 and 2034

Figure 127: United Kingdom Market Share Analysis (%) By Application, 2024 and 2034

Figure 128: United Kingdom Market Share Analysis (%) By End-user, 2024 and 2034

Figure 129: Spain Market Share Analysis (%) By Product, 2024 and 2034

Figure 130: Spain Market Share Analysis (%) By Application, 2024 and 2034

Figure 131: Spain Market Share Analysis (%) By End-user, 2024 and 2034

Figure 132: BENELUX Market Share Analysis (%) By Product, 2024 and 2034

Figure 133: BENELUX Market Share Analysis (%) By Application, 2024 and 2034

Figure 134: BENELUX Market Share Analysis (%) By End-user, 2024 and 2034

Figure 135: Nordic Countries Market Share Analysis (%) By Product, 2024 and 2034

Figure 136: Nordic Countries Market Share Analysis (%) By Application, 2024 and 2034

Figure 137: Nordic Countries Market Share Analysis (%) By End-user, 2024 and 2034

Figure 138: Eastern Europe Market Share, By Product, 2024 (E)

Figure 139: Eastern Europe Market Share, By Application, 2024 (E)

Figure 140: Eastern Europe Market Share, By End-user, 2024 (E)

Figure 141: Eastern Europe Market Share, By Country, 2024 (E)

Figure 142: Eastern Europe Market Value (US$ million) Analysis 2019 to 2023

Figure 143: Eastern Europe Market Value (US$ million) Analysis 2024 to 2034

Figure 144: Eastern Europe Market Attractiveness Analysis by Product, 2024 to 2034

Figure 145: Eastern Europe Market Attractiveness Analysis by Technology, 2024 to 2034

Figure 146: Eastern Europe Market Attractiveness Analysis by End-user, 2024 to 2034

Figure 147: Eastern Europe Market Attractiveness Analysis by Country, 2024 to 2034

Figure 148: Russia Market Share Analysis (%) By Product, 2024 and 2034

Figure 149: Russia Market Share Analysis (%) By Application, 2024 and 2034

Figure 150: Russia Market Share Analysis (%) By End-user, 2024 and 2034

Figure 151: Hungary Market Share Analysis (%) By Product, 2024 and 2034

Figure 152: Hungary Market Share Analysis (%) By Application, 2024 and 2034

Figure 153: Hungary Market Share Analysis (%) By End-user, 2024 and 2034

Figure 154: Poland Market Share Analysis (%) By Product, 2024 and 2034

Figure 155: Poland Market Share Analysis (%) By Application, 2024 and 2034

Figure 156: Poland Market Share Analysis (%) By End-user, 2024 and 2034

Figure 157: Middle East and Africa Market Share, By Product, 2024 (E)

Figure 158: Middle East and Africa Market Share, By Application, 2024 (E)

Figure 159: Middle East and Africa Market Share, By End-user, 2024 (E)

Figure 160: Middle East and Africa Market Share, By Country, 2024 (E)

Figure 161: Middle East and Africa Market Value (US$ million) Analysis 2019 to 2023

Figure 162: Middle East and Africa Market Value (US$ million) Analysis 2024 to 2034

Figure 163: Middle East and Africa Market Attractiveness Analysis by Product, 2024 to 2034

Figure 164: Middle East and Africa Market Attractiveness Analysis by Technology, 2024 to 2034

Figure 165: Middle East and Africa Market Attractiveness Analysis by End-user, 2024 to 2034

Figure 166: Middle East and Africa Market Attractiveness Analysis by Country, 2024 to 2034

Figure 167: Saudi Arabia Market Share Analysis (%) By Product, 2024 and 2034

Figure 168: Saudi Arabia Market Share Analysis (%) By Application, 2024 and 2034

Figure 169: Saudi Arabia Market Share Analysis (%) By End-user, 2024 and 2034

Figure 170: Türkiye Market Share Analysis (%) By Product, 2024 and 2034

Figure 171: Türkiye Market Share Analysis (%) By Application, 2024 and 2034

Figure 172: Türkiye Market Share Analysis (%) By End-user, 2024 and 2034

Figure 173: South Africa Market Share Analysis (%) By Product, 2024 and 2034

Figure 174: South Africa Market Share Analysis (%) By Application, 2024 and 2034

Figure 175: South Africa Market Share Analysis (%) By End-user, 2024 and 2034

Figure 176: Other African Union Market Share Analysis (%) By Product, 2024 and 2034

Figure 177: Other African Union Market Share Analysis (%) By Application, 2024 and 2034

Figure 178: Other African Union Market Share Analysis (%) By End-user, 2024 and 2034

Recommendations

Healthcare

Podiatry Service Market

Published : January 2024

Healthcare

Orthopedic Prosthetics Market

Published : January 2024

Healthcare

Temperature Monitoring Device Market

Published : January 2024

Healthcare

Liquid Filled Capsule Market

Published : January 2024

Explore Healthcare Insights

View Reports

Preparative Chromatography Market