Chromatography Resin Market
Market Insights on Chromatography Resin covering sales outlook, demand forecast & up-to-date key trends
Chromatography Resin Market by Product Type (Native, Synthetic), Technology Type (Affinity Chromatography, Anion Exchange Chromatography, Cation Exchange Chromatography, Size Exclusion, Hydrophobic Interaction), End User Type & Region - Forecast to 2021-2031
Chromatography Resin Market Snapshot
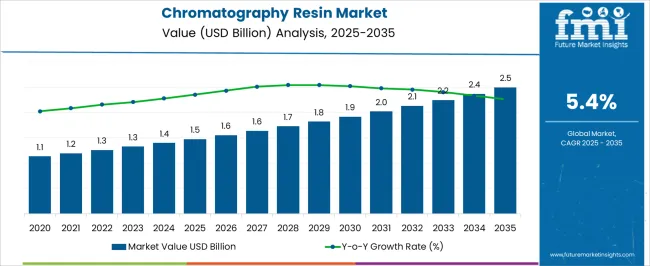
Following the outbreak of COVID-19, chromatography resins market witnessed a slight dip in the sales. Despite this, the market registered year on year growth by 2.74% CAGR in 2021. Growing demand for monoclonal antibody production will improve the chromatography resins demand during the forecast period of 2021 and 2031.
Expansion of bio-pharmaceutical industry and advancements in research in genomics across the U.S., Japan, Germany and Canada will guarantee consistent growth. Based on this, the market is expected to reach a valuation of US$ 2215 Mn in 2031.
Let us know your requirement to get
100% FREE customization
Key Points Covered in Chromatography Resin Market Study
- Market estimates and forecast 2021-2031
- Key drivers and restraints impacting market growth
- Segment-wise, Country-wise, and Region-wise Analysis
- Competition Mapping and Benchmarking
- Brand share and Market Share Analysis
- Key Product Innovations and Regulatory Climate
- COVID-19 Impact on Chromatography Resin Market and How to Navigate
- Recommendation on Key Winning Strategies
Chromatography Resin Market Historic Sales Compared to 2021-2031 Forecast Outlook
Rising prevalence of non-communicable diseases, adoption of chromatography resins for separation of bio-similar and bio-molecules are some of the key drivers propelling the market growth.
According to the ESOMAR-certified consulting firm Future Market Insights, the global chromatography resin market is poised to expand at a steady growth rate of around 6.90% CAGR during the forecast period of 2021 and 2031.
Surging demand for monoclonal antibody production and expansion of bio-pharmaceutical industry across developed countries will improve the demand for chromatography resins. Spurred by this, chromatography resins sales will surpass a value of US$ 2215 Mn in 2031.
Subsequently, increased funding and advancements in research in genomics, adoption of chromatography resin technology and the separation of chiral compounds is anticipated to accelerate the growth.
How will Technological Advancements & Demand for Biosimilar Drive the Growth?
Rapid adoption of chromatography resin technology within research laboratories and biopharmaceutical companies are extensively focusing on incorporation of advanced technology is spurring the growth.
Advancements in chromatography technologies for separation & purification of complex biomolecules and bio-substances will boost the demand for advanced chromatography resin across the U.S., Germany, the U.K and China.
Demand for cost-effective technology for the separation and purification of isomers, enantiomers and other active pharmaceutical ingredients across Germany is fueling the growth during the forecast period.
Also, increasing use of chromatography for the bio-separation techniques used in the manufacturing of biosimilar antibodies is improving the adoption of chromatography resins. Rising demand for biosimilars is projected to improve the use of chromatography resins throughout the forecast period.
Presently available biosimilars are utilized for cancer, rheumatoid arthritis, infectious disorders, psoriasis, anemia, post-menopausal osteoporosis, type-1 and type-2 diabetes, and hormonal disorders treatments.
These application of biosimilars have increased the usage of chromatography resins in the manufacturing and development of economic drugs. These factors are expected to bolster the market growth over the forecast period.
Find your sweet spots for generating winning opportunities in this market.
Talk to AnalystStringent Regulatory Policies to Curb the Chromatography Resin Market Growth
Strict norms implemented by the regulatory bodies, such as U.S. Food and Drug Administration and the European Commission, for new products such as chromatography resins and columns for analysis & diagnostic purposes are likely to impede the market growth.
Stringent regulations combined with availability of alternatives to chromatography resin such as ion-exchange resin, Nuvia S, proposed by the industry giant Bio-Rad, are likely to hinder the demand of chromatography resin market.
High-cost for the adoption and use of chromatography resin technologies is another factor hampering the market growth. Higher selling prices and repeated use of chromatography to lower the manufacturing cost is affecting the quality, which in turn is obstructing the growth.
Further, many manufacturing companies prefer using smaller protein A column instead of larger protein A column to reduce the manufacturing cost by repeating cycles for the use of single batch of monoclonal antibodies (mABs). This is expected to negatively affect the demand.
Country-wise Insights
What are the Chromatography Resin Market Drivers in the U.S.?
The chromatography resin market in the U.S. is expected to remain the largest market across North America, with sales anticipated to reach a valuation of approximately US$ 700 Mn by 2031-end, as per FMI’s projections.
Strong growth of therapeutic monoclonal antibody market will be the key driver for chromatography resin sales in this region. Increasing adoption of chromatography resin technologies by various industry giants such as Bio-Rad, Thermo Fisher, and Repligen, will propel the market growth.
Increasing research & development expenditure by biopharmaceutical companies and biotechnology companies will improve the market demand. Ever expanding pharmaceutical industry in the U.S. and rising geriatric population with critical diseases will aid the growth.
Advanced chromatography technologies used for the food analytics and diagnosing purpose due to the high consumption of chromatography resin in the country is boosting the market demand.
In the U.S., according to the Centers for Disease Control, over 100 million people suffer from diabetes, and this number has increased two-fold over the past five years. Due to this, there have been surge in the research & development (R&D) activities across the country for developing advanced drugs.
Well-established R&D infrastructure, private investments, and expansion through increased investment by government for the adoption of chromatography resin technologies within biotechnological institutes is bolstering the growth.
Why is India Expected to Exhibit High Market Growth?
India is expected to be highly lucrative market across South Asia during the forecast period on the back rising initiatives by government regarding the increasing burden of non-communicable diseases, estimates FMI’s analysis.
According to Ministry of Health & Family Welfare, government of India have launched the national program for prevention & control of cancer, diabetes, cardiovascular disease and stroke (NPCDCS) in 2010.
As per the government’s report, the non-communicable diseases (NCD) estimated for over 60% of all deaths, with around 63 million suffering from immunodeficiency disorders.
Due to the rising prevalence of these diseases, the government implemented the NPCDCS program in 100 districts across 21 states. High funding was provided to the biopharmaceutical companies across the region to conduct research & development activities for the development of economic drugs.
According to the World Health Organization, nearly 5.8 million people die from heart and lung diseases and unaffordable drugs. Around 55 million are estimated to die by 2030 due to the non-communicable diseases or unaffordability of the drugs in the country.
Hence, by the implementation of NPCDCS program and high funding, the biosimilar drug manufacturers are developing economic drugs for NCD by adopting affinity chromatography resin technology to develop drugs for NCD.
Increasing adoption of chromatography resin technologies within biopharmaceutical companies and research organization is improving the market demand.
As per the FMI’s analysis, Asia Pacific excluding Japan is estimated to register fastest expansion of chromatography resin market, exhibiting the growth at 11.4% CAGR during the forecast period.
How will Chromatography Resin Market Growth will unfold in Germany?
According to Robert Koch Institut and World Health Organization, mortality rate due to the non-communicable diseases such as cardiovascular disease, chronic respiratory disease and cancer, accounted for 80% of deaths across Germany in 2017.
By 2025, it is estimated that non-communicable diseases will account for over 91% of all deaths in the country. Among which, cancer accounts for 26% while around 37% people will succumb to cardiovascular diseases by 2025.
These estimates are causing high strain on healthcare professionals, due to which the development of drug delivery and discovery have increased in the region. Also, heavy presence of biopharmaceutical companies across the country are providing conducive environment for the biosimilar drug manufacturers. Thereby, propelling the growth of chromatography resins.
Also, increasing research & development activity in the research organizations in this region is positively impacting the market demand. Germany is expected to witness exponential growth over the years attributing to the increasing investments by government in biopharmaceutical research & development.
As per the FMI’s projections, Germany is anticipated to be the most lucrative market across Europe, expanding at an impressive growth rate during the forecast period.
What are the Factors Driving Chromatography Resin Market Growth in the U.K.?
As per the FMI’s analysis, the U.K. is anticipated to be the key market for chromatography resins in Europe, followed by Germany. Rising prevalence of non-communicable diseases within the country such as diabetes, cancer, cardiovascular diseases and neurological disorders are increasing the clinical drug trials across the region.
With this, the adoption of chromatography resins and application of affinity chromatography resin have increased significantly within the biopharmaceutical companies and research institutes, accelerating the market growth over the forecast period.
As per the report of National Statistics of the U.K., around 1 million people in the U.K are diagnosed with neurological condition and approximately 17 million people are suffering from musculoskeletal problems.
Also, mortality rate in the U.K due to respiratory diseases, which includes chronic obstructive pulmonary disease, pneumonia, scarring lung disease and sleep apnea, are higher than any other country in Europe.
Non-communicable diseases, in 2025, are estimated to account for over 89% of all deaths across the region, states World Health Organization in its report of non-communicable diseases.
With this rising cases of critical diseases and burdening mortality rates, government in the U.K. are promoting the antibody therapeutics industry, which is expected to improve the chromatography resin market demand.
Initiatives for formulation & drug delivery are conducted actively coupled with high funding for the biological technology research institutes & biopharmaceutical companies, which is furthering the adoption of chromatography resins in the country.
Stringent regulations laid down by the regulatory bodies such as European Medicines Agency (EMA) and European Commission (EC), is likely to impede the growth of chromatography resin market.
According to which, biologic and biosimilars drug manufacturers are supposed to submit robust data for the approval and to showcase a products efficacy and safety profile. In future, the highly regulated biosimilar and biologic sector is likely to restrict the market growth.

An unified Market Research Subscription Platform, built for today’s disparate research needs.
Category-wise Insights
Why are Synthetic Chromatography Resins Most Preferred?
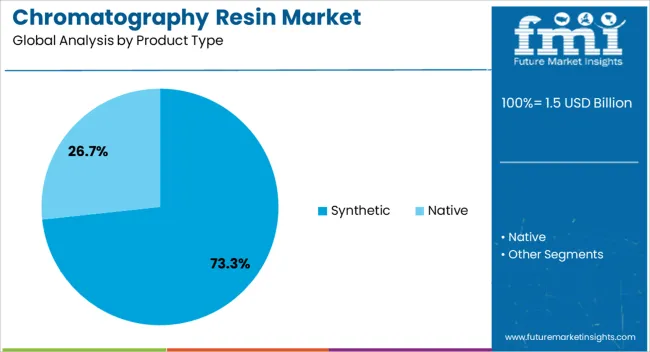
In terms of product type, the market is bifurcated into native chromatography resins and synthetic chromatography resin. As per the FMI’s analysis, synthetic chromatography resin is preferred over native and it is forecast to exhibit growth at over 11.1% CAGR during the forecast period.
In biotechnological analytical experiments, when the resins are exposed to adverse and extreme conditions of pH and pressure, synthetic chromatic resins are more suitable than native chromatography resins.
Also, increasing demand for synthetic chromatography resins from biopharmaceutical companies will accelerate growth in the segment. Driven by these factors, the demand for synthetic chromatography resins will remain high during the forecast period.
Revenue generated from sales of native chromatography resins will remain low in the global market during the forecast period.
Biopharmaceutical Companies will Continue Exhibiting High Demand
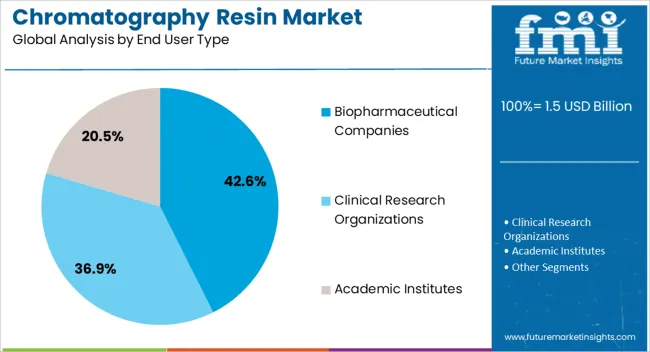
Biopharmaceutical companies are expected to post substantial gains during the forecast period. They are anticipated to remain the largest end user of chromatography resins across the globe, followed by academic institutes.
Owing to the increasing research & development activities for the development and trials of chromatography resins, biopharmaceutical companies are investing heavily, generating their revenues.
Increasing application of chromatography in biopharmaceutical industry for separating chiral compounds, drug discovery for non-communicable disease, and protein purification for drug delivery will positively influence the market demand.
As per the report of World Health Organization (WHO), around 40 million people die due to non-communicable diseases annually. Among which 81% of people succumb to cardiovascular diseases, respiratory disease, cancer and diabetes mellitus. According to ‘WHO’, mortality rate due to these diseases are expected to increase by 17% by 2025.
Acknowledging this burden, government across the globe are providing funding to encourage the research & development (R&D) in biopharmaceutical companies. In addition to this, researches undertaken on HIV/AIDS, immunodeficiency disorders and cancer, technological innovations in biotechnological research, and increasing focus on biopharmaceutical companies are some of the key factors fuelling demand in the market.
Sales of chromatography resins in biopharmaceutical companies segment are set to grow at over 11.2%, to reach a valuation of nearly US$ 900 Mn in revenue by the end of 2031, opines FMI’s market study.
Which is the Most-Used Technology in the Chromatography Resin Market?
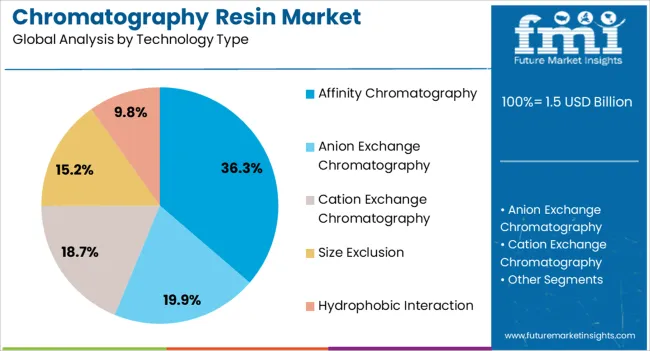
Based on the technology type, the market is sub-segmented into affinity chromatography, anion exchange chromatography, cation exchange chromatography, size exclusion, and hydrophobic interaction.
As per the FMI’s analysis, affinity chromatography is anticipated to be the most used technology in the market. Revenue generated from the sales of affinity chromatography technology is anticipated to surpass the valuation of approx. US$ 681 Mn by 2031.
As this technology offers high selectivity, capacity and resolution in most of the protein purification schemes, the affinity chromatography technology is expected to gain immense popularity over the coming years.
Affinity chromatography technology has the advantage of utilizing a protein’s biological function or structure for purification, which makes this technology simple and time-effective as compared to the other technologies.
Also, increasing application of this technology in separation of mixture of compound, removal of impurities in the purification process, enzyme assays, and other application will improve the adoption of this technology among end users.
Competitive Landscape
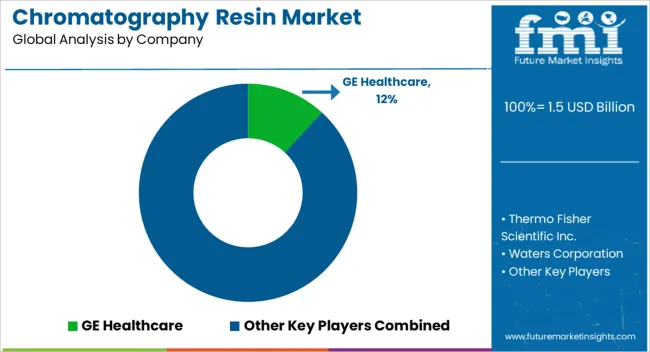
According to FMI, the global chromatography resin market is dominated by top 5 key players, accounting for 70% revenue share in 2021. These companies are Bio-Rad Laboratories, Inc., GE Healthcare, Tosoh Corporation, Merck KGaA, and Thermo Fisher Scientific Inc.
Companies operating in the market are currently focusing on expansion of product portfolio to gain competitive edge.
- In April 2020, Avantor Inc., a leading global provider of mission-critical products and services to customers in life sciences, advanced technology and applied materials industry, announced the launch of a new recombinant Protein A affinity chromatography resin used to purify antibodies during mAbs production.
- In March 2021, Navigo Proteins, a leading protein engineering company and Eleva GmbH, global manufacturer of superior biologics derived from its proprietary moss expression system, announced the launch of its successful development of an affinity chromatography resin customized for the efficient purification of human complement-Factor H.
Scope of Report
Attribute |
Details |
Forecast Period |
2021-2031 |
Historical Data Available for |
2016-2020 |
Market Analysis |
USD Million for Value |
Key Regions Covered |
North America, Latin America, Europe, East Asia, South Asia, Oceania, and the Middle East & Africa |
Key Countries Covered |
US, Canada, Germany, U.K., France, Italy, Spain, Russia, China, Japan, South Korea, India, Thailand, Malaysia, Indonesia, Australia, New Zealand, GCC Countries, Turkey, Northern Africa, and South Africa |
Key Segments Covered |
Product Type, Technology Type, End User, and Region |
Key Companies Profiled |
|
Report Coverage |
Market Forecast, Company Share Analysis, Competition Intelligence, DROT Analysis, Market Dynamics and Challenges, and Strategic Growth Initiatives |
Customization & Pricing |
Available upon Request |
Chromatography Resin Market by Category
By Product Type:
- Native
- Synthetic
By Technology Type:
- Affinity Chromatography
- Anion Exchange Chromatography
- Cation Exchange Chromatography
- Size Exclusion
- Hydrophobic Interaction
By End User Type:
- Biopharmaceutical Companies
- Clinical Research Organizations
- Academic Institutes
By Region:
- North America
- Latin America
- Eastern Europe
- Western Europe
- Asia Pacific excluding Japan
- Japan
- Middle East and Africa (MEA)
Frequently Asked Questions
The chromatography resin market is expected to exceed US$ 1138.10 Mn in 2021
The chromatography resin market projected healthy growth, registering a CAGR at 9.64% between 2016 and 2020.
Increasing demand for monoclonal antibodies production, coupled with rising focus on improvisation in the quality control parameters to improve the efficiency will drive the chromatography resins market demand.
Top 5 prominent players of chromatography resin market are Bio-Rad Laboratories, Inc., GE Healthcare, Tosoh Corporation, Merck KGaA, and Thermo Fisher Scientific Inc.
In 2021, North America accounted for over 30% of global chromatography resins market share.
The top 5 players in the chromatography resin market will collectively account for 70% of global market share in the year 2021.
Japan is anticipated to be one of the most lucrative market, accounting for 7% of global market share.
Top countries in terms of chromatography resin sales are Canada, Russia, Brazil, the U.S., and Japan.
Germany is spearheading the growth of Europe chromatography resin market, accounting for 36% of market share in Europe.
Table of Content
1. Executive Summary
1.1. Market Overview
1.2. Market Analysis
1.3. FMI Analysis and Recommendations
1.4. Wheel of Fortune
2. Market Introduction
2.1. Market Taxonomy
2.2. Market Definition
3. Chromatography Resin Market View Point
3.1. Macro-Economic Factors
3.2. Opportunity Analysis
3.3. Regulatory Scenario
3.4. Porter’s Five Forces Analysis
4. North America Chromatography Resin Market Analysis 2016 – 2020 and Forecast 2021 – 2031
4.1. Introduction
4.2. Key Regulations
4.3. Regional Market Dynamics
4.3.1. Drivers
4.3.2. Restraints
4.3.3. Trends
4.4. Historical Market Size (US$ Mn) Analysis By Country, 2016 – 2020
4.4.1. U.S.
4.4.2. Canada
4.5. Market Size (US$ Mn) Forecast By Country, 2021 – 2031
4.5.1. U.S.
4.5.2. Canada
4.6. Historical Market Size (US$ Mn) Analysis By Product Type, 2016 – 2020
4.6.1. Natural Resins
4.6.2. Synthetic Resins
4.7. Market Size (US$ Mn) Forecast By Product Type, 2021 – 2031
4.7.1. Natural Resins
4.7.2. Synthetic Resins
4.8. Historical Market Size (US$ Mn) Analysis By Technology, 2016 – 2020
4.8.1. Affinity Chromatography
4.8.2. Anion Exchange Chromatography
4.8.3. Cation Exchange Chromatography
4.8.4. Size Exclusion Chromatography
4.8.5. Hydrophobic Interaction Chromatography
4.9. Market Size (US$ Mn) Forecast By Technology, 2021 – 2031
4.9.1. Affinity Chromatography
4.9.2. Anion Exchange Chromatography
4.9.3. Cation Exchange Chromatography
4.9.4. Size Exclusion Chromatography
4.9.5. Hydrophobic Interaction Chromatography
4.10. Historical Market Size (US$ Mn) Analysis By End Users, 2016 – 2020
4.10.1. Biopharmaceutical Companies
4.10.2. Clinical Research Organizations
4.10.3. Academic Institutes
4.11. Market Size (US$ Mn) Forecast By End Users, 2021 – 2031
4.11.1. Biopharmaceutical Companies
4.11.2. Clinical Research Organizations
4.11.3. Academic Institutes
4.12. Drivers and Restraints: Impact Analysis
4.13. Market Attractiveness Analysis
4.13.1. By Country
4.13.2. By Product Type
4.13.3. By Technology
4.13.4. By End Users
4.14. Key Representative Market Participants
4.15. Key Participants Market Presence (Intensity Map)
5. Western Europe Chromatography Resin Market Analysis 2016 – 2020 and Forecast 2021 – 2031
5.1. Introduction
5.2. Key Regulations
5.3. Regional Market Dynamics
5.3.1. Drivers
5.3.2. Restraints
5.3.3. Trends
5.4. Historical Market Size (US$ Mn) Analysis By Country, 2016 – 2020
5.4.1. Germany
5.4.2. United Kingdom
5.4.3. France
5.4.4. Italy
5.4.5. Spain
5.4.6. Nordic Region
5.4.7. BENELUX
5.4.8. Rest of Western Europe
5.5. Market Size (US$ Mn) Forecast By Country, 2021 – 2031
5.5.1. Germany
5.5.2. United Kingdom
5.5.3. France
5.5.4. Italy
5.5.5. Spain
5.5.6. Nordic Region
5.5.7. BENELUX
5.5.8. Rest of Western Europe
5.6. Historical Market Size (US$ Mn) Analysis By Product Type, 2016 – 2020
5.6.1. Natural Resins
5.6.2. Synthetic Resins
5.7. Market Size (US$ Mn) Forecast By Product Type, 2021 – 2031
5.7.1. Natural Resins
5.7.2. Synthetic Resins
5.8. Historical Market Size (US$ Mn) Analysis By Technology, 2016 – 2020
5.8.1. Affinity Chromatography
5.8.2. Anion Exchange Chromatography
5.8.3. Cation Exchange Chromatography
5.8.4. Size Exclusion Chromatography
5.8.5. Hydrophobic Interaction Chromatography
5.9. Market Size (US$ Mn) Forecast By Technology, 2021 – 2031
5.9.1. Affinity Chromatography
5.9.2. Anion Exchange Chromatography
5.9.3. Cation Exchange Chromatography
5.9.4. Size Exclusion Chromatography
5.9.5. Hydrophobic Interaction Chromatography
5.10. Historical Market Size (US$ Mn) Analysis By End Users, 2016 – 2020
5.10.1. Biopharmaceutical Companies
5.10.2. Clinical Research Organizations
5.10.3. Academic Institutes
5.11. Market Size (US$ Mn) Forecast By End Users, 2021 – 2031
5.11.1. Biopharmaceutical Companies
5.11.2. Clinical Research Organizations
5.11.3. Academic Institutes
5.12. Drivers and Restraints: Impact Analysis
5.13. Market Attractiveness Analysis
5.13.1. By Country
5.13.2. By Product Type
5.13.3. By Technology
5.13.4. By End Users
5.14. Key Representative Market Participants
5.15. Key Participants Market Presence (Intensity Map)
6. Eastern Europe Chromatography Resin Market Analysis 2016 – 2020 and Forecast 2021 – 2031
6.1. Introduction
6.2. Key Regulations
6.3. Regional Market Dynamics
6.3.1. Drivers
6.3.2. Restraints
6.3.3. Trends
6.4. Historical Market Size (US$ Mn) Analysis By Country, 2016 – 2020
6.4.1. Russia
6.4.2. Poland
6.4.3. Rest of Eastern Europe
6.5. Market Size (US$ Mn) Forecast By Country, 2021 – 2031
6.5.1. Russia
6.5.2. Poland
6.5.3. Rest of Eastern Europe
6.6. Historical Market Size (US$ Mn) Analysis By Product Type, 2016 – 2020
6.6.1. Natural Resins
6.6.2. Synthetic Resins
6.7. Market Size (US$ Mn) Forecast By Product Type, 2021 – 2031
6.7.1. Natural Resins
6.7.2. Synthetic Resins
6.8. Historical Market Size (US$ Mn) Analysis By Technology, 2016 – 2020
6.8.1. Affinity Chromatography
6.8.2. Anion Exchange Chromatography
6.8.3. Cation Exchange Chromatography
6.8.4. Size Exclusion Chromatography
6.8.5. Hydrophobic Interaction Chromatography
6.9. Market Size (US$ Mn) Forecast By Technology, 2021 – 2031
6.9.1. Affinity Chromatography
6.9.2. Anion Exchange Chromatography
6.9.3. Cation Exchange Chromatography
6.9.4. Size Exclusion Chromatography
6.9.5. Hydrophobic Interaction Chromatography
6.10. Historical Market Size (US$ Mn) Analysis By End Users, 2016 – 2020
6.10.1. Biopharmaceutical Companies
6.10.2. Clinical Research Organizations
6.10.3. Academic Institutes
6.11. Market Size (US$ Mn) Forecast By End Users, 2021 – 2031
6.11.1. Biopharmaceutical Companies
6.11.2. Clinical Research Organizations
6.11.3. Academic Institutes
6.12. Drivers and Restraints: Impact Analysis
6.13. Market Attractiveness Analysis
6.13.1. By Country
6.13.2. By Product Type
6.13.3. By Technology
6.13.4. By End Users
6.14. Key Representative Market Participants
6.15. Key Participants Market Presence (Intensity Map)
7. Latin America Chromatography Resin Market Analysis 2016 – 2020 and Forecast 2021 – 2031
7.1. Introduction
7.2. Key Regulations
7.3. Regional Market Dynamics
7.3.1. Drivers
7.3.2. Restraints
7.3.3. Trends
7.4. Historical Market Size (US$ Mn) Analysis By Country, 2016 – 2020
7.4.1. Brazil
7.4.2. Mexico
7.4.3. Rest of Latin America
7.5. Market Size (US$ Mn) Forecast By Country, 2021 – 2031
7.5.1. Brazil
7.5.2. Mexico
7.5.3. Rest of Latin America
7.6. Historical Market Size (US$ Mn) Analysis By Product Type, 2016 – 2020
7.6.1. Natural Resins
7.6.2. Synthetic Resins
7.7. Market Size (US$ Mn) Forecast By Product Type, 2021 – 2031
7.7.1. Natural Resins
7.7.2. Synthetic Resins
7.8. Historical Market Size (US$ Mn) Analysis By Technology, 2016 – 2020
7.8.1. Affinity Chromatography
7.8.2. Anion Exchange Chromatography
7.8.3. Cation Exchange Chromatography
7.8.4. Size Exclusion Chromatography
7.8.5. Hydrophobic Interaction Chromatography
7.9. Market Size (US$ Mn) Forecast By Technology, 2021 – 2031
7.9.1. Affinity Chromatography
7.9.2. Anion Exchange Chromatography
7.9.3. Cation Exchange Chromatography
7.9.4. Size Exclusion Chromatography
7.9.5. Hydrophobic Interaction Chromatography
7.10. Historical Market Size (US$ Mn) Analysis By End Users, 2016 – 2020
7.10.1. Biopharmaceutical Companies
7.10.2. Clinical Research Organizations
7.10.3. Academic Institutes
7.11. Market Size (US$ Mn) Forecast By End Users, 2021 – 2031
7.11.1. Biopharmaceutical Companies
7.11.2. Clinical Research Organizations
7.11.3. Academic Institutes
7.12. Drivers and Restraints: Impact Analysis
7.13. Market Attractiveness Analysis
7.13.1. By Country
7.13.2. By Product Type
7.13.3. By Technology
7.13.4. By End Users
7.14. Key Representative Market Participants
7.15. Key Participants Market Presence (Intensity Map)
8. Asia Pacific Excluding Japan Chromatography Resin Market Analysis 2016 – 2020 and Forecast 2021 – 2031
8.1. Introduction
8.2. Key Regulations
8.3. Regional Market Dynamics
8.3.1. Drivers
8.3.2. Restraints
8.3.3. Trends
8.4. Historical Market Size (US$ Mn) Analysis By Country, 2016 – 2020
8.4.1. China
8.4.2. India
8.4.3. Australia and New Zealand
8.4.4. ASEAN
8.4.5. Rest of APEJ
8.5. Market Size (US$ Mn) Forecast By Country, 2021 – 2031
8.5.1. China
8.5.2. India
8.5.3. Australia and New Zealand
8.5.4. ASEAN
8.5.5. Rest of APEJ
8.6. Historical Market Size (US$ Mn) Analysis By Product Type, 2016 – 2020
8.6.1. Natural Resins
8.6.2. Synthetic Resins
8.7. Market Size (US$ Mn) Forecast By Product Type, 2021 – 2031
8.7.1. Natural Resins
8.7.2. Synthetic Resins
8.8. Historical Market Size (US$ Mn) Analysis By Technology, 2016 – 2020
8.8.1. Affinity Chromatography
8.8.2. Anion Exchange Chromatography
8.8.3. Cation Exchange Chromatography
8.8.4. Size Exclusion Chromatography
8.8.5. Hydrophobic Interaction Chromatography
8.9. Market Size (US$ Mn) Forecast By Technology, 2021 – 2031
8.9.1. Affinity Chromatography
8.9.2. Anion Exchange Chromatography
8.9.3. Cation Exchange Chromatography
8.9.4. Size Exclusion Chromatography
8.9.5. Hydrophobic Interaction Chromatography
8.10. Historical Market Size (US$ Mn) Analysis By End Users, 2016 – 2020
8.10.1. Biopharmaceutical Companies
8.10.2. Clinical Research Organizations
8.10.3. Academic Institutes
8.11. Market Size (US$ Mn) Forecast By End Users, 2021 – 2031
8.11.1. Biopharmaceutical Companies
8.11.2. Clinical Research Organizations
8.11.3. Academic Institutes
8.12. Drivers and Restraints: Impact Analysis
8.13. Market Attractiveness Analysis
8.13.1. By Country
8.13.2. By Product Type
8.13.3. By Technology
8.13.4. By End Users
8.14. Key Representative Market Participants
8.15. Key Participants Market Presence (Intensity Map)
9. Japan Chromatography Resin Market Analysis 2016 – 2020 and Forecast 2021 – 2031
9.1. Introduction
9.2. Key Regulations
9.3. Regional Market Dynamics
9.3.1. Drivers
9.3.2. Restraints
9.3.3. Trends
9.4. Historical Market Size (US$ Mn) Analysis By Product Type, 2016 – 2020
9.4.1. Natural Resins
9.4.2. Synthetic Resins
9.5. Market Size (US$ Mn) Forecast By Product Type, 2021 – 2031
9.5.1. Natural Resins
9.5.2. Synthetic Resins
9.6. Historical Market Size (US$ Mn) Analysis By Technology, 2016 – 2020
9.6.1. Affinity Chromatography
9.6.2. Anion Exchange Chromatography
9.6.3. Cation Exchange Chromatography
9.6.4. Size Exclusion Chromatography
9.6.5. Hydrophobic Interaction Chromatography
9.7. Market Size (US$ Mn) Forecast By Technology, 2021 – 2031
9.7.1. Affinity Chromatography
9.7.2. Anion Exchange Chromatography
9.7.3. Cation Exchange Chromatography
9.7.4. Size Exclusion Chromatography
9.7.5. Hydrophobic Interaction Chromatography
9.8. Historical Market Size (US$ Mn) Analysis By End Users, 2016 – 2020
9.8.1. Biopharmaceutical Companies
9.8.2. Clinical Research Organizations
9.8.3. Academic Institutes
9.9. Market Size (US$ Mn) Forecast By End Users, 2021 – 2031
9.9.1. Biopharmaceutical Companies
9.9.2. Clinical Research Organizations
9.9.3. Academic Institutes
9.10. Drivers and Restraints: Impact Analysis
9.11. Market Attractiveness Analysis
9.11.1. By Product Type
9.11.2. By Technology
9.11.3. By End Users
9.12. Key Representative Market Participants
9.13. Key Participants Market Presence (Intensity Map)
10. Middle East and Africa Chromatography Resin Market Analysis 2016 – 2020 and Forecast 2021 – 2031
10.1. Introduction
10.2. Key Regulations
10.3. Regional Market Dynamics
10.3.1. Drivers
10.3.2. Restraints
10.3.3. Trends
10.4. Historical Market Size (US$ Mn) Analysis By Country, 2016 – 2020
10.4.1. GCC Countries
10.4.2. South Africa
10.4.3. Rest of Middle East and Africa
10.5. Market Size (US$ Mn) Forecast By Country, 2021 – 2031
10.5.1. GCC Countries
10.5.2. South Africa
10.5.3. Rest of Middle East and Africa
10.6. Historical Market Size (US$ Mn) Analysis By Product Type, 2016 – 2020
10.6.1. Natural Resins
10.6.2. Synthetic Resins
10.7. Market Size (US$ Mn) Forecast By Product Type, 2021 – 2031
10.7.1. Natural Resins
10.7.2. Synthetic Resins
10.8. Historical Market Size (US$ Mn) Analysis By Technology, 2016 – 2020
10.8.1. Affinity Chromatography
10.8.2. Anion Exchange Chromatography
10.8.3. Cation Exchange Chromatography
10.8.4. Size Exclusion Chromatography
10.8.5. Hydrophobic Interaction Chromatography
10.9. Market Size (US$ Mn) Forecast By Technology, 2021 – 2031
10.9.1. Affinity Chromatography
10.9.2. Anion Exchange Chromatography
10.9.3. Cation Exchange Chromatography
10.9.4. Size Exclusion Chromatography
10.9.5. Hydrophobic Interaction Chromatography
10.10. Historical Market Size (US$ Mn) Analysis By End Users, 2016 – 2020
10.10.1. Biopharmaceutical Companies
10.10.2. Clinical Research Organizations
10.10.3. Academic Institutes
10.11. Market Size (US$ Mn) Forecast By End Users, 2021 – 2031
10.11.1. Biopharmaceutical Companies
10.11.2. Clinical Research Organizations
10.11.3. Academic Institutes
10.12. Drivers and Restraints: Impact Analysis
10.13. Market Attractiveness Analysis
10.13.1. By Country
10.13.2. By Product Type
10.13.3. By Technology
10.13.4. By End Users
10.14. Key Representative Market Participants
10.15. Key Participants Market Presence (Intensity Map)
11. Forecast Factors: Relevance and Impact
12. Forecast Assumptions
13. Competition Landscape
13.1. Market Structure
13.2. Competition Intensity Mapping By Market Taxonomy
13.3. Market Share Analysis (2016)
13.4. Competition Dashboard
13.5. Company Profiles (Details – Overview, Financials, Strategy, Recent Developments)
13.5.1. Agilent Technologies
13.5.1.1. Overview
13.5.1.2. Financials
13.5.1.3. Strategy
13.5.1.4. Recent Developments
13.5.2. Bio-Rad Laboratories, Inc.
13.5.2.1. Overview
13.5.2.2. Financials
13.5.2.3. Strategy
13.5.2.4. Recent Developments
13.5.3. GE Healthcare
13.5.3.1. Overview
13.5.3.2. Financials
13.5.3.3. Strategy
13.5.3.4. Recent Developments
13.5.4. Waters Corporation
13.5.4.1. Overview
13.5.4.2. Financials
13.5.4.3. Strategy
13.5.4.4. Recent Developments
13.5.5. Expedeon Ltd.
13.5.5.1. Overview
13.5.5.2. Financials
13.5.5.3. Strategy
13.5.5.4. Recent Developments
13.5.6. Thermo Fisher Scientific Inc.
13.5.6.1. Overview
13.5.6.2. Financials
13.5.6.3. Strategy
13.5.6.4. Recent Developments
13.5.7. Pall Corporation
13.5.7.1. Overview
13.5.7.2. Financials
13.5.7.3. Strategy
13.5.7.4. Recent Developments
13.5.8. Merck KGaA
13.5.8.1. Overview
13.5.8.2. Financials
13.5.8.3. Strategy
13.5.8.4. Recent Developments
13.5.9. PerkinElmer, Inc.
13.5.9.1. Overview
13.5.9.2. Financials
13.5.9.3. Strategy
13.5.9.4. Recent Developments
13.5.10. Kaneka Corporation
13.5.10.1. Overview
13.5.10.2. Financials
13.5.10.3. Strategy
13.5.10.4. Recent Developments
13.5.11. Shimadzu Corporation
13.5.11.1. Overview
13.5.11.2. Financials
13.5.11.3. Strategy
13.5.11.4. Recent Developments
13.5.12. Knauer GmbH
13.5.12.1. Overview
13.5.12.2. Financials
13.5.12.3. Strategy
13.5.12.4. Recent Developments
13.5.13. Tosoh Bioscience
13.5.13.1. Overview
13.5.13.2. Financials
13.5.13.3. Strategy
13.5.13.4. Recent Developments
13.5.14. Avantor Performance Materials Inc.
13.5.14.1. Overview
13.5.14.2. Financials
13.5.14.3. Strategy
13.5.14.4. Recent Developments
13.5.15. Mitsubishi Chemical Corporation
13.5.15.1. Overview
13.5.15.2. Financials
13.5.15.3. Strategy
13.5.15.4. Recent Developments
13.5.16. W.R. Grace & Co.
13.5.16.1. Overview
13.5.16.2. Financials
13.5.16.3. Strategy
13.5.16.4. Recent Developments
13.5.17. JSR Micro Inc.
13.5.17.1. Overview
13.5.17.2. Financials
13.5.17.3. Strategy
13.5.17.4. Recent Developments
13.5.18. Life Technology Corporation
13.5.18.1. Overview
13.5.18.2. Financials
13.5.18.3. Strategy
13.5.18.4. Recent Developments
14. Global Chromatography Resin Market Analysis 2016 – 2020 and Forecast 2021 – 2031 By Region
14.1. Introduction / Key Findings
14.2. Historical Market Size (US$ Mn) Analysis By Region
14.2.1. North America
14.2.2. Western Europe
14.2.3. Eastern Europe
14.2.4. Latin America
14.2.5. Asia Pacific Excluding Japan
14.2.6. Japan
14.2.7. Middle East and Africa
14.3. Market Size (US$ Mn) Forecast By Region
14.3.1. North America
14.3.2. Western Europe
14.3.3. Eastern Europe
14.3.4. Latin America
14.3.5. Asia Pacific Excluding Japan
14.3.6. Japan
14.3.7. Middle East and Africa
14.4. Market Attractiveness Analysis By Region
15. Global Chromatography Resin Market Analysis 2016 – 2020 and Forecast 2021 – 2031, By Product Type
15.1. Introduction/Key Finding
15.2. Historical Market Size (US$ Mn) Analysis By Product Type, 2016 – 2020
15.2.1. Natural Resins
15.2.2. Synthetic Resins
15.3. Market Size (US$ Mn) Forecast By Product Type, 2021 – 2031
15.3.1. Natural Resins
15.3.2. Synthetic Resins
15.4. Market Attractiveness Analysis By Product Type
16. Global Chromatography Resin Market Analysis 2016 – 2020 and Forecast 2021 – 2031, By Technology
16.1. Introduction/Key Finding
16.2. Historical Market Size (US$ Mn) Analysis By Technology, 2016 – 2020
16.2.1. Affinity Chromatography
16.2.2. Anion Exchange Chromatography
16.2.3. Cation Exchange Chromatography
16.2.4. Size Exclusion Chromatography
16.2.5. Hydrophobic Interaction Chromatography
16.3. Market Size (US$ Mn) Forecast By Technology, 2021 – 2031
16.3.1. Affinity Chromatography
16.3.2. Anion Exchange Chromatography
16.3.3. Cation Exchange Chromatography
16.3.4. Size Exclusion Chromatography
16.3.5. Hydrophobic Interaction Chromatography
16.4. Market Attractiveness Analysis By Technology
17. Global Chromatography Resin Market Analysis 2016 – 2020 and Forecast 2021 – 2031, By End Users
17.1. Introduction/Key Finding
17.2. Historical Market Size (US$ Mn) Analysis By End Users, 2016 – 2020
17.2.1. Biopharmaceutical Companies
17.2.2. Clinical Research Organizations
17.2.3. Academic Institutes
17.3. Market Size (US$ Mn) Forecast By End Users, 2021 – 2031
17.3.1. Biopharmaceutical Companies
17.3.2. Clinical Research Organizations
17.3.3. Academic Institutes
17.4. Market Attractiveness Analysis By End Users
18. Global Chromatography Resin Market Analysis 2016 – 2020 and Forecast 2021 – 2031
18.1. Market Size and Y-o-Y Growth
18.2. Absolute $ Opportunity
18.3. Value Chain
19. Assumptions and Acronyms Used and Research Methodology
Let us know your requirement to get
100% FREE customization
List of Tables
Table 01: North America Chromatography Resins Market size (US$ Mn) Analysis-2016 – 2020 and Forecast 2021 – 2031, By Country
Table 02: North America Chromatography Resins Market size (US$ Mn) Analysis-2016 – 2020 and Forecast 2021 – 2031, By Product Type
Table 03: North America Chromatography Resins Market size (US$ Mn) Analysis-2016 – 2020 and Forecast 2021 – 2031, By Technology
Table 04: North America Chromatography Resins Market size (US$ Mn) Analysis-2016 – 2020 and Forecast 2021 – 2031, By End User
Table 05: Western Europe Chromatography Resins Market size (US$ Mn) Analysis-2016 – 2020 and Forecast 2021 – 2031, By Country
Table 06: Western Europe Chromatography Resins Market size (US$ Mn) Analysis-2016 – 2020 and Forecast 2021 – 2031, By Product Type
Table 07: Western Europe Chromatography Resins Market size (US$ Mn) Analysis-2016 – 2020 and Forecast 2021 – 2031, By Technology
Table 08: Western Europe Chromatography Resins Market size (US$ Mn) Analysis-2016 – 2020 and Forecast 2021 – 2031, By End User
Table 09: Eastern Europe Chromatography Resins Market size (US$ Mn) Analysis-2016 – 2020 and Forecast 2021 – 2031, By Country
Table 10: Eastern Europe Chromatography Resins Market size (US$ Mn) Analysis-2016 – 2020 and Forecast 2021 – 2031, By Product Type
Table 11: Eastern Europe Market size (US$ Mn) Analysis-2016 – 2020 and Forecast 2021 – 2031, By Technology
Table 12: Eastern Europe Market size (US$ Mn) Analysis-2016 – 2020 and Forecast 2021 – 2031, By End User
Table 13: Latin America Chromatography Resins Market size (US$ Mn) Analysis-2016 – 2020 and Forecast 2021 – 2031, By Country
Table 14: Latin America Chromatography Resins Market size (US$ Mn) Analysis-2016 – 2020 and Forecast 2021 – 2031, By Product Type
Table 15: Latin America Chromatography Resins Market size (US$ Mn) Analysis-2016 – 2020 and Forecast 2021 – 2031, By Technology
Table 16: Latin America Chromatography Resins Market size (US$ Mn) Analysis-2016 – 2020 and Forecast 2021 – 2031, By End User
Table 17: APEJ Chromatography Resins Market size (US$ Mn) Analysis-2016 – 2020 and Forecast 2021 – 2031, By Country
Table 18: APEJ Chromatography Resins Market size (US$ Mn) Analysis-2016 – 2020 and Forecast 2021 – 2031, By Product Type
Table 19: APEJ Chromatography Resins Market size (US$ Mn) Analysis-2016 – 2020 and Forecast 2021 – 2031, By Technology
Table 20: APEJ Chromatography Resins Market size (US$ Mn) Analysis-2016 – 2020 and Forecast 2021 – 2031, By End User
Table 21: Japan Chromatography Resins Market size (US$ Mn) Analysis-2016 – 2020 and Forecast 2021 – 2031, By Product Type
Table 22: Japan Chromatography Resins Market size (US$ Mn) Analysis-2016 – 2020 and Forecast 2021 – 2031, By Technology
Table 23: Japan Chromatography Resins Market size (US$ Mn) Analysis-2016 – 2020 and Forecast 2021 – 2031, By End User
Table 24: MEA Chromatography Resins Market size (US$ Mn) Analysis-2016 – 2020 and Forecast 2021 – 2031, By Country
Table 25: MEA Chromatography Resins Market size (US$ Mn) Analysis-2016 – 2020 and Forecast 2021 – 2031, By Product Type
Table 26: MEA Market size (US$ Mn) Analysis-2016 – 2020 and Forecast 2021 – 2031, By Technology
Table 27: MEA Market size (US$ Mn) Analysis-2016 – 2020 and Forecast 2021 – 2031, By End User
Table 28: Global Chromatography Resins Market Size (US$ Mn) Forecast By Region, 2016-2020
Table 29: Global Chromatography Resins Market Size (US$ Mn) Forecast By Product Type, 2016-2020
Table 30: Global Chromatography Resins Market Size (US$ Mn) Forecast By Technology, 2016-2020
Table 31: Global Chromatography Resins Market Size (US$ Mn) Forecast By End User, 2016-2020
Find your sweet spots for generating winning opportunities in this market.
Talk to AnalystList of Charts
Figure 01: North America Chromatography Resins Market Share Analysis (%) By Country, 2021 – 2031
Figure 02: North America Chromatography Resins Market Y-o-Y Growth (%) By Country, 2021 – 2031
Figure 03: North America Chromatography Resins Market Size Analysis, 2016 – 2020
Figure 04: North America Chromatography Resins Market Forecast, 2021 – 2031
Figure 05: North America Chromatography Resins Market Attractiveness Analysis, 2021 – 2031, by Country
Figure 06: North America Chromatography Resins Market Attractiveness Analysis, 2021 – 2031, by Product Type
Figure 07: North America Chromatography Resins Market Attractiveness Analysis, 2021 – 2031, by Technology
Figure 08: North America Chromatography Resins Market Attractiveness Analysis, 2021 – 2031, by End User
Figure 09: Western Europe Chromatography Resins Market Share Analysis (%) By Country, 2021 – 2031
Figure 10: Western Europe Chromatography Resins Market Y-o-Y Growth (%) By Country, 2021 – 2031
Figure 11: Western Europe Chromatography Resins Market Size Analysis, 2016 – 2020
Figure 12: Western Europe Chromatography Resins Market Forecast, 2021 – 2031
Figure 13: Western Europe Chromatography Resins Market Attractiveness Analysis, 2021 – 2031, by Country
Figure 14: Western Europe Chromatography Resins Market Attractiveness Analysis, 2021 – 2031, by Product Type
Figure 15: Western Europe Chromatography Resins Market Attractiveness Analysis, 2021 – 2031, by Technology
Figure 16: Western Europe Chromatography Resins Market Attractiveness Analysis, 2021 – 2031, by End User
Figure 17: Eastern Europe Chromatography Resins Market Share Analysis (%) By Country, 2021 – 2031
Figure 18: Eastern Europe Chromatography Resins Market Y-o-Y Growth (%) By Country, 2021 – 2031
Figure 19: Eastern Europe Chromatography Resins Market Size Analysis, 2016 – 2020
Figure 20: Eastern Europe Chromatography Resins Market Forecast, 2021 – 2031
Figure 21: Eastern Europe Chromatography Resins Market Attractiveness Analysis, 2021 – 2031, by Country
Figure 22: Eastern Europe Chromatography Resins Market Attractiveness Analysis, 2021 – 2031, by Product Type
Figure 23: Eastern Europe Chromatography Resins Market Attractiveness Analysis, 2021 – 2031, by Technology
Figure 24: Eastern Europe Chromatography Resins Market Attractiveness Analysis, 2021 – 2031, by End User
Figure 25: Latin America Chromatography Resins Market Share Analysis (%) By Country, 2021 – 2031
Figure 26: Latin America Chromatography Resins Market Y-o-Y Growth (%) By Country, 2021 – 2031
Figure 27: Latin America Chromatography Resins Market Size Analysis, 2016 – 2020
Figure 28: Latin America Chromatography Resins Market Forecast, 2021 – 2031
Figure 29: Latin America Chromatography Resins Market Attractiveness Analysis, 2021 – 2031, by Country
Figure 30: Latin America Chromatography Resins Market Attractiveness Analysis, 2021 – 2031, by Product Type
Figure 31: Latin America Chromatography Resins Market Attractiveness Analysis, 2021 – 2031, by Technology
Figure 32: Latin America Chromatography Resins Market Attractiveness Analysis, 2021 – 2031, by End User
Figure 33: APEJ Chromatography Resins Market Share Analysis (%) By Country, 2021 – 2031
Figure 34: APEJ Chromatography Resins Market Y-o-Y Growth (%) By Country, 2021 – 2031
Figure 35: APEJ Chromatography Resins Market Size Analysis, 2016 – 2020
Figure 36: APEJ Chromatography Resins Market Forecast, 2021 – 2031
Figure 37: APEJ Chromatography Resins Market Attractiveness Analysis, 2021 – 2031, by Country
Figure 38: APEJ Chromatography Resins Market Attractiveness Analysis, 2021 – 2031, by Product Type
Figure 39: APEJ Chromatography Resins Market Attractiveness Analysis, 2021 – 2031, by Technology
Figure 40: APEJ Chromatography Resins Market Attractiveness Analysis, 2021 – 2031, by End User
Figure 41: Japan Chromatography Resins Market Size Analysis, 2016 – 2020
Figure 42: Japan Chromatography Resins Market Forecast, 2021 – 2031
Figure 43: Japan Chromatography Resins Market Attractiveness Analysis, 2021 – 2031, by Product Type
Figure 44: Japan Chromatography Resins Market Attractiveness Analysis, 2021 – 2031, by Technology
Figure 45: Japan Chromatography Resins Market Attractiveness Analysis, 2021 – 2031, by End User
Figure 46: MEA Chromatography Resins Market Share Analysis (%) By Country, 2021 – 2031
Figure 47: MEA Chromatography Resins Market Y-o-Y Growth (%) By Country, 2021 – 2031
Figure 48: MEA Chromatography Resins Market Size Analysis, 2016 – 2020
Figure 49: MEA Chromatography Resins Market Forecast, 2021 – 2031
Figure 50: MEA Chromatography Resins Market Attractiveness Analysis, 2021 – 2031, by Country
Figure 51: MEA Chromatography Resins Market Attractiveness Analysis, 2021 – 2031, by Product Type
Figure 52: MEA Chromatography Resins Market Attractiveness Analysis, 2021 – 2031, by Technology
Figure 53: MEA Chromatography Resins Market Attractiveness Analysis, 2021 – 2031, by End User
Figure 54: Global Chromatography Resins Market Attractiveness Analysis By Region, 2021 – 2031
Figure 55: Global Chromatography Resins Market Attractiveness Analysis By Product Type, 2021 – 2031
Figure 56: Global Chromatography Resins Market Attractiveness Analysis By Technology, 2021 – 2031
Figure 57: Global Chromatography Resins Market Attractiveness Analysis By End User, 2021 – 2031
Figure 58: Global Chromatography Resins Market Value Analysis and Forecast, 2021 – 2031 (US$ Mn)
Figure 59: Global Chromatography Resins Market Absolute $ Opportunity (US$ Mn), 2016 – 2020
Figure 60: Global Chromatography Resins Market Absolute $ Opportunity (US$ Mn), 2021 – 2031
Need specific information?
Request CustomizationExplore Healthcare Insights
View Reports