Resin Capsule Market Size and Share Forecast Outlook From 2024 to 2034

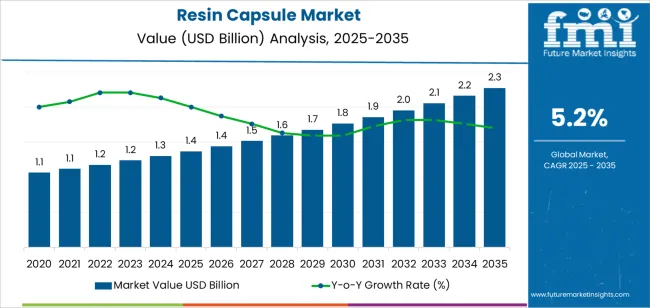
The Resin Capsule Market is estimated at USD 1.3 billion by 2024. The market valuation is expected to be USD 2.1 billion by 2034, registering a moderate CAGR of 5.2%.

The market is focused on providing solutions for anchoring and reinforcement in the construction, mining, and tunneling industries. Resin capsules are pre-measured quantities of resin housed in a sealed container, designed to be inserted into drill holes where they then cure to create a strong bond with surrounding materials.

The capsules offer advantages such as quick installation, high load-bearing capacity, and resistance to various environmental conditions. They are widely utilized for securing bolts, anchors, and other structural elements in challenging terrains and conditions.

The growing demand for infrastructure development projects globally drives the market, particularly in regions with extensive mining and construction activities. Key players in the market continuously innovate to enhance product performance, safety, and environmental sustainability, ensuring a competitive landscape for resin capsule solutions.

Attributes Key Insights
Market Estimated Size in 2024 USD 1.3 billion
Projected Market Size in 2034 USD 2.1 billion
Value-based CAGR from 2024 to 2034 5.2%

Comparison of Historical vs Future Outlook on Changing Consumer Trends for Resin Capsule Industry

The scope for global resin capsule market insights expanded at a 7.2% CAGR between 2019 and 2023. The market is anticipated to develop at a CAGR of 5.2% over the forecast period from 2024 to 2034.

Historical CAGR from 2019 to 2023 7.2%
Forecast CAGR from 2024 to 2034 5.2%

Between 2019 and 2023, the global market experienced significant growth, with a CAGR of 7.2%. This growth was attributed to increasing infrastructure projects worldwide, particularly in the construction, mining, and tunneling sectors.

From 2024 to 2034, the market is projected to grow slightly slower, with a CAGR of 5.2%. Despite this deceleration, the market is expected to continue expanding due to infrastructure developments and the demand for reliable anchoring and reinforcement solutions.

Factors influencing this growth include technological advancements, environmental regulations, and the emergence of new applications for resin capsules.

Factors Restraining the Demand for Resin Capsules

Attributes Details
Restraints
  • Adhering to evolving environmental and safety regulations poses challenges for manufacturers.
  • Intense competition among market players necessitates continuous innovation and differentiation.
  • Fluctuations in raw material costs can impact profit margins and pricing strategies.
  • Keeping pace with rapid technological changes requires significant investment in research and development.

Analysis of Top Countries, Producing, Certifying, and Distributing Resin Capsules

The table highlights the CAGRs across five crucial countries, the United States, Japan, China, the United Kingdom, and South Korea. Japan emerges as a vibrant market poised for remarkable growth, projected to achieve a 6.5% CAGR by 2034.

Renowned for its commitment to innovation, Japan is a pivotal player across diverse industries, boasting a flourishing economic landscape characterized by ongoing advancement.

The substantial CAGR highlights a proactive stance in embracing and propelling advancements within the market, cementing its role as a significant contributor to the global industry. This underscores the dedication to sustainable practices, positioning it as a noteworthy force driving positive developments within the resin capsule sector on a global scale.

Countries CAGRs from 2024 to 2034
The United States 5.3%
Japan 6.5%
China 6.1%
The United Kingdom 5.7%
South Korea 6.3%

Anchoring Solutions for Construction and Mining Industries in the United States

Resin capsules are extensively used in the United States due to the vast construction industry, which demands reliable anchoring and reinforcement solutions for infrastructure projects such as bridges, highways, and buildings.

The mining sector in the United States relies on resin capsules for securing bolts and anchors in underground operations, further driving market demand.

Resin Capsules for Seismic Stability and Mining Operations Drive the Market in Japan

The dedication to innovation and technological advancement fuels a robust market for resin capsules in Japan. With a strong focus on infrastructure development and earthquake-resistant construction, resin capsules are vital in securing structures and ensuring their stability in seismic-prone regions.

The thriving mining industry also contributes to the significant usage of resin capsules in underground operations.

Resin Capsules Integral to Construction and Mining Projects Boosts the Market in China

The market in China experiences high demand due to the rapid urbanization and extensive construction activities. Resin capsules are widely used in the construction sector to anchor and reinforce structures, including high-rise buildings, bridges, and tunnels.

The flourishing mining industry relies on resin capsules for rock reinforcement and ground support in underground mines.

Focus on Sustainable Development Fuels the United Kingdom Market

In the United Kingdom, resin capsules are predominantly used in construction and infrastructure. Focusing on sustainable development and infrastructure modernization projects, resin capsules ensure the structural integrity and safety of buildings, bridges, and tunnels.

The mining industry in the United Kingdom utilizes resin capsules for ground stabilization and reinforcement in underground operations.

Advanced Technology and Innovation Surges the Market in South Korea

The market benefits from the thriving construction industry and focuses on infrastructure development. Resin capsules are extensively used in South Korea for securing anchors and bolts in construction projects and for rock reinforcement and ground support in mining operations.

Investing in advanced technology and innovation further drives the adoption of resin capsules in various applications.

Resin Capsule Industry Analysis by Top Investment Segments

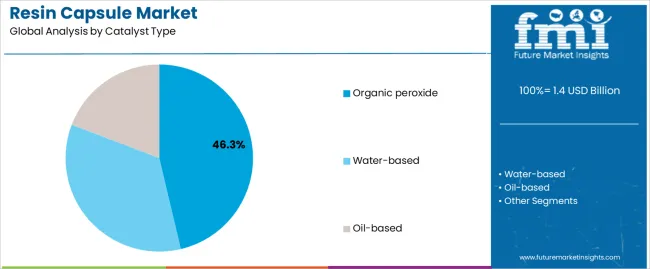
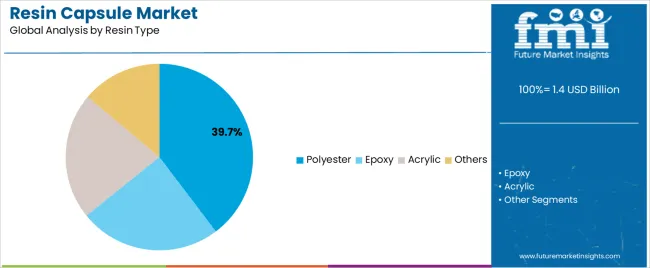
The table below overviews the resin capsule landscape based on catalyst type and resin type. Organic peroxide is projected to lead the catalyst type market at a 5.1% CAGR by 2034, while polyester in the resin type category is likely to expand at a CAGR of 5% by 2034.

Organic peroxides serve as catalysts in various chemical processes, driving demand from industries such as polymer manufacturing, plastics, and rubber. The versatility of polyester drives demand for polyester resins, positioning them as the leading category in the resin type market.

Category CAGRs from 2024 to 2034
Organic Peroxide 5.1%
Polyester 5%

Organic Peroxide Holds a Dominant Position in the Market

Organic peroxide emerges as the frontrunner in the catalyst type segment, expected to achieve a solid 5.1% CAGR by 2034. This projection reflects the increasing demand for organic peroxides as catalysts in various industrial processes, particularly in polymer manufacturing, plastics, and rubber industries.

Organic peroxides are crucial in initiating and accelerating chemical reactions, making them indispensable components in producing resin capsules and other related products.

Polyester Emerge as a Significant Segment in the Market

Polyester resin stands out in the resin type category, poised to expand at a CAGR of 5% by 2034. The versatility and wide-ranging applications across the automotive, construction, and electronics industries contribute to its steady growth trajectory.

With attributes like high strength, durability, and corrosion resistance, polyester resin finds extensive use in manufacturing fiberglass, coatings, laminates, and, notably, resin capsules. This sustained demand for polyester resin underscores its significance in shaping the market landscape over the forecast period.
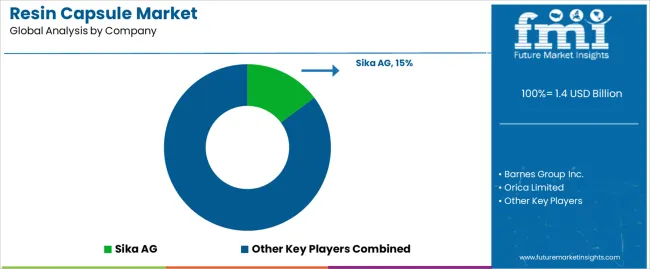
Leading Suppliers of Resin Capsules

The competitive landscape is characterized by intense rivalry among key players striving to gain a significant market share. Companies engage in strategies such as product innovation, strategic partnerships, mergers, and acquisitions to strengthen their foothold in the market.

Manufacturers focus on expanding their geographical presence to tap into emerging markets with increasing infrastructure development activities. Moreover, competitive pricing strategies and quality assurance measures are crucial in differentiating products and attracting customers.

Key Market Developments

  • In October 2019, Arkema SA acquired Lambson and Prochimir, specializing in photoinitiators for photo cure resins. The acquisition is expected to enhance Arkema's presence in the specialties sector, diversifying its portfolio and strengthening its position in the market.
  • In May 2019, Sika AG inaugurated a new manufacturing plant in Doha, Qatar, to produce Concrete Admixtures. Qatar was chosen as the location for the plant due to its significant number of planned and ongoing large-scale infrastructure projects and investments.

Key Shifting Preferences Covered in Resin Capsule Market Report

Attributes Details
Estimated Market Size in 2024 USD 1.3 billion
Projected Market Valuation in 2034 USD 2.1 billion
CAGR Share from 2024 to 2034 5.2%
Forecast Period 2024 to 2034
Historical Data Available for 2019 to 2023
Market Analysis Value in USD billion
Key Regions Covered North America; Latin America; Western Europe; Eastern Europe; South Asia and Pacific; East Asia; Middle East and Africa
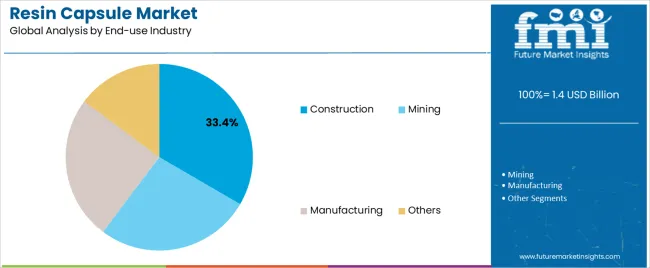
Key Market Segments Covered By Catalyst Type, By Resin Type, By End-use Industry, By Region
Key Countries Profiled United States, Canada, Brazil, Mexico, Germany, United Kingdom, France, Spain, Italy, Poland, Russia, Czech Republic, Romania, India, Bangladesh, Australia, New Zealand, China, Japan, South Korea, GCC Countries, South Africa, Israel
Key Companies Profiled Sika AG; Barnes Group Inc.; Orica Limited; DYWIDAG-Systems International; Bohle AG; Rawlplug; Sormat OY; Arkema SA; Fischer Holding GmbH & CO.; Hexion Inc.; Koelner Rawlplug IP

Top Segments Studied in the Resin Capsule Market

By Catalyst Type:

  • Organic peroxide
  • Water-based
  • Oil-based

By Resin Type:

  • Polyester
  • Epoxy
  • Acrylic
  • Others

By End-use Industry:

  • Construction
  • Mining
  • Manufacturing
  • Others

By Region:

  • North America
  • Latin America
  • Western Europe
  • Eastern Europe
  • South Asia and Pacific
  • East Asia
  • Middle East and Africa

Table of Content

  • 1. Executive Summary
  • 2. Market Overview
  • 3. Market Background
  • 4. Global Market Analysis 2019 to 2023 and Forecast, 2024 to 2034
  • 5. Global Market Analysis 2019 to 2023 and Forecast 2024 to 2034, By Catalyst Type
    • 5.1. Organic peroxide
    • 5.2. Water-based
    • 5.3. Oil-based
  • 6. Global Market Analysis 2019 to 2023 and Forecast 2024 to 2034, By Resin Type
    • 6.1. Polyester
    • 6.2. Epoxy
    • 6.3. Acrylic
    • 6.4. Others
  • 7. Global Market Analysis 2019 to 2023 and Forecast 2024 to 2034, By End-use Industry
    • 7.1. Construction
    • 7.2. Mining
    • 7.3. Manufacturing
    • 7.4. Others
  • 8. Global Market Analysis 2019 to 2023 and Forecast 2024 to 2034, By Region
    • 8.1. North America
    • 8.2. Latin America
    • 8.3. Western Europe
    • 8.4. Eastern Europe
    • 8.5. South Asia and Pacific
    • 8.6. East Asia
    • 8.7. Middle East and Africa
  • 9. North America Market Analysis 2019 to 2023 and Forecast 2024 to 2034, By Country
  • 10. Latin America Market Analysis 2019 to 2023 and Forecast 2024 to 2034, By Country
  • 11. Western Europe Market Analysis 2019 to 2023 and Forecast 2024 to 2034, By Country
  • 12. Eastern Europe Market Analysis 2019 to 2023 and Forecast 2024 to 2034, By Country
  • 13. South Asia and Pacific Market Analysis 2019 to 2023 and Forecast 2024 to 2034, By Country
  • 14. East Asia Market Analysis 2019 to 2023 and Forecast 2024 to 2034, By Country
  • 15. Middle East and Africa Market Analysis 2019 to 2023 and Forecast 2024 to 2034, By Country
  • 16. Key Countries Market Analysis
  • 17. Market Structure Analysis
  • 18. Competition Analysis
    • 18.1. Sika AG
    • 18.2. Barnes Group Inc.
    • 18.3. Orica Limited
    • 18.4. DYWIDAG-Systems International
    • 18.5. Bohle AG
    • 18.6. Rawlplug
    • 18.7. Sormat OY
    • 18.8. Arkema SA
    • 18.9. Fischer Holding GmbH & CO.
    • 18.10. Hexion Inc.
    • 18.11. Koelner Rawlplug IP
  • 19. Assumptions & Acronyms Used
  • 20. Research Methodology

List of Tables

Table 1: Global Market Value (US$ Million) Forecast by Region, 2019 to 2034

Table 2: Global Market Volume (Units) Forecast by Region, 2019 to 2034

Table 3: Global Market Value (US$ Million) Forecast by Catalyst Type, 2019 to 2034

Table 4: Global Market Volume (Units) Forecast by Catalyst Type, 2019 to 2034

Table 5: Global Market Value (US$ Million) Forecast by Resin Type, 2019 to 2034

Table 6: Global Market Volume (Units) Forecast by Resin Type, 2019 to 2034

Table 7: Global Market Value (US$ Million) Forecast by End-use Industry, 2019 to 2034

Table 8: Global Market Volume (Units) Forecast by End-use Industry, 2019 to 2034

Table 9: North America Market Value (US$ Million) Forecast by Country, 2019 to 2034

Table 10: North America Market Volume (Units) Forecast by Country, 2019 to 2034

Table 11: North America Market Value (US$ Million) Forecast by Catalyst Type, 2019 to 2034

Table 12: North America Market Volume (Units) Forecast by Catalyst Type, 2019 to 2034

Table 13: North America Market Value (US$ Million) Forecast by Resin Type, 2019 to 2034

Table 14: North America Market Volume (Units) Forecast by Resin Type, 2019 to 2034

Table 15: North America Market Value (US$ Million) Forecast by End-use Industry, 2019 to 2034

Table 16: North America Market Volume (Units) Forecast by End-use Industry, 2019 to 2034

Table 17: Latin America Market Value (US$ Million) Forecast by Country, 2019 to 2034

Table 18: Latin America Market Volume (Units) Forecast by Country, 2019 to 2034

Table 19: Latin America Market Value (US$ Million) Forecast by Catalyst Type, 2019 to 2034

Table 20: Latin America Market Volume (Units) Forecast by Catalyst Type, 2019 to 2034

Table 21: Latin America Market Value (US$ Million) Forecast by Resin Type, 2019 to 2034

Table 22: Latin America Market Volume (Units) Forecast by Resin Type, 2019 to 2034

Table 23: Latin America Market Value (US$ Million) Forecast by End-use Industry, 2019 to 2034

Table 24: Latin America Market Volume (Units) Forecast by End-use Industry, 2019 to 2034

Table 25: Western Europe Market Value (US$ Million) Forecast by Country, 2019 to 2034

Table 26: Western Europe Market Volume (Units) Forecast by Country, 2019 to 2034

Table 27: Western Europe Market Value (US$ Million) Forecast by Catalyst Type, 2019 to 2034

Table 28: Western Europe Market Volume (Units) Forecast by Catalyst Type, 2019 to 2034

Table 29: Western Europe Market Value (US$ Million) Forecast by Resin Type, 2019 to 2034

Table 30: Western Europe Market Volume (Units) Forecast by Resin Type, 2019 to 2034

Table 31: Western Europe Market Value (US$ Million) Forecast by End-use Industry, 2019 to 2034

Table 32: Western Europe Market Volume (Units) Forecast by End-use Industry, 2019 to 2034

Table 33: Eastern Europe Market Value (US$ Million) Forecast by Country, 2019 to 2034

Table 34: Eastern Europe Market Volume (Units) Forecast by Country, 2019 to 2034

Table 35: Eastern Europe Market Value (US$ Million) Forecast by Catalyst Type, 2019 to 2034

Table 36: Eastern Europe Market Volume (Units) Forecast by Catalyst Type, 2019 to 2034

Table 37: Eastern Europe Market Value (US$ Million) Forecast by Resin Type, 2019 to 2034

Table 38: Eastern Europe Market Volume (Units) Forecast by Resin Type, 2019 to 2034

Table 39: Eastern Europe Market Value (US$ Million) Forecast by End-use Industry, 2019 to 2034

Table 40: Eastern Europe Market Volume (Units) Forecast by End-use Industry, 2019 to 2034

Table 41: South Asia and Pacific Market Value (US$ Million) Forecast by Country, 2019 to 2034

Table 42: South Asia and Pacific Market Volume (Units) Forecast by Country, 2019 to 2034

Table 43: South Asia and Pacific Market Value (US$ Million) Forecast by Catalyst Type, 2019 to 2034

Table 44: South Asia and Pacific Market Volume (Units) Forecast by Catalyst Type, 2019 to 2034

Table 45: South Asia and Pacific Market Value (US$ Million) Forecast by Resin Type, 2019 to 2034

Table 46: South Asia and Pacific Market Volume (Units) Forecast by Resin Type, 2019 to 2034

Table 47: South Asia and Pacific Market Value (US$ Million) Forecast by End-use Industry, 2019 to 2034

Table 48: South Asia and Pacific Market Volume (Units) Forecast by End-use Industry, 2019 to 2034

Table 49: East Asia Market Value (US$ Million) Forecast by Country, 2019 to 2034

Table 50: East Asia Market Volume (Units) Forecast by Country, 2019 to 2034

Table 51: East Asia Market Value (US$ Million) Forecast by Catalyst Type, 2019 to 2034

Table 52: East Asia Market Volume (Units) Forecast by Catalyst Type, 2019 to 2034

Table 53: East Asia Market Value (US$ Million) Forecast by Resin Type, 2019 to 2034

Table 54: East Asia Market Volume (Units) Forecast by Resin Type, 2019 to 2034

Table 55: East Asia Market Value (US$ Million) Forecast by End-use Industry, 2019 to 2034

Table 56: East Asia Market Volume (Units) Forecast by End-use Industry, 2019 to 2034

Table 57: Middle East and Africa Market Value (US$ Million) Forecast by Country, 2019 to 2034

Table 58: Middle East and Africa Market Volume (Units) Forecast by Country, 2019 to 2034

Table 59: Middle East and Africa Market Value (US$ Million) Forecast by Catalyst Type, 2019 to 2034

Table 60: Middle East and Africa Market Volume (Units) Forecast by Catalyst Type, 2019 to 2034

Table 61: Middle East and Africa Market Value (US$ Million) Forecast by Resin Type, 2019 to 2034

Table 62: Middle East and Africa Market Volume (Units) Forecast by Resin Type, 2019 to 2034

Table 63: Middle East and Africa Market Value (US$ Million) Forecast by End-use Industry, 2019 to 2034

Table 64: Middle East and Africa Market Volume (Units) Forecast by End-use Industry, 2019 to 2034

List of Figures

Figure 1: Global Market Value (US$ Million) by Catalyst Type, 2024 to 2034

Figure 2: Global Market Value (US$ Million) by Resin Type, 2024 to 2034

Figure 3: Global Market Value (US$ Million) by End-use Industry, 2024 to 2034

Figure 4: Global Market Value (US$ Million) by Region, 2024 to 2034

Figure 5: Global Market Value (US$ Million) Analysis by Region, 2019 to 2034

Figure 6: Global Market Volume (Units) Analysis by Region, 2019 to 2034

Figure 7: Global Market Value Share (%) and BPS Analysis by Region, 2024 to 2034

Figure 8: Global Market Y-o-Y Growth (%) Projections by Region, 2024 to 2034

Figure 9: Global Market Value (US$ Million) Analysis by Catalyst Type, 2019 to 2034

Figure 10: Global Market Volume (Units) Analysis by Catalyst Type, 2019 to 2034

Figure 11: Global Market Value Share (%) and BPS Analysis by Catalyst Type, 2024 to 2034

Figure 12: Global Market Y-o-Y Growth (%) Projections by Catalyst Type, 2024 to 2034

Figure 13: Global Market Value (US$ Million) Analysis by Resin Type, 2019 to 2034

Figure 14: Global Market Volume (Units) Analysis by Resin Type, 2019 to 2034

Figure 15: Global Market Value Share (%) and BPS Analysis by Resin Type, 2024 to 2034

Figure 16: Global Market Y-o-Y Growth (%) Projections by Resin Type, 2024 to 2034

Figure 17: Global Market Value (US$ Million) Analysis by End-use Industry, 2019 to 2034

Figure 18: Global Market Volume (Units) Analysis by End-use Industry, 2019 to 2034

Figure 19: Global Market Value Share (%) and BPS Analysis by End-use Industry, 2024 to 2034

Figure 20: Global Market Y-o-Y Growth (%) Projections by End-use Industry, 2024 to 2034

Figure 21: Global Market Attractiveness by Catalyst Type, 2024 to 2034

Figure 22: Global Market Attractiveness by Resin Type, 2024 to 2034

Figure 23: Global Market Attractiveness by End-use Industry, 2024 to 2034

Figure 24: Global Market Attractiveness by Region, 2024 to 2034

Figure 25: North America Market Value (US$ Million) by Catalyst Type, 2024 to 2034

Figure 26: North America Market Value (US$ Million) by Resin Type, 2024 to 2034

Figure 27: North America Market Value (US$ Million) by End-use Industry, 2024 to 2034

Figure 28: North America Market Value (US$ Million) by Country, 2024 to 2034

Figure 29: North America Market Value (US$ Million) Analysis by Country, 2019 to 2034

Figure 30: North America Market Volume (Units) Analysis by Country, 2019 to 2034

Figure 31: North America Market Value Share (%) and BPS Analysis by Country, 2024 to 2034

Figure 32: North America Market Y-o-Y Growth (%) Projections by Country, 2024 to 2034

Figure 33: North America Market Value (US$ Million) Analysis by Catalyst Type, 2019 to 2034

Figure 34: North America Market Volume (Units) Analysis by Catalyst Type, 2019 to 2034

Figure 35: North America Market Value Share (%) and BPS Analysis by Catalyst Type, 2024 to 2034

Figure 36: North America Market Y-o-Y Growth (%) Projections by Catalyst Type, 2024 to 2034

Figure 37: North America Market Value (US$ Million) Analysis by Resin Type, 2019 to 2034

Figure 38: North America Market Volume (Units) Analysis by Resin Type, 2019 to 2034

Figure 39: North America Market Value Share (%) and BPS Analysis by Resin Type, 2024 to 2034

Figure 40: North America Market Y-o-Y Growth (%) Projections by Resin Type, 2024 to 2034

Figure 41: North America Market Value (US$ Million) Analysis by End-use Industry, 2019 to 2034

Figure 42: North America Market Volume (Units) Analysis by End-use Industry, 2019 to 2034

Figure 43: North America Market Value Share (%) and BPS Analysis by End-use Industry, 2024 to 2034

Figure 44: North America Market Y-o-Y Growth (%) Projections by End-use Industry, 2024 to 2034

Figure 45: North America Market Attractiveness by Catalyst Type, 2024 to 2034

Figure 46: North America Market Attractiveness by Resin Type, 2024 to 2034

Figure 47: North America Market Attractiveness by End-use Industry, 2024 to 2034

Figure 48: North America Market Attractiveness by Country, 2024 to 2034

Figure 49: Latin America Market Value (US$ Million) by Catalyst Type, 2024 to 2034

Figure 50: Latin America Market Value (US$ Million) by Resin Type, 2024 to 2034

Figure 51: Latin America Market Value (US$ Million) by End-use Industry, 2024 to 2034

Figure 52: Latin America Market Value (US$ Million) by Country, 2024 to 2034

Figure 53: Latin America Market Value (US$ Million) Analysis by Country, 2019 to 2034

Figure 54: Latin America Market Volume (Units) Analysis by Country, 2019 to 2034

Figure 55: Latin America Market Value Share (%) and BPS Analysis by Country, 2024 to 2034

Figure 56: Latin America Market Y-o-Y Growth (%) Projections by Country, 2024 to 2034

Figure 57: Latin America Market Value (US$ Million) Analysis by Catalyst Type, 2019 to 2034

Figure 58: Latin America Market Volume (Units) Analysis by Catalyst Type, 2019 to 2034

Figure 59: Latin America Market Value Share (%) and BPS Analysis by Catalyst Type, 2024 to 2034

Figure 60: Latin America Market Y-o-Y Growth (%) Projections by Catalyst Type, 2024 to 2034

Figure 61: Latin America Market Value (US$ Million) Analysis by Resin Type, 2019 to 2034

Figure 62: Latin America Market Volume (Units) Analysis by Resin Type, 2019 to 2034

Figure 63: Latin America Market Value Share (%) and BPS Analysis by Resin Type, 2024 to 2034

Figure 64: Latin America Market Y-o-Y Growth (%) Projections by Resin Type, 2024 to 2034

Figure 65: Latin America Market Value (US$ Million) Analysis by End-use Industry, 2019 to 2034

Figure 66: Latin America Market Volume (Units) Analysis by End-use Industry, 2019 to 2034

Figure 67: Latin America Market Value Share (%) and BPS Analysis by End-use Industry, 2024 to 2034

Figure 68: Latin America Market Y-o-Y Growth (%) Projections by End-use Industry, 2024 to 2034

Figure 69: Latin America Market Attractiveness by Catalyst Type, 2024 to 2034

Figure 70: Latin America Market Attractiveness by Resin Type, 2024 to 2034

Figure 71: Latin America Market Attractiveness by End-use Industry, 2024 to 2034

Figure 72: Latin America Market Attractiveness by Country, 2024 to 2034

Figure 73: Western Europe Market Value (US$ Million) by Catalyst Type, 2024 to 2034

Figure 74: Western Europe Market Value (US$ Million) by Resin Type, 2024 to 2034

Figure 75: Western Europe Market Value (US$ Million) by End-use Industry, 2024 to 2034

Figure 76: Western Europe Market Value (US$ Million) by Country, 2024 to 2034

Figure 77: Western Europe Market Value (US$ Million) Analysis by Country, 2019 to 2034

Figure 78: Western Europe Market Volume (Units) Analysis by Country, 2019 to 2034

Figure 79: Western Europe Market Value Share (%) and BPS Analysis by Country, 2024 to 2034

Figure 80: Western Europe Market Y-o-Y Growth (%) Projections by Country, 2024 to 2034

Figure 81: Western Europe Market Value (US$ Million) Analysis by Catalyst Type, 2019 to 2034

Figure 82: Western Europe Market Volume (Units) Analysis by Catalyst Type, 2019 to 2034

Figure 83: Western Europe Market Value Share (%) and BPS Analysis by Catalyst Type, 2024 to 2034

Figure 84: Western Europe Market Y-o-Y Growth (%) Projections by Catalyst Type, 2024 to 2034

Figure 85: Western Europe Market Value (US$ Million) Analysis by Resin Type, 2019 to 2034

Figure 86: Western Europe Market Volume (Units) Analysis by Resin Type, 2019 to 2034

Figure 87: Western Europe Market Value Share (%) and BPS Analysis by Resin Type, 2024 to 2034

Figure 88: Western Europe Market Y-o-Y Growth (%) Projections by Resin Type, 2024 to 2034

Figure 89: Western Europe Market Value (US$ Million) Analysis by End-use Industry, 2019 to 2034

Figure 90: Western Europe Market Volume (Units) Analysis by End-use Industry, 2019 to 2034

Figure 91: Western Europe Market Value Share (%) and BPS Analysis by End-use Industry, 2024 to 2034

Figure 92: Western Europe Market Y-o-Y Growth (%) Projections by End-use Industry, 2024 to 2034

Figure 93: Western Europe Market Attractiveness by Catalyst Type, 2024 to 2034

Figure 94: Western Europe Market Attractiveness by Resin Type, 2024 to 2034

Figure 95: Western Europe Market Attractiveness by End-use Industry, 2024 to 2034

Figure 96: Western Europe Market Attractiveness by Country, 2024 to 2034

Figure 97: Eastern Europe Market Value (US$ Million) by Catalyst Type, 2024 to 2034

Figure 98: Eastern Europe Market Value (US$ Million) by Resin Type, 2024 to 2034

Figure 99: Eastern Europe Market Value (US$ Million) by End-use Industry, 2024 to 2034

Figure 100: Eastern Europe Market Value (US$ Million) by Country, 2024 to 2034

Figure 101: Eastern Europe Market Value (US$ Million) Analysis by Country, 2019 to 2034

Figure 102: Eastern Europe Market Volume (Units) Analysis by Country, 2019 to 2034

Figure 103: Eastern Europe Market Value Share (%) and BPS Analysis by Country, 2024 to 2034

Figure 104: Eastern Europe Market Y-o-Y Growth (%) Projections by Country, 2024 to 2034

Figure 105: Eastern Europe Market Value (US$ Million) Analysis by Catalyst Type, 2019 to 2034

Figure 106: Eastern Europe Market Volume (Units) Analysis by Catalyst Type, 2019 to 2034

Figure 107: Eastern Europe Market Value Share (%) and BPS Analysis by Catalyst Type, 2024 to 2034

Figure 108: Eastern Europe Market Y-o-Y Growth (%) Projections by Catalyst Type, 2024 to 2034

Figure 109: Eastern Europe Market Value (US$ Million) Analysis by Resin Type, 2019 to 2034

Figure 110: Eastern Europe Market Volume (Units) Analysis by Resin Type, 2019 to 2034

Figure 111: Eastern Europe Market Value Share (%) and BPS Analysis by Resin Type, 2024 to 2034

Figure 112: Eastern Europe Market Y-o-Y Growth (%) Projections by Resin Type, 2024 to 2034

Figure 113: Eastern Europe Market Value (US$ Million) Analysis by End-use Industry, 2019 to 2034

Figure 114: Eastern Europe Market Volume (Units) Analysis by End-use Industry, 2019 to 2034

Figure 115: Eastern Europe Market Value Share (%) and BPS Analysis by End-use Industry, 2024 to 2034

Figure 116: Eastern Europe Market Y-o-Y Growth (%) Projections by End-use Industry, 2024 to 2034

Figure 117: Eastern Europe Market Attractiveness by Catalyst Type, 2024 to 2034

Figure 118: Eastern Europe Market Attractiveness by Resin Type, 2024 to 2034

Figure 119: Eastern Europe Market Attractiveness by End-use Industry, 2024 to 2034

Figure 120: Eastern Europe Market Attractiveness by Country, 2024 to 2034

Figure 121: South Asia and Pacific Market Value (US$ Million) by Catalyst Type, 2024 to 2034

Figure 122: South Asia and Pacific Market Value (US$ Million) by Resin Type, 2024 to 2034

Figure 123: South Asia and Pacific Market Value (US$ Million) by End-use Industry, 2024 to 2034

Figure 124: South Asia and Pacific Market Value (US$ Million) by Country, 2024 to 2034

Figure 125: South Asia and Pacific Market Value (US$ Million) Analysis by Country, 2019 to 2034

Figure 126: South Asia and Pacific Market Volume (Units) Analysis by Country, 2019 to 2034

Figure 127: South Asia and Pacific Market Value Share (%) and BPS Analysis by Country, 2024 to 2034

Figure 128: South Asia and Pacific Market Y-o-Y Growth (%) Projections by Country, 2024 to 2034

Figure 129: South Asia and Pacific Market Value (US$ Million) Analysis by Catalyst Type, 2019 to 2034

Figure 130: South Asia and Pacific Market Volume (Units) Analysis by Catalyst Type, 2019 to 2034

Figure 131: South Asia and Pacific Market Value Share (%) and BPS Analysis by Catalyst Type, 2024 to 2034

Figure 132: South Asia and Pacific Market Y-o-Y Growth (%) Projections by Catalyst Type, 2024 to 2034

Figure 133: South Asia and Pacific Market Value (US$ Million) Analysis by Resin Type, 2019 to 2034

Figure 134: South Asia and Pacific Market Volume (Units) Analysis by Resin Type, 2019 to 2034

Figure 135: South Asia and Pacific Market Value Share (%) and BPS Analysis by Resin Type, 2024 to 2034

Figure 136: South Asia and Pacific Market Y-o-Y Growth (%) Projections by Resin Type, 2024 to 2034

Figure 137: South Asia and Pacific Market Value (US$ Million) Analysis by End-use Industry, 2019 to 2034

Figure 138: South Asia and Pacific Market Volume (Units) Analysis by End-use Industry, 2019 to 2034

Figure 139: South Asia and Pacific Market Value Share (%) and BPS Analysis by End-use Industry, 2024 to 2034

Figure 140: South Asia and Pacific Market Y-o-Y Growth (%) Projections by End-use Industry, 2024 to 2034

Figure 141: South Asia and Pacific Market Attractiveness by Catalyst Type, 2024 to 2034

Figure 142: South Asia and Pacific Market Attractiveness by Resin Type, 2024 to 2034

Figure 143: South Asia and Pacific Market Attractiveness by End-use Industry, 2024 to 2034

Figure 144: South Asia and Pacific Market Attractiveness by Country, 2024 to 2034

Figure 145: East Asia Market Value (US$ Million) by Catalyst Type, 2024 to 2034

Figure 146: East Asia Market Value (US$ Million) by Resin Type, 2024 to 2034

Figure 147: East Asia Market Value (US$ Million) by End-use Industry, 2024 to 2034

Figure 148: East Asia Market Value (US$ Million) by Country, 2024 to 2034

Figure 149: East Asia Market Value (US$ Million) Analysis by Country, 2019 to 2034

Figure 150: East Asia Market Volume (Units) Analysis by Country, 2019 to 2034

Figure 151: East Asia Market Value Share (%) and BPS Analysis by Country, 2024 to 2034

Figure 152: East Asia Market Y-o-Y Growth (%) Projections by Country, 2024 to 2034

Figure 153: East Asia Market Value (US$ Million) Analysis by Catalyst Type, 2019 to 2034

Figure 154: East Asia Market Volume (Units) Analysis by Catalyst Type, 2019 to 2034

Figure 155: East Asia Market Value Share (%) and BPS Analysis by Catalyst Type, 2024 to 2034

Figure 156: East Asia Market Y-o-Y Growth (%) Projections by Catalyst Type, 2024 to 2034

Figure 157: East Asia Market Value (US$ Million) Analysis by Resin Type, 2019 to 2034

Figure 158: East Asia Market Volume (Units) Analysis by Resin Type, 2019 to 2034

Figure 159: East Asia Market Value Share (%) and BPS Analysis by Resin Type, 2024 to 2034

Figure 160: East Asia Market Y-o-Y Growth (%) Projections by Resin Type, 2024 to 2034

Figure 161: East Asia Market Value (US$ Million) Analysis by End-use Industry, 2019 to 2034

Figure 162: East Asia Market Volume (Units) Analysis by End-use Industry, 2019 to 2034

Figure 163: East Asia Market Value Share (%) and BPS Analysis by End-use Industry, 2024 to 2034

Figure 164: East Asia Market Y-o-Y Growth (%) Projections by End-use Industry, 2024 to 2034

Figure 165: East Asia Market Attractiveness by Catalyst Type, 2024 to 2034

Figure 166: East Asia Market Attractiveness by Resin Type, 2024 to 2034

Figure 167: East Asia Market Attractiveness by End-use Industry, 2024 to 2034

Figure 168: East Asia Market Attractiveness by Country, 2024 to 2034

Figure 169: Middle East and Africa Market Value (US$ Million) by Catalyst Type, 2024 to 2034

Figure 170: Middle East and Africa Market Value (US$ Million) by Resin Type, 2024 to 2034

Figure 171: Middle East and Africa Market Value (US$ Million) by End-use Industry, 2024 to 2034

Figure 172: Middle East and Africa Market Value (US$ Million) by Country, 2024 to 2034

Figure 173: Middle East and Africa Market Value (US$ Million) Analysis by Country, 2019 to 2034

Figure 174: Middle East and Africa Market Volume (Units) Analysis by Country, 2019 to 2034

Figure 175: Middle East and Africa Market Value Share (%) and BPS Analysis by Country, 2024 to 2034

Figure 176: Middle East and Africa Market Y-o-Y Growth (%) Projections by Country, 2024 to 2034

Figure 177: Middle East and Africa Market Value (US$ Million) Analysis by Catalyst Type, 2019 to 2034

Figure 178: Middle East and Africa Market Volume (Units) Analysis by Catalyst Type, 2019 to 2034

Figure 179: Middle East and Africa Market Value Share (%) and BPS Analysis by Catalyst Type, 2024 to 2034

Figure 180: Middle East and Africa Market Y-o-Y Growth (%) Projections by Catalyst Type, 2024 to 2034

Figure 181: Middle East and Africa Market Value (US$ Million) Analysis by Resin Type, 2019 to 2034

Figure 182: Middle East and Africa Market Volume (Units) Analysis by Resin Type, 2019 to 2034

Figure 183: Middle East and Africa Market Value Share (%) and BPS Analysis by Resin Type, 2024 to 2034

Figure 184: Middle East and Africa Market Y-o-Y Growth (%) Projections by Resin Type, 2024 to 2034

Figure 185: Middle East and Africa Market Value (US$ Million) Analysis by End-use Industry, 2019 to 2034

Figure 186: Middle East and Africa Market Volume (Units) Analysis by End-use Industry, 2019 to 2034

Figure 187: Middle East and Africa Market Value Share (%) and BPS Analysis by End-use Industry, 2024 to 2034

Figure 188: Middle East and Africa Market Y-o-Y Growth (%) Projections by End-use Industry, 2024 to 2034

Figure 189: Middle East and Africa Market Attractiveness by Catalyst Type, 2024 to 2034

Figure 190: Middle East and Africa Market Attractiveness by Resin Type, 2024 to 2034

Figure 191: Middle East and Africa Market Attractiveness by End-use Industry, 2024 to 2034

Figure 192: Middle East and Africa Market Attractiveness by Country, 2024 to 2034

Frequently Asked Questions

What is the expected value of the resin capsule market in 2024?

By 2024, the resin capsule landscape is anticipated to be valued at USD 1.3 billion.

What is the projected forecast CAGR for the resin capsule market from 2024 to 2034?

The resin capsule market is projected to flourish at a CAGR of 5.2% from 2024 to 2034.

At what value the resin capsule market is expected to conclude in 2034?

By 2034, the resin capsule market will generate USD 2.1 billion in value terms.

Based on resin type, which segment dominates the resin capsule market?

Polyester is anticipated to expand at 5% CAGR by 2034.

Which country dominates the resin capsule market?

With a CAGR of 6.5%, Japan is expected to dominate the market for resin capsules.

Explore Polymers & Plastics Insights

Future Market Insights

Resin Capsule Market