Reports

- Global Locations -

Headquarters

Future Market Insights, Inc.

Christiana Corporate, 200
Continental Drive, Suite 401,
Newark, Delaware - 19713,
United States

T: +1-845-579-5705

Americas

Future Market Insights, Inc.

616 Corporate Way, Suite 2-9018,
Valley Cottage, NY 10989, United States

T: +1-347-918-3531

MEA

Future Market Insights

1602-6 Jumeirah Bay X2 Tower, Plot No: JLT-PH2-X2A,
Jumeirah Lakes Towers, Dubai,
United Arab Emirates

Europe

Future Market Insights

3rd Floor, 207 Regent Street,
W1B 3HH London
United Kingdom

T: + 44 (0) 20 8123 9659
D: +44 (0) 20 3287 4268

Asia Pacific

Future Market Insights

IndiaLand Global Tech Park, Unit UG-1, Behind Grand HighStreet, Phase 1, Hinjawadi, MH, Pune – 411057, India

Capsule Filling Machines Market Snapshot (2023 to 2033)

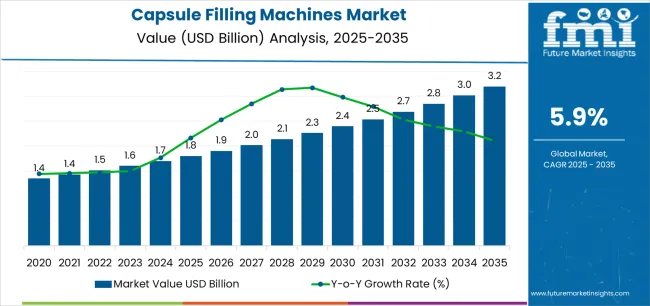
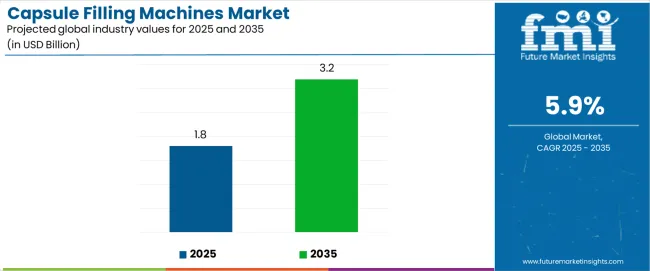
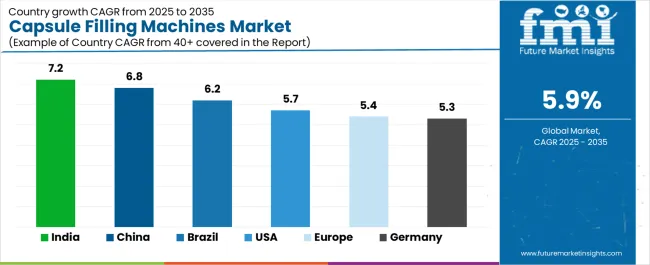
The global capsule-filling machines market size is expected to reach a valuation of US$ 588.35 million in 2023. Furthermore, the advancement of capsule-filling machines, as well as the rising prevalence of chronic diseases, is driving the growth of the capsule-filling machine market. The overall demand for capsule-filling machines is likely to expand at a moderate CAGR of 4.8% between 2023 and 2033, totaling around US$ 939.43 million by 2033.

Capsules are manufactured by filling various types of formulations or powders containing active ingredients and their mixtures, as well as combinations of excipients, using a variety of capsule-filling machines. Also, physicians prescribe these capsules to patients for the treatment of a variety of disorders or conditions.

Pharmaceutical advancements have enabled medicine manufacturers to supply medicines in large quantities to the market. Capsule-filling machines are essential in the pharmaceutical industry because they allow the industry to serve the masses. These machines are designed to fill capsules with accuracy and precision, reducing the risk of side effects from overdosing.

Semi-automatic and automatic capsule-filling machines with capacities ranging from 75,000 to over 300,000 dosages per hour are commonly available. The use of capsule-filling machines addresses the pressing concern, which is the preservation of hygiene during capsule manufacturing.

Capsule-filling machines are now used in all regions to serve the pharmaceutical market. Automatic capsule filling machines are being offered by manufacturers all over the world due to their speed and high filling rate.

Data Points Key Statistics
Expected Market Value (2023) US$ 588.35 million
Anticipated Forecast Value (2033) US$ 939.43 million
Projected Growth Rate (2023 to 2033) 4.8% CAGR

Don't pay for what you don't need

Customize your report by selecting specific countries or regions and save 30%!

Capsule Filling Machines Demand Analysis (2018 to 2022) Vs Market Outlook (2023 to 2033)

The global demand for capsule-filling machines is projected to increase at a CAGR of 4.8% during the forecast period, reaching a total of US$ 939.43 million by 2033, according to a report from Future Market Insights (FMI). From 2018 to 2022, sales witnessed significant growth, registering a CAGR of 2.1%.

Increasing technological advancements in capsule equipment with automatic filling, as well as rising demand for effective capsules due to disease prevalence, are driving the global capsule-filling equipment market. Aside from that, large-scale capsule production offers manufacturers low-cost advantages and allows them to increase their annual turnover.

Increased consumption of health supplements is driving up demand for capsules, which is driving up the global capsule-filling equipment market size. However, the FDA's stringent regulations regarding capsule approval may limit and stymie market growth.

A variety of factors contribute to market growth, including a focus on improving the efficiency of manufacturing processes, technological advancements, innovations, and a growing emphasis on product development. Manufacturers in the current market landscape are expected to focus on releasing new machines with enhanced functionality and performance. Furthermore, market participants are expected to rely on mergers and acquisitions in the long run to strengthen their position in the capsule-filling machines market.

Which are Some Prominent Drivers of Capsule Filling Machines Market?

The Growing Need to Provide Adequate Medicine to the Constantly Expanding Population to Drive the Market Growth

The need to provide adequate medicine to the world's significantly growing population has increased the use of capsule-filling machines in the pharmaceutical industry. Further, the ability of capsule-filling machines to fill capsules with over 300,000 dosages per hour at a fill rate of about 99% is a key factor driving the growth of the capsule-filling machines market.

The use of capsule-filling machines has enabled pharmaceutical manufacturers to increase their profitability by gaining economies of scale, increasing the preference for automatic capsule-filling machines in the pharmaceutical industry. Moreover, the global pharmaceutical industry is notably expanding, owing to advances in technology, manufacturing processes, and integration. This has resulted in advancements in capsule manufacturing processes, which has increased demand for novel capsule-filling machines.

Capsule production on a large scale necessitates the use of more automatic capsule fillers, which fuels the growth of the capsule filler market. Additionally, rising public health awareness is driving a surge in demand for health supplements in both emerging and developed markets, bolstering the capsule-filling machines market. Other factors fueling the growth of the capsule filling machines market include dependability and the preservation of hygiene while manufacturing capsules.

The ability of capsule-filling machines to fill solid, liquid, and semi-solid dosages has expanded the range of applications for capsule-filling machines, driving up demand in the capsule filling machines market. Capsule-filling machines are simple to use because they only require one person to operate.

Capsule machine manufacturers provide machines with customized solutions to increase the company's productivity and operational efficiency. Also, increasing pharmaceutical demand is expected to drive the capsule filling machines market during the forecast period, particularly in the Asia Pacific Excluding Japan region.

Ismail Sutaria
Ismail Sutaria

Principal Consultant

Talk to Analyst

Find your sweet spots for generating winning opportunities in this market.

What are the Challenges Faced by the Capsule Filling Machines Market?

High Cost is to be a Key Deal Breaker

The high cost of automatic capsule-filling machines may limit the market's growth during the forecast period.

Region-Wise Insights

How is North America’s Capsule Filling Machines Market Shaping?

High Demand from the Pharmaceutical Industry Creating Opportunities for Capsule Filling Machines Manufacturers

North America is projected to be a leading contributor to the capsule filling machines market owing to the strong and long-lasting winter in the region. Furthermore, due to the region's high demand from the pharmaceutical industry, North America is expected to trail the Asia Pacific Excluding Japan region in the capsule filling machines market.

The market in the region is predicted to expand significantly in the coming years as a result of increased research and development and the introduction of technologically advanced products. Thus, due to the aforementioned reasons, North America is expected to possess a 36% market share in 2023, registering a CAGR of 4.7% for the capsule filling machines market in the assessment period.

Why is Europe Considered a Promising Market for Capsule Filling Machines?

Europe Being a Mature Market Favoring Capsule Filling Machines Market’s Growth

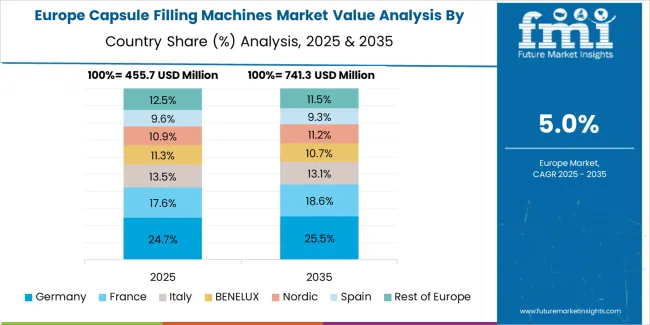
Europe’s capsule filling machines market is expected to grow moderately during the forecast period as a result of Western Europe and Eastern Europe being mature markets.

Europe is projected to be the second-largest market during the forecast period owing to the advanced facilities provided by the region's industrial infrastructure. Thus, Europe is expected to hold 25% of the market share for the capsule-filling machines market in 2023.

What are the Growth Prospects for the Capsule Filling Machines Market in the Asia Pacific?

The Asia Pacific region is expected to lead the capsule-filling machines market during the forecast period as a result of its dense population. During the forecast period, the capsule filling machines market is expected to thrive at a significant pace. Thus, the region is expected to procure a 15% market share for the capsule filling machines market in 2023.

Get the data you need at a Fraction of the cost

Personalize your report by choosing insights you need
and save 40%!

Category-Wise Insights

Which is the Most Consumed Capsule Filling Machines Operation Type?

Automatic Capsule Filling Machines to Have the High Demand

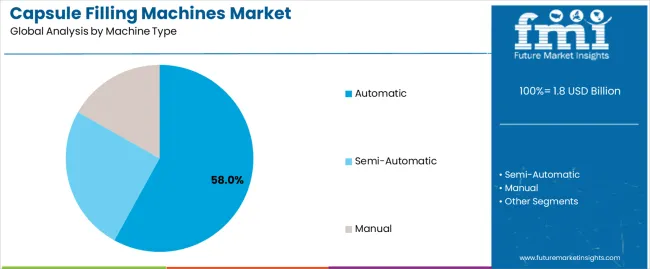
By operation type, the capsule-filling machine market is divided into three categories such as automatic capsule-filling machines, semi-automatic capsule-filling machines, and manual capsule-filling machines. In 2022, the automatic capsule filling machines segment held a notable market share

Most of the leading pharma companies have in-house filling stations, whereas mid-sized pharma companies typically outsource their filling needs to contract manufacturers. End users who require high output choose fully automatic machines, whereas research and development labs and small-scale pharmaceutical manufacturers prefer semi-automatic capsule-filling machines.

Capsule production on a large scale necessitates the use of automatic capsule-filling machines, which fuels the growth of the capsule filling machines market. In addition, rising public health awareness is driving a surge in demand for health supplements in both emerging and developed markets, bolstering the capsule filling machines market.

Which Dosage Type Generates the Maximum Revenue in Capsule Filling Machines Market?

The Liquid Segment to Remain Highly Sought After in the Capsule Filling Machines Market

The growing consumer focus on health and wellness, combined with public awareness about healthier lifestyles and the effectiveness of dietary supplements, has fueled demand for health supplements.

Liquid capsule formulations are easy to swallow and absorb fast in the body than tablets. As a result, liquid-filled capsules have gained popularity as health supplements in the nutraceutical industry. Further, high capsule consumption has created a consistent demand for effective capsule-filling solutions, which is fueling global demand for capsule-filling machines.

Start-ups for Capsule Filling Machines Market

Key Startup Players in the Capsule-Filling Machines Market

LFA, headquartered in Germany, is the recent company on this list to provide packaging solutions. LFA was founded in 2009 with the sole purpose of manufacturing tablet presses. This Germany-based company currently manufactures tablet presses, capsule fillers (including empty hard gelatin capsules and capsule-filling machines), and mixers.

Market Competition

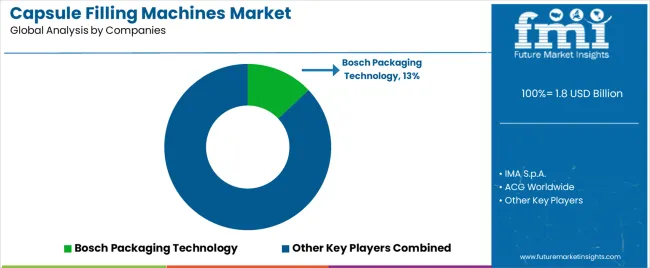
Leading players in the capsule filling machines market are Harro Höfliger Verpackungsmaschinen GmbH, SaintyCo, Acg Pam Pharma Technologies Private Limited, Robert Bosch GmbH, M G America Inc, Shanghai Develop Machinery Co., Limited, Shanghai Jiuwu Pharmtech Machinery Co., Ltd., Shanghai TIWIN Industry Co., Ltd., Wenzhou Ouya Machinery Co., Ltd., Zhuhai Ting Kai Trading Co., Ltd. and Shanghai Pharmaceutical Machinery Co., Ltd.

  • In March 2022, MG America, the USA subsidiary of MG2 of Bologna, Italy, and a leading supplier of processing and packaging equipment, is likely to introduce two new machines at INTERPHEX NYC Booth, October 19 to 21. The first is an improved wraparound vial labeling machine that is ideal for the ongoing production of COVID-19 vaccines, and the second is a tough, 10-lane capsule check weighed with a newly developed handling mechanism.

Report Scope

Report Attributes Details
Market Value in 2023 US$ 588.35 million
Market Value in 2033 US$ 939.43 million
Growth Rate CAGR of 4.8% from 2023 to 2033
Base Year for Estimation 2022
Historical Data 2018 to 2022
Forecast Period 2023 to 2033
Quantitative Units Revenue in US$ million and CAGR from 2023 to 2033
Report Coverage Revenue Forecast, Volume Forecast, Company Ranking, Competitive Landscape, Growth Factors, Trends, and Pricing Analysis
Segments Covered
  • Operation Type
  • Capacity Type
  • Dosage Type
  • Region
Regions Covered
  • North America
  • Latin America
  • Europe
  • Asia Pacific
  • The Middle East and Africa
Key Countries Profiled
  • The United States of America
  • Canada
  • Brazil
  • Mexico
  • Germany
  • The United Kingdom
  • France
  • Spain
  • Italy
  • China
  • Japan
  • South Korea
  • Malaysia
  • Singapore
  • Australia
  • New Zealand
  • GCC Countries
  • South Africa
  • Israel
Key Companies Profiled
  • Harro Höfliger Verpackungsmaschinen GmbH
  • Sainty Co.
  • ACG Pam Pharma Technologies Private Limited
  • Robert Bosch GmbH
  • Shanghai Develop Machinery Co. Limited
  • Shanghai Jiuwu Pharmtech Machinery Co. Ltd.
  • Shanghai TIWIN Industry Co. Ltd.
  • Wenzhou Ouya Machinery Co. Ltd.
  • Zhuhai, Ting Kai Trading Co. Ltd.
  • Shanghai Pharmaceutical Machinery Co. Ltd.
Customization Available Upon Request

Key Segments Profiled in the Capsule Filling Machines Industry Survey

By Operation Type:

  • Automatic
  • Semi-Automatic
  • Manual

By Capacity Type:

  • >75,000 Units
  • for 75,000 - 150,000 Units
  • for 150,000 - 225,000 Units
  • for 225,000 - 300,000 Units
  • >300,000 Units

By Dosage Type:

  • Liquid
  • Semi Solid
  • Solid

By Region:

  • North America
  • Latin America
  • Europe
  • Eastern Europe
  • Asia Pacific
  • The Middle East & Africa

Frequently Asked Questions

How Big is the Capsule Filling Machines Market?

The market is valued at US$ 588.35 million in 2023.

Who are the Key Capsule Filling Machines Market Players?

Sainty Co, and Robert Bosche GmbH are key capsule filling machines market players.

Which is the Key Segment by Operation Type?

The automatic capsule is likely to remain preferred through 2033.

Which is the Go-to-Market Strategy?

Players opt for research and development.

Which are the Key Asian Countries in the Capsule Filling Machines Market?

India, Japan, and China dominate the Asian market.

Table of Content

1. Executive Summary

    1.1. Global Market Outlook

    1.2. Demand-side Trends

    1.3. Supply-side Trends

    1.4. Technology Roadmap Analysis

    1.5. Analysis and Recommendations

2. Market Overview

    2.1. Market Coverage / Taxonomy

    2.2. Market Definition / Scope / Limitations

3. Market Background

    3.1. Market Dynamics

        3.1.1. Drivers

        3.1.2. Restraints

        3.1.3. Opportunity

        3.1.4. Trends

    3.2. Scenario Forecast

        3.2.1. Demand in Optimistic Scenario

        3.2.2. Demand in Likely Scenario

        3.2.3. Demand in Conservative Scenario

    3.3. Opportunity Map Analysis

    3.4. Product Life Cycle Analysis

    3.5. Supply Chain Analysis

        3.5.1. Supply Side Participants and their Roles

            3.5.1.1. Producers

            3.5.1.2. Mid-Level Participants (Traders/ Agents/ Brokers)

            3.5.1.3. Wholesalers and Distributors

        3.5.2. Value Added and Value Created at Node in the Supply Chain

        3.5.3. List of Raw Material Suppliers

        3.5.4. List of Existing and Potential Buyer’s

    3.6. Investment Feasibility Matrix

    3.7. Value Chain Analysis

        3.7.1. Profit Margin Analysis

        3.7.2. Wholesalers and Distributors

        3.7.3. Retailers

    3.8. PESTLE and Porter’s Analysis

    3.9. Regulatory Landscape

        3.9.1. By Key Regions

        3.9.2. By Key Countries

    3.10. Regional Parent Market Outlook

    3.11. Production and Consumption Statistics

    3.12. Import and Export Statistics

4. Global Market Analysis 2018 to 2022 and Forecast, 2023 to 2033

    4.1. Historical Market Size Value (US$ Million) & Volume (Units) Analysis, 2018 to 2022

    4.2. Current and Future Market Size Value (US$ Million) & Volume (Units) Projections, 2023 to 2033

        4.2.1. Y-o-Y Growth Trend Analysis

        4.2.2. Absolute $ Opportunity Analysis

5. Global Market Analysis 2018 to 2022 and Forecast 2023 to 2033, By Operation Type

    5.1. Introduction / Key Findings

    5.2. Historical Market Size Value (US$ Million) & Volume (Units) Analysis By Operation Type, 2018 to 2022

    5.3. Current and Future Market Size Value (US$ Million) & Volume (Units) Analysis and Forecast By Operation Type, 2023 to 2033

        5.3.1. Automatic

        5.3.2. Semi-Automatic

        5.3.3. Manual

    5.4. Y-o-Y Growth Trend Analysis By Operation Type, 2018 to 2022

    5.5. Absolute $ Opportunity Analysis By Operation Type, 2023 to 2033

6. Global Market Analysis 2018 to 2022 and Forecast 2023 to 2033, By Capacity Type

    6.1. Introduction / Key Findings

    6.2. Historical Market Size Value (US$ Million) & Volume (Units) Analysis By Capacity Type, 2018 to 2022

    6.3. Current and Future Market Size Value (US$ Million) & Volume (Units) Analysis and Forecast By Capacity Type, 2023 to 2033

        6.3.1. >75,000 Units

        6.3.2. 75,000 - 150,000 Units

        6.3.3. 150,000 - 225,000 Units

        6.3.4. 225,000 - 300,000 Units

        6.3.5. >300,000 Value Units

    6.4. Y-o-Y Growth Trend Analysis By Capacity Type, 2018 to 2022

    6.5. Absolute $ Opportunity Analysis By Capacity Type, 2023 to 2033

7. Global Market Analysis 2018 to 2022 and Forecast 2023 to 2033, By Dosage Type

    7.1. Introduction / Key Findings

    7.2. Historical Market Size Value (US$ Million) & Volume (Units) Analysis By Dosage Type, 2018 to 2022

    7.3. Current and Future Market Size Value (US$ Million) & Volume (Units) Analysis and Forecast By Dosage Type, 2023 to 2033

        7.3.1. Liquid

        7.3.2. Semi Solid

        7.3.3. Solid

    7.4. Y-o-Y Growth Trend Analysis By Dosage Type, 2018 to 2022

    7.5. Absolute $ Opportunity Analysis By Dosage Type, 2023 to 2033

8. Global Market Analysis 2018 to 2022 and Forecast 2023 to 2033, By Region

    8.1. Introduction

    8.2. Historical Market Size Value (US$ Million) & Volume (Units) Analysis By Region, 2018 to 2022

    8.3. Current Market Size Value (US$ Million) & Volume (Units) Analysis and Forecast By Region, 2023 to 2033

        8.3.1. North America

        8.3.2. Latin America

        8.3.3. Western Europe

        8.3.4. Eastern Europe

        8.3.5. South Asia and Pacific

        8.3.6. East Asia

        8.3.7. Middle East and Africa

    8.4. Market Attractiveness Analysis By Region

9. North America Market Analysis 2018 to 2022 and Forecast 2023 to 2033, By Country

    9.1. Historical Market Size Value (US$ Million) & Volume (Units) Trend Analysis By Market Taxonomy, 2018 to 2022

    9.2. Market Size Value (US$ Million) & Volume (Units) Forecast By Market Taxonomy, 2023 to 2033

        9.2.1. By Country

            9.2.1.1. USA

            9.2.1.2. Canada

        9.2.2. By Operation Type

        9.2.3. By Capacity Type

        9.2.4. By Dosage Type

    9.3. Market Attractiveness Analysis

        9.3.1. By Country

        9.3.2. By Operation Type

        9.3.3. By Capacity Type

        9.3.4. By Dosage Type

    9.4. Key Takeaways

10. Latin America Market Analysis 2018 to 2022 and Forecast 2023 to 2033, By Country

    10.1. Historical Market Size Value (US$ Million) & Volume (Units) Trend Analysis By Market Taxonomy, 2018 to 2022

    10.2. Market Size Value (US$ Million) & Volume (Units) Forecast By Market Taxonomy, 2023 to 2033

        10.2.1. By Country

            10.2.1.1. Brazil

            10.2.1.2. Mexico

            10.2.1.3. Rest of Latin America

        10.2.2. By Operation Type

        10.2.3. By Capacity Type

        10.2.4. By Dosage Type

    10.3. Market Attractiveness Analysis

        10.3.1. By Country

        10.3.2. By Operation Type

        10.3.3. By Capacity Type

        10.3.4. By Dosage Type

    10.4. Key Takeaways

11. Western Europe Market Analysis 2018 to 2022 and Forecast 2023 to 2033, By Country

    11.1. Historical Market Size Value (US$ Million) & Volume (Units) Trend Analysis By Market Taxonomy, 2018 to 2022

    11.2. Market Size Value (US$ Million) & Volume (Units) Forecast By Market Taxonomy, 2023 to 2033

        11.2.1. By Country

            11.2.1.1. Germany

            11.2.1.2. UK

            11.2.1.3. France

            11.2.1.4. Spain

            11.2.1.5. Italy

            11.2.1.6. Rest of Western Europe

        11.2.2. By Operation Type

        11.2.3. By Capacity Type

        11.2.4. By Dosage Type

    11.3. Market Attractiveness Analysis

        11.3.1. By Country

        11.3.2. By Operation Type

        11.3.3. By Capacity Type

        11.3.4. By Dosage Type

    11.4. Key Takeaways

12. Eastern Europe Market Analysis 2018 to 2022 and Forecast 2023 to 2033, By Country

    12.1. Historical Market Size Value (US$ Million) & Volume (Units) Trend Analysis By Market Taxonomy, 2018 to 2022

    12.2. Market Size Value (US$ Million) & Volume (Units) Forecast By Market Taxonomy, 2023 to 2033

        12.2.1. By Country

            12.2.1.1. Poland

            12.2.1.2. Russia

            12.2.1.3. Czech Republic

            12.2.1.4. Romania

            12.2.1.5. Rest of Eastern Europe

        12.2.2. By Operation Type

        12.2.3. By Capacity Type

        12.2.4. By Dosage Type

    12.3. Market Attractiveness Analysis

        12.3.1. By Country

        12.3.2. By Operation Type

        12.3.3. By Capacity Type

        12.3.4. By Dosage Type

    12.4. Key Takeaways

13. South Asia and Pacific Market Analysis 2018 to 2022 and Forecast 2023 to 2033, By Country

    13.1. Historical Market Size Value (US$ Million) & Volume (Units) Trend Analysis By Market Taxonomy, 2018 to 2022

    13.2. Market Size Value (US$ Million) & Volume (Units) Forecast By Market Taxonomy, 2023 to 2033

        13.2.1. By Country

            13.2.1.1. India

            13.2.1.2. Bangladesh

            13.2.1.3. Australia

            13.2.1.4. New Zealand

            13.2.1.5. Rest of South Asia and Pacific

        13.2.2. By Operation Type

        13.2.3. By Capacity Type

        13.2.4. By Dosage Type

    13.3. Market Attractiveness Analysis

        13.3.1. By Country

        13.3.2. By Operation Type

        13.3.3. By Capacity Type

        13.3.4. By Dosage Type

    13.4. Key Takeaways

14. East Asia Market Analysis 2018 to 2022 and Forecast 2023 to 2033, By Country

    14.1. Historical Market Size Value (US$ Million) & Volume (Units) Trend Analysis By Market Taxonomy, 2018 to 2022

    14.2. Market Size Value (US$ Million) & Volume (Units) Forecast By Market Taxonomy, 2023 to 2033

        14.2.1. By Country

            14.2.1.1. China

            14.2.1.2. Japan

            14.2.1.3. South Korea

        14.2.2. By Operation Type

        14.2.3. By Capacity Type

        14.2.4. By Dosage Type

    14.3. Market Attractiveness Analysis

        14.3.1. By Country

        14.3.2. By Operation Type

        14.3.3. By Capacity Type

        14.3.4. By Dosage Type

    14.4. Key Takeaways

15. Middle East and Africa Market Analysis 2018 to 2022 and Forecast 2023 to 2033, By Country

    15.1. Historical Market Size Value (US$ Million) & Volume (Units) Trend Analysis By Market Taxonomy, 2018 to 2022

    15.2. Market Size Value (US$ Million) & Volume (Units) Forecast By Market Taxonomy, 2023 to 2033

        15.2.1. By Country

            15.2.1.1. GCC Countries

            15.2.1.2. South Africa

            15.2.1.3. Israel

            15.2.1.4. Rest of MEA

        15.2.2. By Operation Type

        15.2.3. By Capacity Type

        15.2.4. By Dosage Type

    15.3. Market Attractiveness Analysis

        15.3.1. By Country

        15.3.2. By Operation Type

        15.3.3. By Capacity Type

        15.3.4. By Dosage Type

    15.4. Key Takeaways

16. Key Countries Market Analysis

    16.1. USA

        16.1.1. Pricing Analysis

        16.1.2. Market Share Analysis, 2022

            16.1.2.1. By Operation Type

            16.1.2.2. By Capacity Type

            16.1.2.3. By Dosage Type

    16.2. Canada

        16.2.1. Pricing Analysis

        16.2.2. Market Share Analysis, 2022

            16.2.2.1. By Operation Type

            16.2.2.2. By Capacity Type

            16.2.2.3. By Dosage Type

    16.3. Brazil

        16.3.1. Pricing Analysis

        16.3.2. Market Share Analysis, 2022

            16.3.2.1. By Operation Type

            16.3.2.2. By Capacity Type

            16.3.2.3. By Dosage Type

    16.4. Mexico

        16.4.1. Pricing Analysis

        16.4.2. Market Share Analysis, 2022

            16.4.2.1. By Operation Type

            16.4.2.2. By Capacity Type

            16.4.2.3. By Dosage Type

    16.5. Germany

        16.5.1. Pricing Analysis

        16.5.2. Market Share Analysis, 2022

            16.5.2.1. By Operation Type

            16.5.2.2. By Capacity Type

            16.5.2.3. By Dosage Type

    16.6. UK

        16.6.1. Pricing Analysis

        16.6.2. Market Share Analysis, 2022

            16.6.2.1. By Operation Type

            16.6.2.2. By Capacity Type

            16.6.2.3. By Dosage Type

    16.7. France

        16.7.1. Pricing Analysis

        16.7.2. Market Share Analysis, 2022

            16.7.2.1. By Operation Type

            16.7.2.2. By Capacity Type

            16.7.2.3. By Dosage Type

    16.8. Spain

        16.8.1. Pricing Analysis

        16.8.2. Market Share Analysis, 2022

            16.8.2.1. By Operation Type

            16.8.2.2. By Capacity Type

            16.8.2.3. By Dosage Type

    16.9. Italy

        16.9.1. Pricing Analysis

        16.9.2. Market Share Analysis, 2022

            16.9.2.1. By Operation Type

            16.9.2.2. By Capacity Type

            16.9.2.3. By Dosage Type

    16.10. Poland

        16.10.1. Pricing Analysis

        16.10.2. Market Share Analysis, 2022

            16.10.2.1. By Operation Type

            16.10.2.2. By Capacity Type

            16.10.2.3. By Dosage Type

    16.11. Russia

        16.11.1. Pricing Analysis

        16.11.2. Market Share Analysis, 2022

            16.11.2.1. By Operation Type

            16.11.2.2. By Capacity Type

            16.11.2.3. By Dosage Type

    16.12. Czech Republic

        16.12.1. Pricing Analysis

        16.12.2. Market Share Analysis, 2022

            16.12.2.1. By Operation Type

            16.12.2.2. By Capacity Type

            16.12.2.3. By Dosage Type

    16.13. Romania

        16.13.1. Pricing Analysis

        16.13.2. Market Share Analysis, 2022

            16.13.2.1. By Operation Type

            16.13.2.2. By Capacity Type

            16.13.2.3. By Dosage Type

    16.14. India

        16.14.1. Pricing Analysis

        16.14.2. Market Share Analysis, 2022

            16.14.2.1. By Operation Type

            16.14.2.2. By Capacity Type

            16.14.2.3. By Dosage Type

    16.15. Bangladesh

        16.15.1. Pricing Analysis

        16.15.2. Market Share Analysis, 2022

            16.15.2.1. By Operation Type

            16.15.2.2. By Capacity Type

            16.15.2.3. By Dosage Type

    16.16. Australia

        16.16.1. Pricing Analysis

        16.16.2. Market Share Analysis, 2022

            16.16.2.1. By Operation Type

            16.16.2.2. By Capacity Type

            16.16.2.3. By Dosage Type

    16.17. New Zealand

        16.17.1. Pricing Analysis

        16.17.2. Market Share Analysis, 2022

            16.17.2.1. By Operation Type

            16.17.2.2. By Capacity Type

            16.17.2.3. By Dosage Type

    16.18. China

        16.18.1. Pricing Analysis

        16.18.2. Market Share Analysis, 2022

            16.18.2.1. By Operation Type

            16.18.2.2. By Capacity Type

            16.18.2.3. By Dosage Type

    16.19. Japan

        16.19.1. Pricing Analysis

        16.19.2. Market Share Analysis, 2022

            16.19.2.1. By Operation Type

            16.19.2.2. By Capacity Type

            16.19.2.3. By Dosage Type

    16.20. South Korea

        16.20.1. Pricing Analysis

        16.20.2. Market Share Analysis, 2022

            16.20.2.1. By Operation Type

            16.20.2.2. By Capacity Type

            16.20.2.3. By Dosage Type

    16.21. GCC Countries

        16.21.1. Pricing Analysis

        16.21.2. Market Share Analysis, 2022

            16.21.2.1. By Operation Type

            16.21.2.2. By Capacity Type

            16.21.2.3. By Dosage Type

    16.22. South Africa

        16.22.1. Pricing Analysis

        16.22.2. Market Share Analysis, 2022

            16.22.2.1. By Operation Type

            16.22.2.2. By Capacity Type

            16.22.2.3. By Dosage Type

    16.23. Israel

        16.23.1. Pricing Analysis

        16.23.2. Market Share Analysis, 2022

            16.23.2.1. By Operation Type

            16.23.2.2. By Capacity Type

            16.23.2.3. By Dosage Type

17. Market Structure Analysis

    17.1. Competition Dashboard

    17.2. Competition Benchmarking

    17.3. Market Share Analysis of Top Players

        17.3.1. By Regional

        17.3.2. By Operation Type

        17.3.3. By Capacity Type

        17.3.4. By Dosage Type

18. Competition Analysis

    18.1. Competition Deep Dive

        18.1.1. Harro Höfliger Verpackungsmaschinen GmbH

            18.1.1.1. Overview

            18.1.1.2. Product Portfolio

            18.1.1.3. Profitability by Market Segments

            18.1.1.4. Sales Footprint

            18.1.1.5. Strategy Overview

                18.1.1.5.1. Marketing Strategy

                18.1.1.5.2. Product Strategy

                18.1.1.5.3. Channel Strategy

        18.1.2. Sainty Co.

            18.1.2.1. Overview

            18.1.2.2. Product Portfolio

            18.1.2.3. Profitability by Market Segments

            18.1.2.4. Sales Footprint

            18.1.2.5. Strategy Overview

                18.1.2.5.1. Marketing Strategy

                18.1.2.5.2. Product Strategy

                18.1.2.5.3. Channel Strategy

        18.1.3. ACG Pam Pharma Technologies Private Limited

            18.1.3.1. Overview

            18.1.3.2. Product Portfolio

            18.1.3.3. Profitability by Market Segments

            18.1.3.4. Sales Footprint

            18.1.3.5. Strategy Overview

                18.1.3.5.1. Marketing Strategy

                18.1.3.5.2. Product Strategy

                18.1.3.5.3. Channel Strategy

        18.1.4. Robert Bosch GmbH

            18.1.4.1. Overview

            18.1.4.2. Product Portfolio

            18.1.4.3. Profitability by Market Segments

            18.1.4.4. Sales Footprint

            18.1.4.5. Strategy Overview

                18.1.4.5.1. Marketing Strategy

                18.1.4.5.2. Product Strategy

                18.1.4.5.3. Channel Strategy

        18.1.5. Shanghai Develop Machinery Co. Limited

            18.1.5.1. Overview

            18.1.5.2. Product Portfolio

            18.1.5.3. Profitability by Market Segments

            18.1.5.4. Sales Footprint

            18.1.5.5. Strategy Overview

                18.1.5.5.1. Marketing Strategy

                18.1.5.5.2. Product Strategy

                18.1.5.5.3. Channel Strategy

        18.1.6. Shanghai Jiuwu Pharmtech Machinery Co. Ltd.

            18.1.6.1. Overview

            18.1.6.2. Product Portfolio

            18.1.6.3. Profitability by Market Segments

            18.1.6.4. Sales Footprint

            18.1.6.5. Strategy Overview

                18.1.6.5.1. Marketing Strategy

                18.1.6.5.2. Product Strategy

                18.1.6.5.3. Channel Strategy

        18.1.7. Shanghai TIWIN Industry Co. Ltd.

            18.1.7.1. Overview

            18.1.7.2. Product Portfolio

            18.1.7.3. Profitability by Market Segments

            18.1.7.4. Sales Footprint

            18.1.7.5. Strategy Overview

                18.1.7.5.1. Marketing Strategy

                18.1.7.5.2. Product Strategy

                18.1.7.5.3. Channel Strategy

        18.1.8. Wenzhou Ouya Machinery Co. Ltd.

            18.1.8.1. Overview

            18.1.8.2. Product Portfolio

            18.1.8.3. Profitability by Market Segments

            18.1.8.4. Sales Footprint

            18.1.8.5. Strategy Overview

                18.1.8.5.1. Marketing Strategy

                18.1.8.5.2. Product Strategy

                18.1.8.5.3. Channel Strategy

        18.1.9. Zhuhai Ting Kai Trading Co. Ltd.

            18.1.9.1. Overview

            18.1.9.2. Product Portfolio

            18.1.9.3. Profitability by Market Segments

            18.1.9.4. Sales Footprint

            18.1.9.5. Strategy Overview

                18.1.9.5.1. Marketing Strategy

                18.1.9.5.2. Product Strategy

                18.1.9.5.3. Channel Strategy

        18.1.10. Shanghai Pharmaceutical Machinery Co. Ltd.

            18.1.10.1. Overview

            18.1.10.2. Product Portfolio

            18.1.10.3. Profitability by Market Segments

            18.1.10.4. Sales Footprint

            18.1.10.5. Strategy Overview

                18.1.10.5.1. Marketing Strategy

                18.1.10.5.2. Product Strategy

                18.1.10.5.3. Channel Strategy

19. Assumptions & Acronyms Used

20. Research Methodology

List of Tables

Table 1: Global Market Value (US$ Million) Forecast by Region, 2018 to 2033

Table 2: Global Market Volume (Units) Forecast by Region, 2018 to 2033

Table 3: Global Market Value (US$ Million) Forecast by Operation Type, 2018 to 2033

Table 4: Global Market Volume (Units) Forecast by Operation Type, 2018 to 2033

Table 5: Global Market Value (US$ Million) Forecast by Capacity Type, 2018 to 2033

Table 6: Global Market Volume (Units) Forecast by Capacity Type, 2018 to 2033

Table 7: Global Market Value (US$ Million) Forecast by Dosage Type, 2018 to 2033

Table 8: Global Market Volume (Units) Forecast by Dosage Type, 2018 to 2033

Table 9: North America Market Value (US$ Million) Forecast by Country, 2018 to 2033

Table 10: North America Market Volume (Units) Forecast by Country, 2018 to 2033

Table 11: North America Market Value (US$ Million) Forecast by Operation Type, 2018 to 2033

Table 12: North America Market Volume (Units) Forecast by Operation Type, 2018 to 2033

Table 13: North America Market Value (US$ Million) Forecast by Capacity Type, 2018 to 2033

Table 14: North America Market Volume (Units) Forecast by Capacity Type, 2018 to 2033

Table 15: North America Market Value (US$ Million) Forecast by Dosage Type, 2018 to 2033

Table 16: North America Market Volume (Units) Forecast by Dosage Type, 2018 to 2033

Table 17: Latin America Market Value (US$ Million) Forecast by Country, 2018 to 2033

Table 18: Latin America Market Volume (Units) Forecast by Country, 2018 to 2033

Table 19: Latin America Market Value (US$ Million) Forecast by Operation Type, 2018 to 2033

Table 20: Latin America Market Volume (Units) Forecast by Operation Type, 2018 to 2033

Table 21: Latin America Market Value (US$ Million) Forecast by Capacity Type, 2018 to 2033

Table 22: Latin America Market Volume (Units) Forecast by Capacity Type, 2018 to 2033

Table 23: Latin America Market Value (US$ Million) Forecast by Dosage Type, 2018 to 2033

Table 24: Latin America Market Volume (Units) Forecast by Dosage Type, 2018 to 2033

Table 25: Western Europe Market Value (US$ Million) Forecast by Country, 2018 to 2033

Table 26: Western Europe Market Volume (Units) Forecast by Country, 2018 to 2033

Table 27: Western Europe Market Value (US$ Million) Forecast by Operation Type, 2018 to 2033

Table 28: Western Europe Market Volume (Units) Forecast by Operation Type, 2018 to 2033

Table 29: Western Europe Market Value (US$ Million) Forecast by Capacity Type, 2018 to 2033

Table 30: Western Europe Market Volume (Units) Forecast by Capacity Type, 2018 to 2033

Table 31: Western Europe Market Value (US$ Million) Forecast by Dosage Type, 2018 to 2033

Table 32: Western Europe Market Volume (Units) Forecast by Dosage Type, 2018 to 2033

Table 33: Eastern Europe Market Value (US$ Million) Forecast by Country, 2018 to 2033

Table 34: Eastern Europe Market Volume (Units) Forecast by Country, 2018 to 2033

Table 35: Eastern Europe Market Value (US$ Million) Forecast by Operation Type, 2018 to 2033

Table 36: Eastern Europe Market Volume (Units) Forecast by Operation Type, 2018 to 2033

Table 37: Eastern Europe Market Value (US$ Million) Forecast by Capacity Type, 2018 to 2033

Table 38: Eastern Europe Market Volume (Units) Forecast by Capacity Type, 2018 to 2033

Table 39: Eastern Europe Market Value (US$ Million) Forecast by Dosage Type, 2018 to 2033

Table 40: Eastern Europe Market Volume (Units) Forecast by Dosage Type, 2018 to 2033

Table 41: South Asia and Pacific Market Value (US$ Million) Forecast by Country, 2018 to 2033

Table 42: South Asia and Pacific Market Volume (Units) Forecast by Country, 2018 to 2033

Table 43: South Asia and Pacific Market Value (US$ Million) Forecast by Operation Type, 2018 to 2033

Table 44: South Asia and Pacific Market Volume (Units) Forecast by Operation Type, 2018 to 2033

Table 45: South Asia and Pacific Market Value (US$ Million) Forecast by Capacity Type, 2018 to 2033

Table 46: South Asia and Pacific Market Volume (Units) Forecast by Capacity Type, 2018 to 2033

Table 47: South Asia and Pacific Market Value (US$ Million) Forecast by Dosage Type, 2018 to 2033

Table 48: South Asia and Pacific Market Volume (Units) Forecast by Dosage Type, 2018 to 2033

Table 49: East Asia Market Value (US$ Million) Forecast by Country, 2018 to 2033

Table 50: East Asia Market Volume (Units) Forecast by Country, 2018 to 2033

Table 51: East Asia Market Value (US$ Million) Forecast by Operation Type, 2018 to 2033

Table 52: East Asia Market Volume (Units) Forecast by Operation Type, 2018 to 2033

Table 53: East Asia Market Value (US$ Million) Forecast by Capacity Type, 2018 to 2033

Table 54: East Asia Market Volume (Units) Forecast by Capacity Type, 2018 to 2033

Table 55: East Asia Market Value (US$ Million) Forecast by Dosage Type, 2018 to 2033

Table 56: East Asia Market Volume (Units) Forecast by Dosage Type, 2018 to 2033

Table 57: Middle East and Africa Market Value (US$ Million) Forecast by Country, 2018 to 2033

Table 58: Middle East and Africa Market Volume (Units) Forecast by Country, 2018 to 2033

Table 59: Middle East and Africa Market Value (US$ Million) Forecast by Operation Type, 2018 to 2033

Table 60: Middle East and Africa Market Volume (Units) Forecast by Operation Type, 2018 to 2033

Table 61: Middle East and Africa Market Value (US$ Million) Forecast by Capacity Type, 2018 to 2033

Table 62: Middle East and Africa Market Volume (Units) Forecast by Capacity Type, 2018 to 2033

Table 63: Middle East and Africa Market Value (US$ Million) Forecast by Dosage Type, 2018 to 2033

Table 64: Middle East and Africa Market Volume (Units) Forecast by Dosage Type, 2018 to 2033

List of Charts

Figure 1: Global Market Value (US$ Million) by Operation Type, 2023 to 2033

Figure 2: Global Market Value (US$ Million) by Capacity Type, 2023 to 2033

Figure 3: Global Market Value (US$ Million) by Dosage Type, 2023 to 2033

Figure 4: Global Market Value (US$ Million) by Region, 2023 to 2033

Figure 5: Global Market Value (US$ Million) Analysis by Region, 2018 to 2033

Figure 6: Global Market Volume (Units) Analysis by Region, 2018 to 2033

Figure 7: Global Market Value Share (%) and BPS Analysis by Region, 2023 to 2033

Figure 8: Global Market Y-o-Y Growth (%) Projections by Region, 2023 to 2033

Figure 9: Global Market Value (US$ Million) Analysis by Operation Type, 2018 to 2033

Figure 10: Global Market Volume (Units) Analysis by Operation Type, 2018 to 2033

Figure 11: Global Market Value Share (%) and BPS Analysis by Operation Type, 2023 to 2033

Figure 12: Global Market Y-o-Y Growth (%) Projections by Operation Type, 2023 to 2033

Figure 13: Global Market Value (US$ Million) Analysis by Capacity Type, 2018 to 2033

Figure 14: Global Market Volume (Units) Analysis by Capacity Type, 2018 to 2033

Figure 15: Global Market Value Share (%) and BPS Analysis by Capacity Type, 2023 to 2033

Figure 16: Global Market Y-o-Y Growth (%) Projections by Capacity Type, 2023 to 2033

Figure 17: Global Market Value (US$ Million) Analysis by Dosage Type, 2018 to 2033

Figure 18: Global Market Volume (Units) Analysis by Dosage Type, 2018 to 2033

Figure 19: Global Market Value Share (%) and BPS Analysis by Dosage Type, 2023 to 2033

Figure 20: Global Market Y-o-Y Growth (%) Projections by Dosage Type, 2023 to 2033

Figure 21: Global Market Attractiveness by Operation Type, 2023 to 2033

Figure 22: Global Market Attractiveness by Capacity Type, 2023 to 2033

Figure 23: Global Market Attractiveness by Dosage Type, 2023 to 2033

Figure 24: Global Market Attractiveness by Region, 2023 to 2033

Figure 25: North America Market Value (US$ Million) by Operation Type, 2023 to 2033

Figure 26: North America Market Value (US$ Million) by Capacity Type, 2023 to 2033

Figure 27: North America Market Value (US$ Million) by Dosage Type, 2023 to 2033

Figure 28: North America Market Value (US$ Million) by Country, 2023 to 2033

Figure 29: North America Market Value (US$ Million) Analysis by Country, 2018 to 2033

Figure 30: North America Market Volume (Units) Analysis by Country, 2018 to 2033

Figure 31: North America Market Value Share (%) and BPS Analysis by Country, 2023 to 2033

Figure 32: North America Market Y-o-Y Growth (%) Projections by Country, 2023 to 2033

Figure 33: North America Market Value (US$ Million) Analysis by Operation Type, 2018 to 2033

Figure 34: North America Market Volume (Units) Analysis by Operation Type, 2018 to 2033

Figure 35: North America Market Value Share (%) and BPS Analysis by Operation Type, 2023 to 2033

Figure 36: North America Market Y-o-Y Growth (%) Projections by Operation Type, 2023 to 2033

Figure 37: North America Market Value (US$ Million) Analysis by Capacity Type, 2018 to 2033

Figure 38: North America Market Volume (Units) Analysis by Capacity Type, 2018 to 2033

Figure 39: North America Market Value Share (%) and BPS Analysis by Capacity Type, 2023 to 2033

Figure 40: North America Market Y-o-Y Growth (%) Projections by Capacity Type, 2023 to 2033

Figure 41: North America Market Value (US$ Million) Analysis by Dosage Type, 2018 to 2033

Figure 42: North America Market Volume (Units) Analysis by Dosage Type, 2018 to 2033

Figure 43: North America Market Value Share (%) and BPS Analysis by Dosage Type, 2023 to 2033

Figure 44: North America Market Y-o-Y Growth (%) Projections by Dosage Type, 2023 to 2033

Figure 45: North America Market Attractiveness by Operation Type, 2023 to 2033

Figure 46: North America Market Attractiveness by Capacity Type, 2023 to 2033

Figure 47: North America Market Attractiveness by Dosage Type, 2023 to 2033

Figure 48: North America Market Attractiveness by Country, 2023 to 2033

Figure 49: Latin America Market Value (US$ Million) by Operation Type, 2023 to 2033

Figure 50: Latin America Market Value (US$ Million) by Capacity Type, 2023 to 2033

Figure 51: Latin America Market Value (US$ Million) by Dosage Type, 2023 to 2033

Figure 52: Latin America Market Value (US$ Million) by Country, 2023 to 2033

Figure 53: Latin America Market Value (US$ Million) Analysis by Country, 2018 to 2033

Figure 54: Latin America Market Volume (Units) Analysis by Country, 2018 to 2033

Figure 55: Latin America Market Value Share (%) and BPS Analysis by Country, 2023 to 2033

Figure 56: Latin America Market Y-o-Y Growth (%) Projections by Country, 2023 to 2033

Figure 57: Latin America Market Value (US$ Million) Analysis by Operation Type, 2018 to 2033

Figure 58: Latin America Market Volume (Units) Analysis by Operation Type, 2018 to 2033

Figure 59: Latin America Market Value Share (%) and BPS Analysis by Operation Type, 2023 to 2033

Figure 60: Latin America Market Y-o-Y Growth (%) Projections by Operation Type, 2023 to 2033

Figure 61: Latin America Market Value (US$ Million) Analysis by Capacity Type, 2018 to 2033

Figure 62: Latin America Market Volume (Units) Analysis by Capacity Type, 2018 to 2033

Figure 63: Latin America Market Value Share (%) and BPS Analysis by Capacity Type, 2023 to 2033

Figure 64: Latin America Market Y-o-Y Growth (%) Projections by Capacity Type, 2023 to 2033

Figure 65: Latin America Market Value (US$ Million) Analysis by Dosage Type, 2018 to 2033

Figure 66: Latin America Market Volume (Units) Analysis by Dosage Type, 2018 to 2033

Figure 67: Latin America Market Value Share (%) and BPS Analysis by Dosage Type, 2023 to 2033

Figure 68: Latin America Market Y-o-Y Growth (%) Projections by Dosage Type, 2023 to 2033

Figure 69: Latin America Market Attractiveness by Operation Type, 2023 to 2033

Figure 70: Latin America Market Attractiveness by Capacity Type, 2023 to 2033

Figure 71: Latin America Market Attractiveness by Dosage Type, 2023 to 2033

Figure 72: Latin America Market Attractiveness by Country, 2023 to 2033

Figure 73: Western Europe Market Value (US$ Million) by Operation Type, 2023 to 2033

Figure 74: Western Europe Market Value (US$ Million) by Capacity Type, 2023 to 2033

Figure 75: Western Europe Market Value (US$ Million) by Dosage Type, 2023 to 2033

Figure 76: Western Europe Market Value (US$ Million) by Country, 2023 to 2033

Figure 77: Western Europe Market Value (US$ Million) Analysis by Country, 2018 to 2033

Figure 78: Western Europe Market Volume (Units) Analysis by Country, 2018 to 2033

Figure 79: Western Europe Market Value Share (%) and BPS Analysis by Country, 2023 to 2033

Figure 80: Western Europe Market Y-o-Y Growth (%) Projections by Country, 2023 to 2033

Figure 81: Western Europe Market Value (US$ Million) Analysis by Operation Type, 2018 to 2033

Figure 82: Western Europe Market Volume (Units) Analysis by Operation Type, 2018 to 2033

Figure 83: Western Europe Market Value Share (%) and BPS Analysis by Operation Type, 2023 to 2033

Figure 84: Western Europe Market Y-o-Y Growth (%) Projections by Operation Type, 2023 to 2033

Figure 85: Western Europe Market Value (US$ Million) Analysis by Capacity Type, 2018 to 2033

Figure 86: Western Europe Market Volume (Units) Analysis by Capacity Type, 2018 to 2033

Figure 87: Western Europe Market Value Share (%) and BPS Analysis by Capacity Type, 2023 to 2033

Figure 88: Western Europe Market Y-o-Y Growth (%) Projections by Capacity Type, 2023 to 2033

Figure 89: Western Europe Market Value (US$ Million) Analysis by Dosage Type, 2018 to 2033

Figure 90: Western Europe Market Volume (Units) Analysis by Dosage Type, 2018 to 2033

Figure 91: Western Europe Market Value Share (%) and BPS Analysis by Dosage Type, 2023 to 2033

Figure 92: Western Europe Market Y-o-Y Growth (%) Projections by Dosage Type, 2023 to 2033

Figure 93: Western Europe Market Attractiveness by Operation Type, 2023 to 2033

Figure 94: Western Europe Market Attractiveness by Capacity Type, 2023 to 2033

Figure 95: Western Europe Market Attractiveness by Dosage Type, 2023 to 2033

Figure 96: Western Europe Market Attractiveness by Country, 2023 to 2033

Figure 97: Eastern Europe Market Value (US$ Million) by Operation Type, 2023 to 2033

Figure 98: Eastern Europe Market Value (US$ Million) by Capacity Type, 2023 to 2033

Figure 99: Eastern Europe Market Value (US$ Million) by Dosage Type, 2023 to 2033

Figure 100: Eastern Europe Market Value (US$ Million) by Country, 2023 to 2033

Figure 101: Eastern Europe Market Value (US$ Million) Analysis by Country, 2018 to 2033

Figure 102: Eastern Europe Market Volume (Units) Analysis by Country, 2018 to 2033

Figure 103: Eastern Europe Market Value Share (%) and BPS Analysis by Country, 2023 to 2033

Figure 104: Eastern Europe Market Y-o-Y Growth (%) Projections by Country, 2023 to 2033

Figure 105: Eastern Europe Market Value (US$ Million) Analysis by Operation Type, 2018 to 2033

Figure 106: Eastern Europe Market Volume (Units) Analysis by Operation Type, 2018 to 2033

Figure 107: Eastern Europe Market Value Share (%) and BPS Analysis by Operation Type, 2023 to 2033

Figure 108: Eastern Europe Market Y-o-Y Growth (%) Projections by Operation Type, 2023 to 2033

Figure 109: Eastern Europe Market Value (US$ Million) Analysis by Capacity Type, 2018 to 2033

Figure 110: Eastern Europe Market Volume (Units) Analysis by Capacity Type, 2018 to 2033

Figure 111: Eastern Europe Market Value Share (%) and BPS Analysis by Capacity Type, 2023 to 2033

Figure 112: Eastern Europe Market Y-o-Y Growth (%) Projections by Capacity Type, 2023 to 2033

Figure 113: Eastern Europe Market Value (US$ Million) Analysis by Dosage Type, 2018 to 2033

Figure 114: Eastern Europe Market Volume (Units) Analysis by Dosage Type, 2018 to 2033

Figure 115: Eastern Europe Market Value Share (%) and BPS Analysis by Dosage Type, 2023 to 2033

Figure 116: Eastern Europe Market Y-o-Y Growth (%) Projections by Dosage Type, 2023 to 2033

Figure 117: Eastern Europe Market Attractiveness by Operation Type, 2023 to 2033

Figure 118: Eastern Europe Market Attractiveness by Capacity Type, 2023 to 2033

Figure 119: Eastern Europe Market Attractiveness by Dosage Type, 2023 to 2033

Figure 120: Eastern Europe Market Attractiveness by Country, 2023 to 2033

Figure 121: South Asia and Pacific Market Value (US$ Million) by Operation Type, 2023 to 2033

Figure 122: South Asia and Pacific Market Value (US$ Million) by Capacity Type, 2023 to 2033

Figure 123: South Asia and Pacific Market Value (US$ Million) by Dosage Type, 2023 to 2033

Figure 124: South Asia and Pacific Market Value (US$ Million) by Country, 2023 to 2033

Figure 125: South Asia and Pacific Market Value (US$ Million) Analysis by Country, 2018 to 2033

Figure 126: South Asia and Pacific Market Volume (Units) Analysis by Country, 2018 to 2033

Figure 127: South Asia and Pacific Market Value Share (%) and BPS Analysis by Country, 2023 to 2033

Figure 128: South Asia and Pacific Market Y-o-Y Growth (%) Projections by Country, 2023 to 2033

Figure 129: South Asia and Pacific Market Value (US$ Million) Analysis by Operation Type, 2018 to 2033

Figure 130: South Asia and Pacific Market Volume (Units) Analysis by Operation Type, 2018 to 2033

Figure 131: South Asia and Pacific Market Value Share (%) and BPS Analysis by Operation Type, 2023 to 2033

Figure 132: South Asia and Pacific Market Y-o-Y Growth (%) Projections by Operation Type, 2023 to 2033

Figure 133: South Asia and Pacific Market Value (US$ Million) Analysis by Capacity Type, 2018 to 2033

Figure 134: South Asia and Pacific Market Volume (Units) Analysis by Capacity Type, 2018 to 2033

Figure 135: South Asia and Pacific Market Value Share (%) and BPS Analysis by Capacity Type, 2023 to 2033

Figure 136: South Asia and Pacific Market Y-o-Y Growth (%) Projections by Capacity Type, 2023 to 2033

Figure 137: South Asia and Pacific Market Value (US$ Million) Analysis by Dosage Type, 2018 to 2033

Figure 138: South Asia and Pacific Market Volume (Units) Analysis by Dosage Type, 2018 to 2033

Figure 139: South Asia and Pacific Market Value Share (%) and BPS Analysis by Dosage Type, 2023 to 2033

Figure 140: South Asia and Pacific Market Y-o-Y Growth (%) Projections by Dosage Type, 2023 to 2033

Figure 141: South Asia and Pacific Market Attractiveness by Operation Type, 2023 to 2033

Figure 142: South Asia and Pacific Market Attractiveness by Capacity Type, 2023 to 2033

Figure 143: South Asia and Pacific Market Attractiveness by Dosage Type, 2023 to 2033

Figure 144: South Asia and Pacific Market Attractiveness by Country, 2023 to 2033

Figure 145: East Asia Market Value (US$ Million) by Operation Type, 2023 to 2033

Figure 146: East Asia Market Value (US$ Million) by Capacity Type, 2023 to 2033

Figure 147: East Asia Market Value (US$ Million) by Dosage Type, 2023 to 2033

Figure 148: East Asia Market Value (US$ Million) by Country, 2023 to 2033

Figure 149: East Asia Market Value (US$ Million) Analysis by Country, 2018 to 2033

Figure 150: East Asia Market Volume (Units) Analysis by Country, 2018 to 2033

Figure 151: East Asia Market Value Share (%) and BPS Analysis by Country, 2023 to 2033

Figure 152: East Asia Market Y-o-Y Growth (%) Projections by Country, 2023 to 2033

Figure 153: East Asia Market Value (US$ Million) Analysis by Operation Type, 2018 to 2033

Figure 154: East Asia Market Volume (Units) Analysis by Operation Type, 2018 to 2033

Figure 155: East Asia Market Value Share (%) and BPS Analysis by Operation Type, 2023 to 2033

Figure 156: East Asia Market Y-o-Y Growth (%) Projections by Operation Type, 2023 to 2033

Figure 157: East Asia Market Value (US$ Million) Analysis by Capacity Type, 2018 to 2033

Figure 158: East Asia Market Volume (Units) Analysis by Capacity Type, 2018 to 2033

Figure 159: East Asia Market Value Share (%) and BPS Analysis by Capacity Type, 2023 to 2033

Figure 160: East Asia Market Y-o-Y Growth (%) Projections by Capacity Type, 2023 to 2033

Figure 161: East Asia Market Value (US$ Million) Analysis by Dosage Type, 2018 to 2033

Figure 162: East Asia Market Volume (Units) Analysis by Dosage Type, 2018 to 2033

Figure 163: East Asia Market Value Share (%) and BPS Analysis by Dosage Type, 2023 to 2033

Figure 164: East Asia Market Y-o-Y Growth (%) Projections by Dosage Type, 2023 to 2033

Figure 165: East Asia Market Attractiveness by Operation Type, 2023 to 2033

Figure 166: East Asia Market Attractiveness by Capacity Type, 2023 to 2033

Figure 167: East Asia Market Attractiveness by Dosage Type, 2023 to 2033

Figure 168: East Asia Market Attractiveness by Country, 2023 to 2033

Figure 169: Middle East and Africa Market Value (US$ Million) by Operation Type, 2023 to 2033

Figure 170: Middle East and Africa Market Value (US$ Million) by Capacity Type, 2023 to 2033

Figure 171: Middle East and Africa Market Value (US$ Million) by Dosage Type, 2023 to 2033

Figure 172: Middle East and Africa Market Value (US$ Million) by Country, 2023 to 2033

Figure 173: Middle East and Africa Market Value (US$ Million) Analysis by Country, 2018 to 2033

Figure 174: Middle East and Africa Market Volume (Units) Analysis by Country, 2018 to 2033

Figure 175: Middle East and Africa Market Value Share (%) and BPS Analysis by Country, 2023 to 2033

Figure 176: Middle East and Africa Market Y-o-Y Growth (%) Projections by Country, 2023 to 2033

Figure 177: Middle East and Africa Market Value (US$ Million) Analysis by Operation Type, 2018 to 2033

Figure 178: Middle East and Africa Market Volume (Units) Analysis by Operation Type, 2018 to 2033

Figure 179: Middle East and Africa Market Value Share (%) and BPS Analysis by Operation Type, 2023 to 2033

Figure 180: Middle East and Africa Market Y-o-Y Growth (%) Projections by Operation Type, 2023 to 2033

Figure 181: Middle East and Africa Market Value (US$ Million) Analysis by Capacity Type, 2018 to 2033

Figure 182: Middle East and Africa Market Volume (Units) Analysis by Capacity Type, 2018 to 2033

Figure 183: Middle East and Africa Market Value Share (%) and BPS Analysis by Capacity Type, 2023 to 2033

Figure 184: Middle East and Africa Market Y-o-Y Growth (%) Projections by Capacity Type, 2023 to 2033

Figure 185: Middle East and Africa Market Value (US$ Million) Analysis by Dosage Type, 2018 to 2033

Figure 186: Middle East and Africa Market Volume (Units) Analysis by Dosage Type, 2018 to 2033

Figure 187: Middle East and Africa Market Value Share (%) and BPS Analysis by Dosage Type, 2023 to 2033

Figure 188: Middle East and Africa Market Y-o-Y Growth (%) Projections by Dosage Type, 2023 to 2033

Figure 189: Middle East and Africa Market Attractiveness by Operation Type, 2023 to 2033

Figure 190: Middle East and Africa Market Attractiveness by Capacity Type, 2023 to 2033

Figure 191: Middle East and Africa Market Attractiveness by Dosage Type, 2023 to 2033

Figure 192: Middle East and Africa Market Attractiveness by Country, 2023 to 2033

Recommendations

Healthcare

Empty Capsule Market

Published : January 2024

Packaging

Liquid Capsule Filling Machines Market

Published : May 2023

Explore Packaging Insights

View Reports

Capsule Filling Machines Market