Reports

- Global Locations -

Headquarters

Future Market Insights, Inc.

Christiana Corporate, 200
Continental Drive, Suite 401,
Newark, Delaware - 19713,
United States

T: +1-845-579-5705

Americas

Future Market Insights, Inc.

616 Corporate Way, Suite 2-9018,
Valley Cottage, NY 10989, United States

T: +1-347-918-3531

MEA

Future Market Insights

1602-6 Jumeirah Bay X2 Tower, Plot No: JLT-PH2-X2A,
Jumeirah Lakes Towers, Dubai,
United Arab Emirates

Europe

Future Market Insights

3rd Floor, 207 Regent Street,
W1B 3HH London
United Kingdom

T: + 44 (0) 20 8123 9659
D: +44 (0) 20 3287 4268

Asia Pacific

Future Market Insights

Office No. 401-A, 4th Floor,
VANTAGE 9, S.No. 36/1/1,
Baner, Pune 411045, India

Empty Capsules Market Outlook (2023 to 2033)

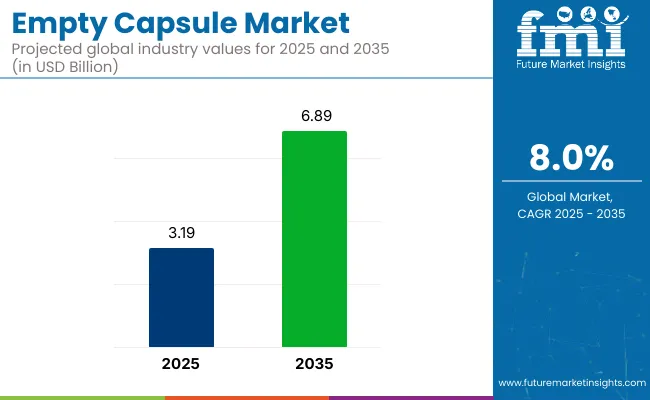
The global sales of empty capsules are anticipated to reach US$ 2.3 Billion in 2023. The market is further expected to increase at 7.9% CAGR during the forecast period, totaling a valuation of US$ 4.9 Billion by 2033.

The rising consumption of numerous drugs coupled with the increasing popularity of capsules over other drug delivery forms is a major factor boosting the sales of empty capsules. As the global burden of chronic disease continues to rise, demand for therapeutics is anticipated to increase at a substantial pace. This is, in turn, expected to generate lucrative growth prospects for the suppliers of empty capsules.

People, especially the geriatric population, prefer to consume capsules over other forms due to their easy-to-use nature. Consumer inclination towards capsules will continue to encourage manufacturers to increase the production of empty capsules during the forecast period. As a result, a positive trajectory has been predicted for the empty capsules market growth by Future Market Insights for the assessment period.

Empty capsules are protective shells for drugs made from special film-forming materials such as gelatin, starch, and pullulan. They have emerged as innovative drug delivery products used by leading pharmaceutical and biopharmaceutical companies due to their various attractive features.

These capsules are economical, oxidation resistant, offer maximum flexibility, and are easy to use on account of their smooth and slippery nature. They are especially suitable for substances having a bitter taste and unpleasant odor.

Further, the rising prevalence of numerous diseases worldwide coupled with growing consumer awareness about the benefits of capsules is expected to create ground for empty capsule market growth during the forecast period.

Currently, the empty pill capsules market accounts for around 1% share of the global drug delivery market. The flexibility of these fillable capsules is expected to substantially promote the use of empty pills in the nutraceutical and pharmaceutical sectors.

Similarly, the growing popularity of vegetarian empty capsules, coupled with the rapid growth of the global drug delivery solutions market, is anticipated to push the sales of empty capsules during the forthcoming period.

Attribute Details
Empty Capsules Market Value (2023) US$ 2.3 Billion
Empty Capsules Market Forecast Value (2033) US$ 4.9 Billion
Empty Capsules Market CAGR (2023 to 2033) 7.9%

Don't pay for what you don't need

Customize your report by selecting specific countries or regions and save 30%!

How The Market Progressed till June 2022?

Particulars Details
H1, 2021 7.79%
H1, 2022 Projected 7.93%
H1, 2022 Outlook 7.73%
BPS Change - H1, 2022 (O) - H1, 2022 (P) (-) 20 ↓
BPS Change - H1, 2022 (O) - H1, 2021 (-) 06 ↓

The variation between the BPS values observed within this market in H1, 2022 - outlook over H1, 2022 projected reflects a decline of 20 units. A reduced BPS growth in H1-2022 over H1-2021 by 06 Basis Point Share (BPS) is demonstrated by the market.

The factors associated with the reduction in the BPS values are the costs associated with raw material sourcing, such as for gelatin. Moreover, the introduction of synthetic sources for the production of empty capsules has further provided a pull toward the observed decline in the BPS values.

The market is subject to changes in relevance to the regulatory impositions for gelatin sourcing, and licensing for distribution, as per the macro and industry standards. The key developments in the market include the development of natural alternatives to raw material sourcing of gelatin.

Moreover, considerations in the packaging of empty capsules to enhance the integrity of the product and avoid contamination, have provided solutions to the dissolution of the capsules. These measures are thus expected to enhance the sales outlook of the empty capsules market during the forecast years.

Empty Capsule Consumption Analysis (2018 to 2022) Vs Market Estimates (2023 to 2033)

The global sales of empty capsules are slated to rise at a healthy CAGR of 7.9% between 2023 and 2033 in comparison to 7% registered from 2018 to 2022. The rising adoption of capsule formulations, the surge in chronic diseases worldwide, and advancements in capsule delivery technologies are some of the key factors boosting the empty capsules market growth during the forecast period.

Empty capsules have emerged as ideal drug delivery products on account of their ability to protect sensitive substances from oxidation as well as their user-friendly nature. These capsules are usually smooth and slippery which makes them easy to swallow.

They are being used by pharmaceutical and biopharmaceutical companies to encapsulate liquids, powders, granulates, oils, extracts, and even herbs. Rising production and consumption of empty capsules to cater to the rising demand from the pharmaceutical industry is projected to continue boosting empty capsules market growth during the assessment period.

Over the last few decades, encapsulated capsules have garnered special attraction for the encapsulation of unpalatable medicines. The empty capsule suppliers are using various strategies to increase sales. They are focusing on developing innovative capsule materials that not only help to deliver medicine but also perform other functions as well. This will help them to woo more and more customers.

Similarly, the rapid expansion of the gelatin capsules market across various opportunistic regions such as North America and Europe is projected to further boost the growth of the empty capsules market during the assessment period. Consumers are inclined towards using gelatin capsules due to their various benefits such as easy digestion, increased bioavailability, and several health advantages. It is believed that gelatin can help people suffering from arthritis and other joint and skin conditions.

Additionally, the growing popularity of vegetarian empty capsules especially among the vegan population is further predicted to aid empty capsules market growth during the forthcoming period.

Historical CAGR (2017 to 2022) 7%
Forecast CAGR (2023 to 2033) 7.9%
Sabyasachi Ghosh
Sabyasachi Ghosh

Principal Consultant

Talk to Analyst

Find your sweet spots for generating winning opportunities in this market.

Comparative Analysis of Adjacent Markets

Empty Capsules Market:

Differentiating Aspects Empty Capsules Market
CAGR (Forecast Period) 7.9%
Market Valuation in 2023 US$ 2.3 Billion
Projected Market Value in 2033 US$ 4.9 Billion
Growth Factors Enhancing demand for gelatin capsules due to their increased bioavailability and easy digestion
Trends The increasing popularity of vegetarian empty capsules due to the growing vegan population
Opportunities Rising investments into capacity expansions and the development of better vegetarian capsule formulations

Capsule Filling Machines Market:

Differentiating Aspects Capsule Filling Machines Market
CAGR (Forecast Period) 4.8%
Market Valuation in 2023 US$ 588.35 Million
Projected Market Value in 2033 US$ 940.26 Million
Growth Factors Increasing demand to maintain hygiene during capsule manufacturing
Trends Advancements in capsule filling machines with respect to speed and filling rate
Opportunities Increasing uptake of capsule filling machines by pharmaceutical manufacturers to gain economies of scale

Pharmaceutical Drug Delivery Market:

Differentiating Aspects Pharmaceutical Drug Delivery Market
CAGR (Forecast Period) 6%
Market Valuation in 2023 US$ 1797.76 Billion
Projected Market Value in 2033 US$ 3219.51 Billion
Growth Factors Expanding incidence rate of infectious diseases
Trends Surging FDA approvals for drugs
Opportunities Increasing Research and Development (R&D) expenditure on the development of innovative medicines

Which Region Will Emerge as the Most Lucrative Empty Capsules Market?

North America to Hold Highest Market Share in 2022 and Beyond

Currently, North America dominates the global empty capsules market with a share of more than 38.3%. Demand in the region is majorly driven by the rising consumption of pharmaceuticals and nutraceuticals and the presence of leading market players. Further, the growing consumer inclination towards vegetarian empty capsules, favorable government support, and rising demand for preventive care, are all propelling market expansion.

Europe empty capsules market is expected to grow at a healthy pace during the forecast period, with Germany and the United Kingdom leading from the forefront. Currently, Western Europe and Eastern Europe hold a market share of more than 18.8% and 7.8%, respectively. The rising geriatric population, increasing incidence of chronic and deficiency diseases, and rapid production of empty capsules are some of the factors triggering growth in these markets.

With over 9.7% of the global empty capsules market share, Latin America is forecast to experience significant growth during the forecast period.

Get the data you need at a Fraction of the cost

Personalize your report by choosing insights you need
and save 40%!

Country-wise Analysis

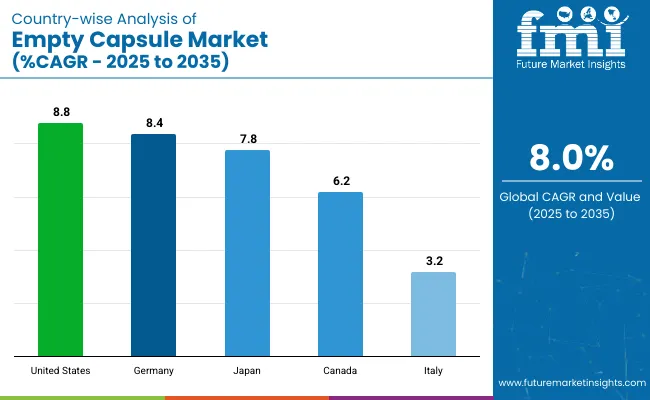
Country The USA
CAGR (2023 to 2033) 4%
Market Size (2033) US$ 996.3 Million
Country The United Kingdom
CAGR (2023 to 2033) 4.9%
Market Size (2033) US$ 122.7 Million
Country Germany
CAGR (2023 to 2033) 7.9%
Market Size (2033) US$ 269.6 Million
Country China
CAGR (2023 to 2033) 11.7%
Market Size (2033) US$ 279.3 Million
Country India
CAGR (2023 to 2033) 14.6%
Market Size (2033) US$ 606.9 Million

Why is the USA a Rewarding Market for Empty Capsules Suppliers?

Increasing Nutraceutical Consumption to Play Major Role in the USA Market

Attributes Details
Market Size (2033) US$ 996.3 Million
Market Absolute Dollar Growth (US$ Million/Billion) US$ 324.2 Million

Poor lifestyle habits in the USA have led to a substantial increase in demand for nutraceuticals to adjust proper nutrient intake. This is subsequently driving sales of empty supplement capsules and empty vitamin capsules.

Similarly, awareness regarding vegetarian empty capsules and the availability of technologically advanced empty capsule-filling machines are rising in the country. These factors are expected to propel sales of empty HPMC capsules and empty pullulan capsules in the USA through 2033.

Furthermore, the heavy presence of leading pharmaceutical giants and empty capsule companies in the USA is projected to further boost empty capsule sales in the forthcoming years.

Historical CAGR (2017 to 2022) 4.4%
Forecast CAGR (2023 to 2033) 4%

Germany to Have Significant Share in the Europe Market

Attributes Details
Market Size (2033) US$ 269.6 Million
Market Absolute Dollar Growth (US$ Million/Billion) US$ 143.3 Million

The German empty capsules market is committed to the growth of the Europe region. By 2033, the German market is pegged to reach US$ 269.6 Million, expanding at a CAGR of 7.9% in the meantime. Manufacturers operating in the region are making efforts to maintain a permanent stock of commonly required capsule types and sizes in their warehouses, to enable prompt dispatch of any orders.

Eurokapsule™, a renowned and established European brand, provides quality empty hard capsules to consumers across European markets. These empty hard capsules are used for dietary supplements, pharmaceutics, and nutraceuticals, which are gaining increasing traction due to expanding healthcare sector in the region. Core benefits provided by the brand, including high-quality capsules at competitive pricing, excellent machinability, and on-time deliveries, are projected to improve the sales of empty capsules.

Historical CAGR (2017 to 2022) 8.4%
Forecast CAGR (2023 to 2033) 7.9%

Why are Empty Capsule Producers Eyeing Japan?

High Geriatric Population in Japan to Drive Empty Medicine Capsule Sales

Empty medicine capsule consumption is anticipated to rise at a healthy pace in Japan owing to increasing usage by the geriatric population and growing consumer awareness about the benefits of capsules over other forms.

Similarly, rising investments in the healthcare industry and expansion of the pharmaceutical sector are expected to propel demand in Japan.

Currently, Japan holds a significant share of more than 8.5% in the global empty capsules market. Empty vitamin capsules and empty supplement capsules are also anticipated to see a rise in popularity in the country.

Furthermore, the availability of advanced empty capsule filling machines along with the rapid growth of the gelation empty capsules market are expected to favor market growth in the country during the forecast period.

Commercialization of Enteric Capsules to Propel the Indian Market

Attributes Details
Market Size (2033) US$ 606.9 Billion
Market Absolute Dollar Growth (US$ Million/Billion) US$ 451.9 Billion

Manufacturers are tapping into the swiftly growing markets in the developing stage. India, exhibiting fast-paced development in recent years, is being considered a lucrative place for future growth. Many key players are extending their geographic reach into the Indian market, to attain profitable revenues in the coming years. In addition to this, the commercially available enteric capsules prepared for clinical evaluation or individual therapy, are projected to propel market growth.

These commercially hard enteric capsules are developed to safeguard the drugs from the acidic environment of the stomach. These capsules, made of pH-soluble polymers, release their content while passing through the digestive tract. The practical application of these empty capsules is projected to bolster market growth over the coming years.

Historical CAGR (2017 to 2022) 13%
Forecast CAGR (2023 to 2033) 14.6%

Category-wise Analysis

Taxonomy Product Type
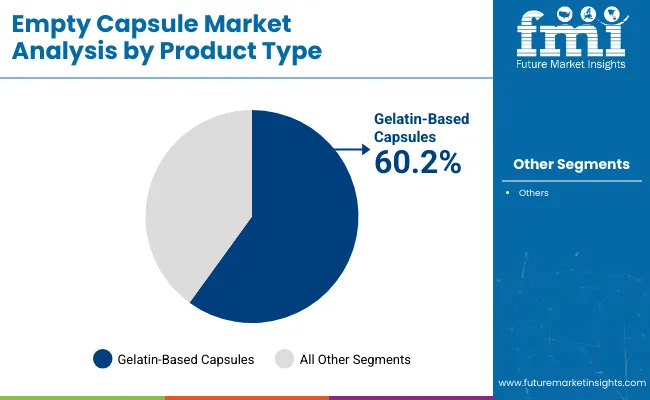
Top Segment Gelatin Based Capsules
Forecast CAGR 6.4%
Taxonomy Raw Material
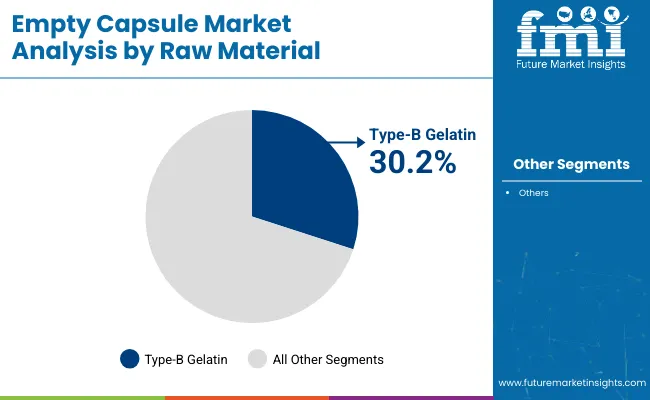
Top Segment Type-B Gelatin
Forecast CAGR 6.6%

Which Category Can Be Profitable for Market Players?

Hard Gelatin Empty Capsules to Hold Prominent Market Share

Based on product type, empty gelatin capsules are set to hold a dominant market share over the forecast period. Gelatin-based capsules, especially 00 gelatin capsules, 000 gelatin capsules, size 5 gelatin capsules, and size 3 gelatin capsules are projected to gain traction through 2033.

The rising adoption of gelatin (hard) - based capsules is due to their ability to efficiently hold specialty APIs (active pharmaceutical ingredients).

Historical CAGR (2017 to 2022) 5.6%
Forecast CAGR (2023 to 2033) 6.4%

Which End User Segment Will Provide Maximum Growth Opportunities for the Manufacturers of Empty Capsules?

Cosmetic & Nutraceutical Companies Segment to Hold Lion’s Share

In recent years, there has been a substantial increase in nutraceutical intake to boost immunity and make up for the nutrition lost due to bad eating habits and irregularities of a sedentary lifestyle. People are consuming supplement capsules like vitamins, minerals, oils, etc. on large scales.

The rising prevalence of deficiency diseases is propelling market growth. In addition to this, the growing health awareness among people and rapid expansion of the nutraceuticals industry is projected to support the segment growth during the forecast period.

Key Players Supplying Empty Capsules to Compete for Increased Global Footprint

The global empty capsules market is highly competitive in nature with leading empty pill manufacturers accounting for over 70% share. Key market players are constantly introducing new products made from innovative materials. Besides this, they are adopting growth strategies such as partnerships, mergers, acquisitions, etc. to expand their global footprint. For instance,

  • In October 2020, Lonza announced the expansion of capsule manufacturing capacity by investing an amount of US$ 93 Million in its Capsules and Health Ingredients (CHI) division.
  • In November 2020, GENEVA, Roquette, launched its market-first pea starch technology, LYCAGEL, offering a pharmaceutical-grade solution for vegetarian softgel capsule formulations.

List encompassing key players operating in empty capsules market

  • ACG Worldwide
  • Capsugel
  • Qualicaps Inc.
  • Bright Pharma Caps Inc.
  • Sunil Healthcare Ltd.
  • CapsCanada Corporation
  • Roxlor LLC
  • Snail Pharma Industry Co. Ltd.
  • Suheung Co. Ltd.
  • Medi-Caps Ltd.

Empty Capsules Industry Report Scope

FMI’s latest analysis presents a complete packaged solution for the empty capsules market by discussing in detail various growth factors, restraints, current trends, and emerging opportunities across various regional pockets.

The report provides valuable insights into consumer demands, sales prospects, and innovations in empty capsules. It boosts customer experience with its comprehensive and compelling details.

FMI also identifies why North America’s dominance is sealed in the empty capsules market. It discusses in detail trends pushing sales of empty capsules across Asia Pacific nations like India and China.

The study attempts to highlight the influence of changing consumer preference for vegetarian empty capsules on market growth. Besides this, a scientific approach has been followed to provide reliable data about the market share of various regions and categories.

Uncover the key factors behind the flourishing empty capsules industry with Future Market Insights latest market report.

Attribute Details
Forecast Period 2023 to 2033
Historical Data Available for 2018 to 2022
Market Analysis USD million/billion for Value and Unit for Volume
Report Coverage Market Forecast, Company Share Analysis, Competition Intelligence, Drivers, Restraints, Opportunities and Threats Analysis, Market Dynamics and Challenges, and Strategic Growth Initiatives
Key Segments Covered
  • Capsule Size
  • Raw Material
  • Product Type
  • Route of Administration
  • End User
  • Region
Key regions covered
  • North America
    • The USA
    • Canada
    • Rest of North America
  • Latin America
    • Brazil
    • Argentina
    • Mexico
    • Rest of Latin America
  • Western Europe
    • Germany
    • The United Kingdom
    • France
    • Rest of Western Europe
  • Eastern Europe
    • Russia
    • Spain
    • Rest of Eastern Europe
  • South Asia Pacific
    • China
    • India
    • Japan
    • Malaysia
    • Thailand
    • Indonesia
    • South Korea
    • Rest of South Asia & Pacific
  • Middle East & Africa
    • GCC Countries
    • Turkey
    • Israel
    • Rest of MEA
  • Rest of the World
    • Oceania
    • Africa
    • South America
End User
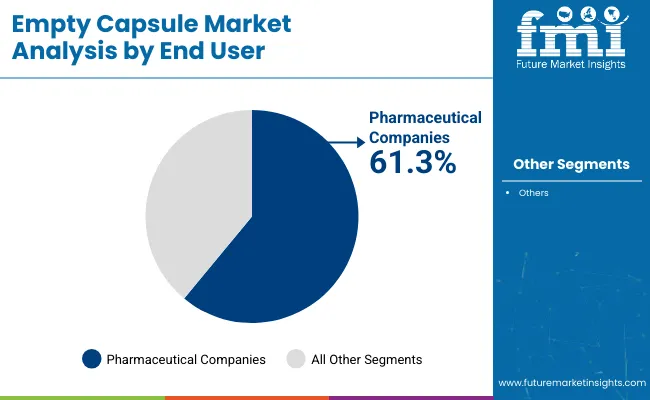
  • Pharmaceutical Companies
  • Cosmetic & Nutraceutical Companies
  • Clinical Research Organizations (CROS)
Key Companies Covered ACG Worldwide, Capsugel, Qualicaps Inc., Bright Pharma Caps Inc., Sunil Healthcare Ltd., CapsCanada Corporation, Roxlor LLC, Snail Pharma Industry Co. Ltd., Suheung Co. Ltd., and Medi-Caps Ltd.
Customization & Pricing Available upon Request

Key Segments of Empty Capsules Industry Survey

Product Type:

  • Gelatin Based Capsules
  • Vegetarian Based Capsules

Raw Material:

  • Type-A
  • Type-B Gelatin
  • Fish Bone Gelatin
  • Hydroxy Propyl Methyl Cellulose (HPMC)
  • Starch Materials
  • Pullulan

Capsule Size:

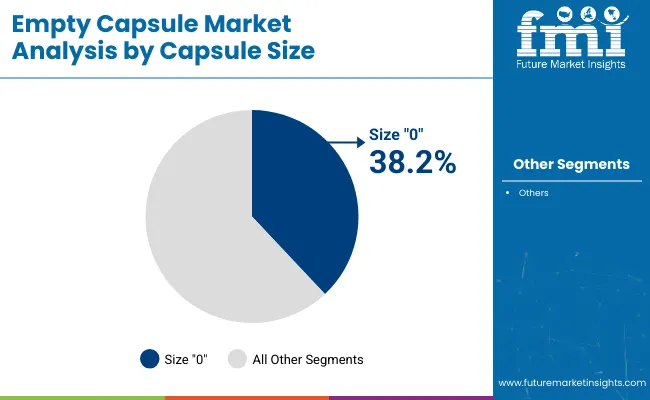
  • Size "000" Empty Capsules
  • Size "00" Empty Capsules
  • Size "0" Empty Capsules
  • Size "1" Empty Capsules
  • Size "2" Empty Capsules
  • Size "3" Empty Capsules
  • Size "4" Empty Capsules
  • Size "5" Empty Capsules

Route of Administration:

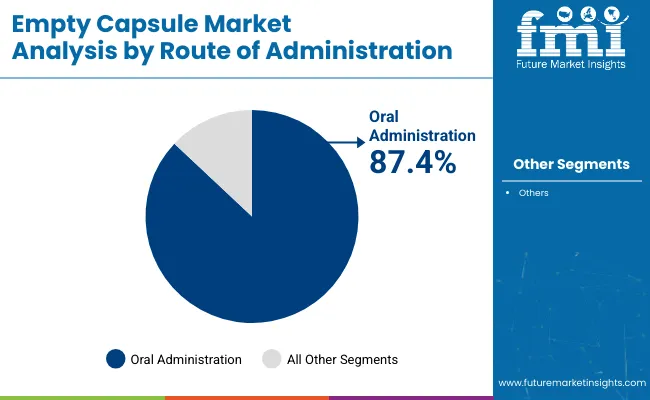
  • Oral Administration
  • Inhalation Administration

End User:

  • Pharmaceutical Companies
  • Cosmetic & Nutraceutical Companies
  • Clinical Research Organizations

Region:

  • North America
  • Latin America
  • Europe
  • East Asia
  • South Asia & Pacific
  • Middle East & Africa (MEA)

Frequently Asked Questions

The empty capsules market value reaches US$ 2.3 billion in 2023.

The empty capsules market is anticipated to surpass US$ 4.9 billion by 2033, recording a CAGR of 7.9%.

The demand for plant-based and vegetarian capsules emerges as the prevailing trend in the empty capsules market.

The United States presents a landscape of high profit prospects for the empty capsules sector, with a projected market size of US$ 996.3 million by 2033.

The global demand for empty capsules experienced a CAGR of 7% between 2018 and 2022.

Table of Content

1. Executive Summary | Empty Capsules Market

    1.1. Global Market Outlook

    1.2. Demand-side Trends

    1.3. Supply-side Trends

    1.4. Technology Roadmap Analysis

    1.5. Analysis and Recommendations

2. Market Overview

    2.1. Market Coverage / Taxonomy

    2.2. Market Definition / Scope / Limitations

3. Market Background

    3.1. Market Dynamics

        3.1.1. Drivers

        3.1.2. Restraints

        3.1.3. Opportunity

        3.1.4. Trends

    3.2. Scenario Forecast

        3.2.1. Demand in Optimistic Scenario

        3.2.2. Demand in Likely Scenario

        3.2.3. Demand in Conservative Scenario

    3.3. Opportunity Map Analysis

    3.4. Product Life Cycle Analysis

    3.5. Supply Chain Analysis

        3.5.1. Supply Side Participants and their Roles

            3.5.1.1. Producers

            3.5.1.2. Mid-Level Participants (Traders/ Agents/ Brokers)

            3.5.1.3. Wholesalers and Distributors

        3.5.2. Value Added and Value Created at Node in the Supply Chain

        3.5.3. List of Raw Material Suppliers

        3.5.4. List of Existing and Potential Buyers

    3.6. Investment Feasibility Matrix

    3.7. Value Chain Analysis

        3.7.1. Profit Margin Analysis

        3.7.2. Wholesalers and Distributors

        3.7.3. Retailers

    3.8. PESTLE and Porter’s Analysis

    3.9. Regulatory Landscape

        3.9.1. By Key Regions

        3.9.2. By Key Countries

    3.10. Regional Parent Market Outlook

    3.11. Production and Consumption Statistics

    3.12. Import and Export Statistics

4. Global Market Analysis 2017 to 2022 and Forecast, 2023 to 2033

    4.1. Historical Market Size Value (US$ million) & Volume (Units) Analysis, 2017 to 2022

    4.2. Current and Future Market Size Value (US$ million) & Volume (Units) Projections, 2023 to 2033

        4.2.1. Y-o-Y Growth Trend Analysis

        4.2.2. Absolute $ Opportunity Analysis

5. Global Market Analysis 2017 to 2022 and Forecast 2023 to 2033, By Product Type

    5.1. Introduction / Key Findings

    5.2. Historical Market Size Value (US$ million) & Volume (Units) Analysis By Product Type, 2017 to 2022

    5.3. Current and Future Market Size Value (US$ million) & Volume (Units) Analysis and Forecast By Product Type, 2023 to 2033

        5.3.1. Gelatin Based Capsules

        5.3.2. Vegetarian-Based Capsules

    5.4. Y-o-Y Growth Trend Analysis By Product Type, 2017 to 2022

    5.5. Absolute $ Opportunity Analysis By Product Type, 2023 to 2033

6. Global Market Analysis 2017 to 2022 and Forecast 2023 to 2033, By Raw Material

    6.1. Introduction / Key Findings

    6.2. Historical Market Size Value (US$ million) & Volume (Units) Analysis By Raw Material, 2017 to 2022

    6.3. Current and Future Market Size Value (US$ million) & Volume (Units) Analysis and Forecast By Raw Material, 2023 to 2033

        6.3.1. Type-A

        6.3.2. Type-B Gelatin

        6.3.3. Fish Bone Gelatin

        6.3.4. Hydroxy Propyl Methyl Cellulose

        6.3.5. Starch Materials

        6.3.6. Pullulan

    6.4. Y-o-Y Growth Trend Analysis By Raw Material, 2017 to 2022

    6.5. Absolute $ Opportunity Analysis By Raw Material, 2023 to 2033

7. Global Market Analysis 2017 to 2022 and Forecast 2023 to 2033, By Capsule Size

    7.1. Introduction / Key Findings

    7.2. Historical Market Size Value (US$ million) & Volume (Units) Analysis By Capsule Size, 2017 to 2022

    7.3. Current and Future Market Size Value (US$ million) & Volume (Units) Analysis and Forecast By Capsule Size, 2023 to 2033

        7.3.1. Size "000" Capsules

        7.3.2. Size "00" Capsules

        7.3.3. Size "0" Capsules

        7.3.4. Size "1" Capsules

        7.3.5. Size "2" Capsules

        7.3.6. Size "3" Capsules

        7.3.7. Size "4" Capsules

        7.3.8. Size "5" Capsules

    7.4. Y-o-Y Growth Trend Analysis By Capsule Size, 2017 to 2022

    7.5. Absolute $ Opportunity Analysis By Capsule Size, 2023 to 2033

8. Global Market Analysis 2017 to 2022 and Forecast 2023 to 2033, By Route of Administration

    8.1. Introduction / Key Findings

    8.2. Historical Market Size Value (US$ million) & Volume (Units) Analysis By Route of Administration, 2017 to 2022

    8.3. Current and Future Market Size Value (US$ million) & Volume (Units) Analysis and Forecast By Route of Administration, 2023 to 2033

        8.3.1. Oral Administration

        8.3.2. Inhalation Administration

    8.4. Y-o-Y Growth Trend Analysis By Route of Administration, 2017 to 2022

    8.5. Absolute $ Opportunity Analysis By Route of Administration, 2023 to 2033

9. Global Market Analysis 2017 to 2022 and Forecast 2023 to 2033, By End User

    9.1. Introduction / Key Findings

    9.2. Historical Market Size Value (US$ million) & Volume (Units) Analysis By End User, 2017 to 2022

    9.3. Current and Future Market Size Value (US$ million) & Volume (Units) Analysis and Forecast By End User, 2023 to 2033

        9.3.1. Pharmaceutical Companies

        9.3.2. Cosmetic & Nutraceutical Companies

        9.3.3. Clinical Research Organizations

    9.4. Y-o-Y Growth Trend Analysis By End User, 2017 to 2022

    9.5. Absolute $ Opportunity Analysis By End User, 2023 to 2033

10. Global Market Analysis 2017 to 2022 and Forecast 2023 to 2033, By Region

    10.1. Introduction

    10.2. Historical Market Size Value (US$ million) & Volume (Units) Analysis By Region, 2017 to 2022

    10.3. Current Market Size Value (US$ million) & Volume (Units) Analysis and Forecast By Region, 2023 to 2033

        10.3.1. North America

        10.3.2. Latin America

        10.3.3. Eastern Europe

        10.3.4. Western Europe

        10.3.5. Asia Pacific excluding Japan (APEJ)

        10.3.6. Japan

        10.3.7. Middle East and Africa (MEA)

    10.4. Market Attractiveness Analysis By Region

11. North America Market Analysis 2017 to 2022 and Forecast 2023 to 2033, By Country

    11.1. Historical Market Size Value (US$ million) & Volume (Units) Trend Analysis By Market Taxonomy, 2017 to 2022

    11.2. Market Size Value (US$ million) & Volume (Units) Forecast By Market Taxonomy, 2023 to 2033

        11.2.1. By Country

            11.2.1.1. The USA

            11.2.1.2. Canada

        11.2.2. By Product Type

        11.2.3. By Raw Material

        11.2.4. By Capsule Size

        11.2.5. By Route of Administration

        11.2.6. By End User

    11.3. Market Attractiveness Analysis

        11.3.1. By Country

        11.3.2. By Product Type

        11.3.3. By Raw Material

        11.3.4. By Capsule Size

        11.3.5. By Route of Administration

        11.3.6. By End User

    11.4. Key Takeaways

12. Latin America Market Analysis 2017 to 2022 and Forecast 2023 to 2033, By Country

    12.1. Historical Market Size Value (US$ million) & Volume (Units) Trend Analysis By Market Taxonomy, 2017 to 2022

    12.2. Market Size Value (US$ million) & Volume (Units) Forecast By Market Taxonomy, 2023 to 2033

        12.2.1. By Country

            12.2.1.1. Brazil

            12.2.1.2. Mexico

            12.2.1.3. Rest of Latin America

        12.2.2. By Product Type

        12.2.3. By Raw Material

        12.2.4. By Capsule Size

        12.2.5. By Route of Administration

        12.2.6. By End User

    12.3. Market Attractiveness Analysis

        12.3.1. By Country

        12.3.2. By Product Type

        12.3.3. By Raw Material

        12.3.4. By Capsule Size

        12.3.5. By Route of Administration

        12.3.6. By End User

    12.4. Key Takeaways

13. Eastern Europe Market Analysis 2017 to 2022 and Forecast 2023 to 2033, By Country

    13.1. Historical Market Size Value (US$ million) & Volume (Units) Trend Analysis By Market Taxonomy, 2017 to 2022

    13.2. Market Size Value (US$ million) & Volume (Units) Forecast By Market Taxonomy, 2023 to 2033

        13.2.1. By Country

            13.2.1.1. Russia

            13.2.1.2. Rest of Eastern Europe

        13.2.2. By Product Type

        13.2.3. By Raw Material

        13.2.4. By Capsule Size

        13.2.5. By Route of Administration

        13.2.6. By End User

    13.3. Market Attractiveness Analysis

        13.3.1. By Country

        13.3.2. By Product Type

        13.3.3. By Raw Material

        13.3.4. By Capsule Size

        13.3.5. By Route of Administration

        13.3.6. By End User

    13.4. Key Takeaways

14. Western Europe Market Analysis 2017 to 2022 and Forecast 2023 to 2033, By Country

    14.1. Historical Market Size Value (US$ million) & Volume (Units) Trend Analysis By Market Taxonomy, 2017 to 2022

    14.2. Market Size Value (US$ million) & Volume (Units) Forecast By Market Taxonomy, 2023 to 2033

        14.2.1. By Country

            14.2.1.1. Germany

            14.2.1.2. The United Kingdom

            14.2.1.3. France

            14.2.1.4. Spain

            14.2.1.5. Italy

            14.2.1.6. Rest of Western Europe

        14.2.2. By Product Type

        14.2.3. By Raw Material

        14.2.4. By Capsule Size

        14.2.5. By Route of Administration

        14.2.6. By End User

    14.3. Market Attractiveness Analysis

        14.3.1. By Country

        14.3.2. By Product Type

        14.3.3. By Raw Material

        14.3.4. By Capsule Size

        14.3.5. By Route of Administration

        14.3.6. By End User

    14.4. Key Takeaways

15. APEJ Market Analysis 2017 to 2022 and Forecast 2023 to 2033, By Country

    15.1. Historical Market Size Value (US$ million) & Volume (Units) Trend Analysis By Market Taxonomy, 2017 to 2022

    15.2. Market Size Value (US$ million) & Volume (Units) Forecast By Market Taxonomy, 2023 to 2033

        15.2.1. By Country

            15.2.1.1. China

            15.2.1.2. India

            15.2.1.3. A&NZ

            15.2.1.4. Rest of APEJ

        15.2.2. By Product Type

        15.2.3. By Raw Material

        15.2.4. By Capsule Size

        15.2.5. By Route of Administration

        15.2.6. By End User

    15.3. Market Attractiveness Analysis

        15.3.1. By Country

        15.3.2. By Product Type

        15.3.3. By Raw Material

        15.3.4. By Capsule Size

        15.3.5. By Route of Administration

        15.3.6. By End User

    15.4. Key Takeaways

16. Japan Market Analysis 2017 to 2022 and Forecast 2023 to 2033, By Country

    16.1. Historical Market Size Value (US$ million) & Volume (Units) Trend Analysis By Market Taxonomy, 2017 to 2022

    16.2. Market Size Value (US$ million) & Volume (Units) Forecast By Market Taxonomy, 2023 to 2033

        16.2.1. By Country

        16.2.2. By Product Type

        16.2.3. By Raw Material

        16.2.4. By Capsule Size

        16.2.5. By Route of Administration

        16.2.6. By End User

    16.3. Market Attractiveness Analysis

        16.3.1. By Country

        16.3.2. By Product Type

        16.3.3. By Raw Material

        16.3.4. By Capsule Size

        16.3.5. By Route of Administration

        16.3.6. By End User

    16.4. Key Takeaways

17. MEA Market Analysis 2017 to 2022 and Forecast 2023 to 2033, By Country

    17.1. Historical Market Size Value (US$ million) & Volume (Units) Trend Analysis By Market Taxonomy, 2017 to 2022

    17.2. Market Size Value (US$ million) & Volume (Units) Forecast By Market Taxonomy, 2023 to 2033

        17.2.1. By Country

            17.2.1.1. GCC Countries

            17.2.1.2. South Africa

            17.2.1.3. Rest of MEA

        17.2.2. By Product Type

        17.2.3. By Raw Material

        17.2.4. By Capsule Size

        17.2.5. By Route of Administration

        17.2.6. By End User

    17.3. Market Attractiveness Analysis

        17.3.1. By Country

        17.3.2. By Product Type

        17.3.3. By Raw Material

        17.3.4. By Capsule Size

        17.3.5. By Route of Administration

        17.3.6. By End User

    17.4. Key Takeaways

18. Key Countries Market Analysis

    18.1. The USA

        18.1.1. Pricing Analysis

        18.1.2. Market Share Analysis, 2022

            18.1.2.1. By Product Type

            18.1.2.2. By Raw Material

            18.1.2.3. By Capsule Size

            18.1.2.4. By Route of Administration

            18.1.2.5. By End User

    18.2. Canada

        18.2.1. Pricing Analysis

        18.2.2. Market Share Analysis, 2022

            18.2.2.1. By Product Type

            18.2.2.2. By Raw Material

            18.2.2.3. By Capsule Size

            18.2.2.4. By Route of Administration

            18.2.2.5. By End User

    18.3. Brazil

        18.3.1. Pricing Analysis

        18.3.2. Market Share Analysis, 2022

            18.3.2.1. By Product Type

            18.3.2.2. By Raw Material

            18.3.2.3. By Capsule Size

            18.3.2.4. By Route of Administration

            18.3.2.5. By End User

    18.4. Mexico

        18.4.1. Pricing Analysis

        18.4.2. Market Share Analysis, 2022

            18.4.2.1. By Product Type

            18.4.2.2. By Raw Material

            18.4.2.3. By Capsule Size

            18.4.2.4. By Route of Administration

            18.4.2.5. By End User

    18.5. Russia

        18.5.1. Pricing Analysis

        18.5.2. Market Share Analysis, 2022

            18.5.2.1. By Product Type

            18.5.2.2. By Raw Material

            18.5.2.3. By Capsule Size

            18.5.2.4. By Route of Administration

            18.5.2.5. By End User

    18.6. Germany

        18.6.1. Pricing Analysis

        18.6.2. Market Share Analysis, 2022

            18.6.2.1. By Product Type

            18.6.2.2. By Raw Material

            18.6.2.3. By Capsule Size

            18.6.2.4. By Route of Administration

            18.6.2.5. By End User

    18.7. The United Kingdom

        18.7.1. Pricing Analysis

        18.7.2. Market Share Analysis, 2022

            18.7.2.1. By Product Type

            18.7.2.2. By Raw Material

            18.7.2.3. By Capsule Size

            18.7.2.4. By Route of Administration

            18.7.2.5. By End User

    18.8. France

        18.8.1. Pricing Analysis

        18.8.2. Market Share Analysis, 2022

            18.8.2.1. By Product Type

            18.8.2.2. By Raw Material

            18.8.2.3. By Capsule Size

            18.8.2.4. By Route of Administration

            18.8.2.5. By End User

    18.9. Spain

        18.9.1. Pricing Analysis

        18.9.2. Market Share Analysis, 2022

            18.9.2.1. By Product Type

            18.9.2.2. By Raw Material

            18.9.2.3. By Capsule Size

            18.9.2.4. By Route of Administration

            18.9.2.5. By End User

    18.10. Italy

        18.10.1. Pricing Analysis

        18.10.2. Market Share Analysis, 2022

            18.10.2.1. By Product Type

            18.10.2.2. By Raw Material

            18.10.2.3. By Capsule Size

            18.10.2.4. By Route of Administration

            18.10.2.5. By End User

    18.11. China

        18.11.1. Pricing Analysis

        18.11.2. Market Share Analysis, 2022

            18.11.2.1. By Product Type

            18.11.2.2. By Raw Material

            18.11.2.3. By Capsule Size

            18.11.2.4. By Route of Administration

            18.11.2.5. By End User

    18.12. India

        18.12.1. Pricing Analysis

        18.12.2. Market Share Analysis, 2022

            18.12.2.1. By Product Type

            18.12.2.2. By Raw Material

            18.12.2.3. By Capsule Size

            18.12.2.4. By Route of Administration

            18.12.2.5. By End User

    18.13. A&NZ

        18.13.1. Pricing Analysis

        18.13.2. Market Share Analysis, 2022

            18.13.2.1. By Product Type

            18.13.2.2. By Raw Material

            18.13.2.3. By Capsule Size

            18.13.2.4. By Route of Administration

            18.13.2.5. By End User

    18.14. Japan

        18.14.1. Pricing Analysis

        18.14.2. Market Share Analysis, 2022

            18.14.2.1. By Product Type

            18.14.2.2. By Raw Material

            18.14.2.3. By Capsule Size

            18.14.2.4. By Route of Administration

            18.14.2.5. By End User

    18.15. GCC Countries

        18.15.1. Pricing Analysis

        18.15.2. Market Share Analysis, 2022

            18.15.2.1. By Product Type

            18.15.2.2. By Raw Material

            18.15.2.3. By Capsule Size

            18.15.2.4. By Route of Administration

            18.15.2.5. By End User

    18.16. South Africa

        18.16.1. Pricing Analysis

        18.16.2. Market Share Analysis, 2022

            18.16.2.1. By Product Type

            18.16.2.2. By Raw Material

            18.16.2.3. By Capsule Size

            18.16.2.4. By Route of Administration

            18.16.2.5. By End User

19. Market Structure Analysis

    19.1. Competition Dashboard

    19.2. Competition Benchmarking

    19.3. Market Share Analysis of Top Players

        19.3.1. By Regional

        19.3.2. By Product Type

        19.3.3. By Raw Material

        19.3.4. By Capsule Size

        19.3.5. By Route of Administration

        19.3.6. By End User

20. Competition Analysis

    20.1. Competition Deep Dive

        20.1.1. ACG Worldwide

            20.1.1.1. Overview

            20.1.1.2. Product Portfolio

            20.1.1.3. Profitability by Market Segments

            20.1.1.4. Sales Footprint

            20.1.1.5. Strategy Overview

                20.1.1.5.1. Marketing Strategy

                20.1.1.5.2. Product Strategy

                20.1.1.5.3. Channel Strategy

        20.1.2. Capsugel

            20.1.2.1. Overview

            20.1.2.2. Product Portfolio

            20.1.2.3. Profitability by Market Segments

            20.1.2.4. Sales Footprint

            20.1.2.5. Strategy Overview

                20.1.2.5.1. Marketing Strategy

                20.1.2.5.2. Product Strategy

                20.1.2.5.3. Channel Strategy

        20.1.3. Qualicaps Inc.

            20.1.3.1. Overview

            20.1.3.2. Product Portfolio

            20.1.3.3. Profitability by Market Segments

            20.1.3.4. Sales Footprint

            20.1.3.5. Strategy Overview

                20.1.3.5.1. Marketing Strategy

                20.1.3.5.2. Product Strategy

                20.1.3.5.3. Channel Strategy

        20.1.4. Bright Pharma Caps Inc.

            20.1.4.1. Overview

            20.1.4.2. Product Portfolio

            20.1.4.3. Profitability by Market Segments

            20.1.4.4. Sales Footprint

            20.1.4.5. Strategy Overview

                20.1.4.5.1. Marketing Strategy

                20.1.4.5.2. Product Strategy

                20.1.4.5.3. Channel Strategy

        20.1.5. Sunil Healthcare Ltd.

            20.1.5.1. Overview

            20.1.5.2. Product Portfolio

            20.1.5.3. Profitability by Market Segments

            20.1.5.4. Sales Footprint

            20.1.5.5. Strategy Overview

                20.1.5.5.1. Marketing Strategy

                20.1.5.5.2. Product Strategy

                20.1.5.5.3. Channel Strategy

        20.1.6. CapsCanada Corporation

            20.1.6.1. Overview

            20.1.6.2. Product Portfolio

            20.1.6.3. Profitability by Market Segments

            20.1.6.4. Sales Footprint

            20.1.6.5. Strategy Overview

                20.1.6.5.1. Marketing Strategy

                20.1.6.5.2. Product Strategy

                20.1.6.5.3. Channel Strategy

        20.1.7. Roxlor LLC

            20.1.7.1. Overview

            20.1.7.2. Product Portfolio

            20.1.7.3. Profitability by Market Segments

            20.1.7.4. Sales Footprint

            20.1.7.5. Strategy Overview

                20.1.7.5.1. Marketing Strategy

                20.1.7.5.2. Product Strategy

                20.1.7.5.3. Channel Strategy

        20.1.8. Snail Pharma Industry Co. Ltd.

            20.1.8.1. Overview

            20.1.8.2. Product Portfolio

            20.1.8.3. Profitability by Market Segments

            20.1.8.4. Sales Footprint

            20.1.8.5. Strategy Overview

                20.1.8.5.1. Marketing Strategy

                20.1.8.5.2. Product Strategy

                20.1.8.5.3. Channel Strategy

        20.1.9. Suheung Co. Ltd.

            20.1.9.1. Overview

            20.1.9.2. Product Portfolio

            20.1.9.3. Profitability by Market Segments

            20.1.9.4. Sales Footprint

            20.1.9.5. Strategy Overview

                20.1.9.5.1. Marketing Strategy

                20.1.9.5.2. Product Strategy

                20.1.9.5.3. Channel Strategy

        20.1.10. Medi-Caps Ltd.

            20.1.10.1. Overview

            20.1.10.2. Product Portfolio

            20.1.10.3. Profitability by Market Segments

            20.1.10.4. Sales Footprint

            20.1.10.5. Strategy Overview

                20.1.10.5.1. Marketing Strategy

                20.1.10.5.2. Product Strategy

                20.1.10.5.3. Channel Strategy

21. Assumptions & Acronyms Used

22. Research Methodology

Don't pay for what you don't need

Customize your report by selecting specific countries or regions and save 30%!

List of Tables

Table 1: Global Market Value (US$ million) Forecast by Region, 2017 to 2033

Table 2: Global Market Volume (Units) Forecast by Region, 2017 to 2033

Table 3: Global Market Value (US$ million) Forecast by Product Type, 2017 to 2033

Table 4: Global Market Volume (Units) Forecast by Product Type, 2017 to 2033

Table 5: Global Market Value (US$ million) Forecast by Raw Material, 2017 to 2033

Table 6: Global Market Volume (Units) Forecast by Raw Material, 2017 to 2033

Table 7: Global Market Value (US$ million) Forecast by Capsule Size, 2017 to 2033

Table 8: Global Market Volume (Units) Forecast by Capsule Size, 2017 to 2033

Table 9: Global Market Value (US$ million) Forecast by Route of Administration, 2017 to 2033

Table 10: Global Market Volume (Units) Forecast by Route of Administration, 2017 to 2033

Table 11: Global Market Value (US$ million) Forecast by End User, 2017 to 2033

Table 12: Global Market Volume (Units) Forecast by End User, 2017 to 2033

Table 13: North America Market Value (US$ million) Forecast by Country, 2017 to 2033

Table 14: North America Market Volume (Units) Forecast by Country, 2017 to 2033

Table 15: North America Market Value (US$ million) Forecast by Product Type, 2017 to 2033

Table 16: North America Market Volume (Units) Forecast by Product Type, 2017 to 2033

Table 17: North America Market Value (US$ million) Forecast by Raw Material, 2017 to 2033

Table 18: North America Market Volume (Units) Forecast by Raw Material, 2017 to 2033

Table 19: North America Market Value (US$ million) Forecast by Capsule Size, 2017 to 2033

Table 20: North America Market Volume (Units) Forecast by Capsule Size, 2017 to 2033

Table 21: North America Market Value (US$ million) Forecast by Route of Administration, 2017 to 2033

Table 22: North America Market Volume (Units) Forecast by Route of Administration, 2017 to 2033

Table 23: North America Market Value (US$ million) Forecast by End User, 2017 to 2033

Table 24: North America Market Volume (Units) Forecast by End User, 2017 to 2033

Table 25: Latin America Market Value (US$ million) Forecast by Country, 2017 to 2033

Table 26: Latin America Market Volume (Units) Forecast by Country, 2017 to 2033

Table 27: Latin America Market Value (US$ million) Forecast by Product Type, 2017 to 2033

Table 28: Latin America Market Volume (Units) Forecast by Product Type, 2017 to 2033

Table 29: Latin America Market Value (US$ million) Forecast by Raw Material, 2017 to 2033

Table 30: Latin America Market Volume (Units) Forecast by Raw Material, 2017 to 2033

Table 31: Latin America Market Value (US$ million) Forecast by Capsule Size, 2017 to 2033

Table 32: Latin America Market Volume (Units) Forecast by Capsule Size, 2017 to 2033

Table 33: Latin America Market Value (US$ million) Forecast by Route of Administration, 2017 to 2033

Table 34: Latin America Market Volume (Units) Forecast by Route of Administration, 2017 to 2033

Table 35: Latin America Market Value (US$ million) Forecast by End User, 2017 to 2033

Table 36: Latin America Market Volume (Units) Forecast by End User, 2017 to 2033

Table 37: Eastern Europe Market Value (US$ million) Forecast by Country, 2017 to 2033

Table 38: Eastern Europe Market Volume (Units) Forecast by Country, 2017 to 2033

Table 39: Eastern Europe Market Value (US$ million) Forecast by Product Type, 2017 to 2033

Table 40: Eastern Europe Market Volume (Units) Forecast by Product Type, 2017 to 2033

Table 41: Eastern Europe Market Value (US$ million) Forecast by Raw Material, 2017 to 2033

Table 42: Eastern Europe Market Volume (Units) Forecast by Raw Material, 2017 to 2033

Table 43: Eastern Europe Market Value (US$ million) Forecast by Capsule Size, 2017 to 2033

Table 44: Eastern Europe Market Volume (Units) Forecast by Capsule Size, 2017 to 2033

Table 45: Eastern Europe Market Value (US$ million) Forecast by Route of Administration, 2017 to 2033

Table 46: Eastern Europe Market Volume (Units) Forecast by Route of Administration, 2017 to 2033

Table 47: Eastern Europe Market Value (US$ million) Forecast by End User, 2017 to 2033

Table 48: Eastern Europe Market Volume (Units) Forecast by End User, 2017 to 2033

Table 49: Western Europe Market Value (US$ million) Forecast by Country, 2017 to 2033

Table 50: Western Europe Market Volume (Units) Forecast by Country, 2017 to 2033

Table 51: Western Europe Market Value (US$ million) Forecast by Product Type, 2017 to 2033

Table 52: Western Europe Market Volume (Units) Forecast by Product Type, 2017 to 2033

Table 53: Western Europe Market Value (US$ million) Forecast by Raw Material, 2017 to 2033

Table 54: Western Europe Market Volume (Units) Forecast by Raw Material, 2017 to 2033

Table 55: Western Europe Market Value (US$ million) Forecast by Capsule Size, 2017 to 2033

Table 56: Western Europe Market Volume (Units) Forecast by Capsule Size, 2017 to 2033

Table 57: Western Europe Market Value (US$ million) Forecast by Route of Administration, 2017 to 2033

Table 58: Western Europe Market Volume (Units) Forecast by Route of Administration, 2017 to 2033

Table 59: Western Europe Market Value (US$ million) Forecast by End User, 2017 to 2033

Table 60: Western Europe Market Volume (Units) Forecast by End User, 2017 to 2033

Table 61: APEJ Market Value (US$ million) Forecast by Country, 2017 to 2033

Table 62: APEJ Market Volume (Units) Forecast by Country, 2017 to 2033

Table 63: APEJ Market Value (US$ million) Forecast by Product Type, 2017 to 2033

Table 64: APEJ Market Volume (Units) Forecast by Product Type, 2017 to 2033

Table 65: APEJ Market Value (US$ million) Forecast by Raw Material, 2017 to 2033

Table 66: APEJ Market Volume (Units) Forecast by Raw Material, 2017 to 2033

Table 67: APEJ Market Value (US$ million) Forecast by Capsule Size, 2017 to 2033

Table 68: APEJ Market Volume (Units) Forecast by Capsule Size, 2017 to 2033

Table 69: APEJ Market Value (US$ million) Forecast by Route of Administration, 2017 to 2033

Table 70: APEJ Market Volume (Units) Forecast by Route of Administration, 2017 to 2033

Table 71: APEJ Market Value (US$ million) Forecast by End User, 2017 to 2033

Table 72: APEJ Market Volume (Units) Forecast by End User, 2017 to 2033

Table 73: Japan Market Value (US$ million) Forecast by Country, 2017 to 2033

Table 74: Japan Market Volume (Units) Forecast by Country, 2017 to 2033

Table 75: Japan Market Value (US$ million) Forecast by Product Type, 2017 to 2033

Table 76: Japan Market Volume (Units) Forecast by Product Type, 2017 to 2033

Table 77: Japan Market Value (US$ million) Forecast by Raw Material, 2017 to 2033

Table 78: Japan Market Volume (Units) Forecast by Raw Material, 2017 to 2033

Table 79: Japan Market Value (US$ million) Forecast by Capsule Size, 2017 to 2033

Table 80: Japan Market Volume (Units) Forecast by Capsule Size, 2017 to 2033

Table 81: Japan Market Value (US$ million) Forecast by Route of Administration, 2017 to 2033

Table 82: Japan Market Volume (Units) Forecast by Route of Administration, 2017 to 2033

Table 83: Japan Market Value (US$ million) Forecast by End User, 2017 to 2033

Table 84: Japan Market Volume (Units) Forecast by End User, 2017 to 2033

Table 85: MEA Market Value (US$ million) Forecast by Country, 2017 to 2033

Table 86: MEA Market Volume (Units) Forecast by Country, 2017 to 2033

Table 87: MEA Market Value (US$ million) Forecast by Product Type, 2017 to 2033

Table 88: MEA Market Volume (Units) Forecast by Product Type, 2017 to 2033

Table 89: MEA Market Value (US$ million) Forecast by Raw Material, 2017 to 2033

Table 90: MEA Market Volume (Units) Forecast by Raw Material, 2017 to 2033

Table 91: MEA Market Value (US$ million) Forecast by Capsule Size, 2017 to 2033

Table 92: MEA Market Volume (Units) Forecast by Capsule Size, 2017 to 2033

Table 93: MEA Market Value (US$ million) Forecast by Route of Administration, 2017 to 2033

Table 94: MEA Market Volume (Units) Forecast by Route of Administration, 2017 to 2033

Table 95: MEA Market Value (US$ million) Forecast by End User, 2017 to 2033

Table 96: MEA Market Volume (Units) Forecast by End User, 2017 to 2033
Sabyasachi Ghosh
Sabyasachi Ghosh

Principal Consultant

Talk to Analyst

Find your sweet spots for generating winning opportunities in this market.

List of Charts

Figure 1: Global Market Value (US$ million) by Product Type, 2023 to 2033

Figure 2: Global Market Value (US$ million) by Raw Material, 2023 to 2033

Figure 3: Global Market Value (US$ million) by Capsule Size, 2023 to 2033

Figure 4: Global Market Value (US$ million) by Route of Administration, 2023 to 2033

Figure 5: Global Market Value (US$ million) by End User, 2023 to 2033

Figure 6: Global Market Value (US$ million) by Region, 2023 to 2033

Figure 7: Global Market Value (US$ million) Analysis by Region, 2017 to 2033

Figure 8: Global Market Volume (Units) Analysis by Region, 2017 to 2033

Figure 9: Global Market Value Share (%) and BPS Analysis by Region, 2023 to 2033

Figure 10: Global Market Y-o-Y Growth (%) Projections by Region, 2023 to 2033

Figure 11: Global Market Value (US$ million) Analysis by Product Type, 2017 to 2033

Figure 12: Global Market Volume (Units) Analysis by Product Type, 2017 to 2033

Figure 13: Global Market Value Share (%) and BPS Analysis by Product Type, 2023 to 2033

Figure 14: Global Market Y-o-Y Growth (%) Projections by Product Type, 2023 to 2033

Figure 15: Global Market Value (US$ million) Analysis by Raw Material, 2017 to 2033

Figure 16: Global Market Volume (Units) Analysis by Raw Material, 2017 to 2033

Figure 17: Global Market Value Share (%) and BPS Analysis by Raw Material, 2023 to 2033

Figure 18: Global Market Y-o-Y Growth (%) Projections by Raw Material, 2023 to 2033

Figure 19: Global Market Value (US$ million) Analysis by Capsule Size, 2017 to 2033

Figure 20: Global Market Volume (Units) Analysis by Capsule Size, 2017 to 2033

Figure 21: Global Market Value Share (%) and BPS Analysis by Capsule Size, 2023 to 2033

Figure 22: Global Market Y-o-Y Growth (%) Projections by Capsule Size, 2023 to 2033

Figure 23: Global Market Value (US$ million) Analysis by Route of Administration, 2017 to 2033

Figure 24: Global Market Volume (Units) Analysis by Route of Administration, 2017 to 2033

Figure 25: Global Market Value Share (%) and BPS Analysis by Route of Administration, 2023 to 2033

Figure 26: Global Market Y-o-Y Growth (%) Projections by Route of Administration, 2023 to 2033

Figure 27: Global Market Value (US$ million) Analysis by End User, 2017 to 2033

Figure 28: Global Market Volume (Units) Analysis by End User, 2017 to 2033

Figure 29: Global Market Value Share (%) and BPS Analysis by End User, 2023 to 2033

Figure 30: Global Market Y-o-Y Growth (%) Projections by End User, 2023 to 2033

Figure 31: Global Market Attractiveness by Product Type, 2023 to 2033

Figure 32: Global Market Attractiveness by Raw Material, 2023 to 2033

Figure 33: Global Market Attractiveness by Capsule Size, 2023 to 2033

Figure 34: Global Market Attractiveness by Route of Administration, 2023 to 2033

Figure 35: Global Market Attractiveness by End User, 2023 to 2033

Figure 36: Global Market Attractiveness by Region, 2023 to 2033

Figure 37: North America Market Value (US$ million) by Product Type, 2023 to 2033

Figure 38: North America Market Value (US$ million) by Raw Material, 2023 to 2033

Figure 39: North America Market Value (US$ million) by Capsule Size, 2023 to 2033

Figure 40: North America Market Value (US$ million) by Route of Administration, 2023 to 2033

Figure 41: North America Market Value (US$ million) by End User, 2023 to 2033

Figure 42: North America Market Value (US$ million) by Country, 2023 to 2033

Figure 43: North America Market Value (US$ million) Analysis by Country, 2017 to 2033

Figure 44: North America Market Volume (Units) Analysis by Country, 2017 to 2033

Figure 45: North America Market Value Share (%) and BPS Analysis by Country, 2023 to 2033

Figure 46: North America Market Y-o-Y Growth (%) Projections by Country, 2023 to 2033

Figure 47: North America Market Value (US$ million) Analysis by Product Type, 2017 to 2033

Figure 48: North America Market Volume (Units) Analysis by Product Type, 2017 to 2033

Figure 49: North America Market Value Share (%) and BPS Analysis by Product Type, 2023 to 2033

Figure 50: North America Market Y-o-Y Growth (%) Projections by Product Type, 2023 to 2033

Figure 51: North America Market Value (US$ million) Analysis by Raw Material, 2017 to 2033

Figure 52: North America Market Volume (Units) Analysis by Raw Material, 2017 to 2033

Figure 53: North America Market Value Share (%) and BPS Analysis by Raw Material, 2023 to 2033

Figure 54: North America Market Y-o-Y Growth (%) Projections by Raw Material, 2023 to 2033

Figure 55: North America Market Value (US$ million) Analysis by Capsule Size, 2017 to 2033

Figure 56: North America Market Volume (Units) Analysis by Capsule Size, 2017 to 2033

Figure 57: North America Market Value Share (%) and BPS Analysis by Capsule Size, 2023 to 2033

Figure 58: North America Market Y-o-Y Growth (%) Projections by Capsule Size, 2023 to 2033

Figure 59: North America Market Value (US$ million) Analysis by Route of Administration, 2017 to 2033

Figure 60: North America Market Volume (Units) Analysis by Route of Administration, 2017 to 2033

Figure 61: North America Market Value Share (%) and BPS Analysis by Route of Administration, 2023 to 2033

Figure 62: North America Market Y-o-Y Growth (%) Projections by Route of Administration, 2023 to 2033

Figure 63: North America Market Value (US$ million) Analysis by End User, 2017 to 2033

Figure 64: North America Market Volume (Units) Analysis by End User, 2017 to 2033

Figure 65: North America Market Value Share (%) and BPS Analysis by End User, 2023 to 2033

Figure 66: North America Market Y-o-Y Growth (%) Projections by End User, 2023 to 2033

Figure 67: North America Market Attractiveness by Product Type, 2023 to 2033

Figure 68: North America Market Attractiveness by Raw Material, 2023 to 2033

Figure 69: North America Market Attractiveness by Capsule Size, 2023 to 2033

Figure 70: North America Market Attractiveness by Route of Administration, 2023 to 2033

Figure 71: North America Market Attractiveness by End User, 2023 to 2033

Figure 72: North America Market Attractiveness by Country, 2023 to 2033

Figure 73: Latin America Market Value (US$ million) by Product Type, 2023 to 2033

Figure 74: Latin America Market Value (US$ million) by Raw Material, 2023 to 2033

Figure 75: Latin America Market Value (US$ million) by Capsule Size, 2023 to 2033

Figure 76: Latin America Market Value (US$ million) by Route of Administration, 2023 to 2033

Figure 77: Latin America Market Value (US$ million) by End User, 2023 to 2033

Figure 78: Latin America Market Value (US$ million) by Country, 2023 to 2033

Figure 79: Latin America Market Value (US$ million) Analysis by Country, 2017 to 2033

Figure 80: Latin America Market Volume (Units) Analysis by Country, 2017 to 2033

Figure 81: Latin America Market Value Share (%) and BPS Analysis by Country, 2023 to 2033

Figure 82: Latin America Market Y-o-Y Growth (%) Projections by Country, 2023 to 2033

Figure 83: Latin America Market Value (US$ million) Analysis by Product Type, 2017 to 2033

Figure 84: Latin America Market Volume (Units) Analysis by Product Type, 2017 to 2033

Figure 85: Latin America Market Value Share (%) and BPS Analysis by Product Type, 2023 to 2033

Figure 86: Latin America Market Y-o-Y Growth (%) Projections by Product Type, 2023 to 2033

Figure 87: Latin America Market Value (US$ million) Analysis by Raw Material, 2017 to 2033

Figure 88: Latin America Market Volume (Units) Analysis by Raw Material, 2017 to 2033

Figure 89: Latin America Market Value Share (%) and BPS Analysis by Raw Material, 2023 to 2033

Figure 90: Latin America Market Y-o-Y Growth (%) Projections by Raw Material, 2023 to 2033

Figure 91: Latin America Market Value (US$ million) Analysis by Capsule Size, 2017 to 2033

Figure 92: Latin America Market Volume (Units) Analysis by Capsule Size, 2017 to 2033

Figure 93: Latin America Market Value Share (%) and BPS Analysis by Capsule Size, 2023 to 2033

Figure 94: Latin America Market Y-o-Y Growth (%) Projections by Capsule Size, 2023 to 2033

Figure 95: Latin America Market Value (US$ million) Analysis by Route of Administration, 2017 to 2033

Figure 96: Latin America Market Volume (Units) Analysis by Route of Administration, 2017 to 2033

Figure 97: Latin America Market Value Share (%) and BPS Analysis by Route of Administration, 2023 to 2033

Figure 98: Latin America Market Y-o-Y Growth (%) Projections by Route of Administration, 2023 to 2033

Figure 99: Latin America Market Value (US$ million) Analysis by End User, 2017 to 2033

Figure 100: Latin America Market Volume (Units) Analysis by End User, 2017 to 2033

Figure 101: Latin America Market Value Share (%) and BPS Analysis by End User, 2023 to 2033

Figure 102: Latin America Market Y-o-Y Growth (%) Projections by End User, 2023 to 2033

Figure 103: Latin America Market Attractiveness by Product Type, 2023 to 2033

Figure 104: Latin America Market Attractiveness by Raw Material, 2023 to 2033

Figure 105: Latin America Market Attractiveness by Capsule Size, 2023 to 2033

Figure 106: Latin America Market Attractiveness by Route of Administration, 2023 to 2033

Figure 107: Latin America Market Attractiveness by End User, 2023 to 2033

Figure 108: Latin America Market Attractiveness by Country, 2023 to 2033

Figure 109: Eastern Europe Market Value (US$ million) by Product Type, 2023 to 2033

Figure 110: Eastern Europe Market Value (US$ million) by Raw Material, 2023 to 2033

Figure 111: Eastern Europe Market Value (US$ million) by Capsule Size, 2023 to 2033

Figure 112: Eastern Europe Market Value (US$ million) by Route of Administration, 2023 to 2033

Figure 113: Eastern Europe Market Value (US$ million) by End User, 2023 to 2033

Figure 114: Eastern Europe Market Value (US$ million) by Country, 2023 to 2033

Figure 115: Eastern Europe Market Value (US$ million) Analysis by Country, 2017 to 2033

Figure 116: Eastern Europe Market Volume (Units) Analysis by Country, 2017 to 2033

Figure 117: Eastern Europe Market Value Share (%) and BPS Analysis by Country, 2023 to 2033

Figure 118: Eastern Europe Market Y-o-Y Growth (%) Projections by Country, 2023 to 2033

Figure 119: Eastern Europe Market Value (US$ million) Analysis by Product Type, 2017 to 2033

Figure 120: Eastern Europe Market Volume (Units) Analysis by Product Type, 2017 to 2033

Figure 121: Eastern Europe Market Value Share (%) and BPS Analysis by Product Type, 2023 to 2033

Figure 122: Eastern Europe Market Y-o-Y Growth (%) Projections by Product Type, 2023 to 2033

Figure 123: Eastern Europe Market Value (US$ million) Analysis by Raw Material, 2017 to 2033

Figure 124: Eastern Europe Market Volume (Units) Analysis by Raw Material, 2017 to 2033

Figure 125: Eastern Europe Market Value Share (%) and BPS Analysis by Raw Material, 2023 to 2033

Figure 126: Eastern Europe Market Y-o-Y Growth (%) Projections by Raw Material, 2023 to 2033

Figure 127: Eastern Europe Market Value (US$ million) Analysis by Capsule Size, 2017 to 2033

Figure 128: Eastern Europe Market Volume (Units) Analysis by Capsule Size, 2017 to 2033

Figure 129: Eastern Europe Market Value Share (%) and BPS Analysis by Capsule Size, 2023 to 2033

Figure 130: Eastern Europe Market Y-o-Y Growth (%) Projections by Capsule Size, 2023 to 2033

Figure 131: Eastern Europe Market Value (US$ million) Analysis by Route of Administration, 2017 to 2033

Figure 132: Eastern Europe Market Volume (Units) Analysis by Route of Administration, 2017 to 2033

Figure 133: Eastern Europe Market Value Share (%) and BPS Analysis by Route of Administration, 2023 to 2033

Figure 134: Eastern Europe Market Y-o-Y Growth (%) Projections by Route of Administration, 2023 to 2033

Figure 135: Eastern Europe Market Value (US$ million) Analysis by End User, 2017 to 2033

Figure 136: Eastern Europe Market Volume (Units) Analysis by End User, 2017 to 2033

Figure 137: Eastern Europe Market Value Share (%) and BPS Analysis by End User, 2023 to 2033

Figure 138: Eastern Europe Market Y-o-Y Growth (%) Projections by End User, 2023 to 2033

Figure 139: Eastern Europe Market Attractiveness by Product Type, 2023 to 2033

Figure 140: Eastern Europe Market Attractiveness by Raw Material, 2023 to 2033

Figure 141: Eastern Europe Market Attractiveness by Capsule Size, 2023 to 2033

Figure 142: Eastern Europe Market Attractiveness by Route of Administration, 2023 to 2033

Figure 143: Eastern Europe Market Attractiveness by End User, 2023 to 2033

Figure 144: Eastern Europe Market Attractiveness by Country, 2023 to 2033

Figure 145: Western Europe Market Value (US$ million) by Product Type, 2023 to 2033

Figure 146: Western Europe Market Value (US$ million) by Raw Material, 2023 to 2033

Figure 147: Western Europe Market Value (US$ million) by Capsule Size, 2023 to 2033

Figure 148: Western Europe Market Value (US$ million) by Route of Administration, 2023 to 2033

Figure 149: Western Europe Market Value (US$ million) by End User, 2023 to 2033

Figure 150: Western Europe Market Value (US$ million) by Country, 2023 to 2033

Figure 151: Western Europe Market Value (US$ million) Analysis by Country, 2017 to 2033

Figure 152: Western Europe Market Volume (Units) Analysis by Country, 2017 to 2033

Figure 153: Western Europe Market Value Share (%) and BPS Analysis by Country, 2023 to 2033

Figure 154: Western Europe Market Y-o-Y Growth (%) Projections by Country, 2023 to 2033

Figure 155: Western Europe Market Value (US$ million) Analysis by Product Type, 2017 to 2033

Figure 156: Western Europe Market Volume (Units) Analysis by Product Type, 2017 to 2033

Figure 157: Western Europe Market Value Share (%) and BPS Analysis by Product Type, 2023 to 2033

Figure 158: Western Europe Market Y-o-Y Growth (%) Projections by Product Type, 2023 to 2033

Figure 159: Western Europe Market Value (US$ million) Analysis by Raw Material, 2017 to 2033

Figure 160: Western Europe Market Volume (Units) Analysis by Raw Material, 2017 to 2033

Figure 161: Western Europe Market Value Share (%) and BPS Analysis by Raw Material, 2023 to 2033

Figure 162: Western Europe Market Y-o-Y Growth (%) Projections by Raw Material, 2023 to 2033

Figure 163: Western Europe Market Value (US$ million) Analysis by Capsule Size, 2017 to 2033

Figure 164: Western Europe Market Volume (Units) Analysis by Capsule Size, 2017 to 2033

Figure 165: Western Europe Market Value Share (%) and BPS Analysis by Capsule Size, 2023 to 2033

Figure 166: Western Europe Market Y-o-Y Growth (%) Projections by Capsule Size, 2023 to 2033

Figure 167: Western Europe Market Value (US$ million) Analysis by Route of Administration, 2017 to 2033

Figure 168: Western Europe Market Volume (Units) Analysis by Route of Administration, 2017 to 2033

Figure 169: Western Europe Market Value Share (%) and BPS Analysis by Route of Administration, 2023 to 2033

Figure 170: Western Europe Market Y-o-Y Growth (%) Projections by Route of Administration, 2023 to 2033

Figure 171: Western Europe Market Value (US$ million) Analysis by End User, 2017 to 2033

Figure 172: Western Europe Market Volume (Units) Analysis by End User, 2017 to 2033

Figure 173: Western Europe Market Value Share (%) and BPS Analysis by End User, 2023 to 2033

Figure 174: Western Europe Market Y-o-Y Growth (%) Projections by End User, 2023 to 2033

Figure 175: Western Europe Market Attractiveness by Product Type, 2023 to 2033

Figure 176: Western Europe Market Attractiveness by Raw Material, 2023 to 2033

Figure 177: Western Europe Market Attractiveness by Capsule Size, 2023 to 2033

Figure 178: Western Europe Market Attractiveness by Route of Administration, 2023 to 2033

Figure 179: Western Europe Market Attractiveness by End User, 2023 to 2033

Figure 180: Western Europe Market Attractiveness by Country, 2023 to 2033

Figure 181: APEJ Market Value (US$ million) by Product Type, 2023 to 2033

Figure 182: APEJ Market Value (US$ million) by Raw Material, 2023 to 2033

Figure 183: APEJ Market Value (US$ million) by Capsule Size, 2023 to 2033

Figure 184: APEJ Market Value (US$ million) by Route of Administration, 2023 to 2033

Figure 185: APEJ Market Value (US$ million) by End User, 2023 to 2033

Figure 186: APEJ Market Value (US$ million) by Country, 2023 to 2033

Figure 187: APEJ Market Value (US$ million) Analysis by Country, 2017 to 2033

Figure 188: APEJ Market Volume (Units) Analysis by Country, 2017 to 2033

Figure 189: APEJ Market Value Share (%) and BPS Analysis by Country, 2023 to 2033

Figure 190: APEJ Market Y-o-Y Growth (%) Projections by Country, 2023 to 2033

Figure 191: APEJ Market Value (US$ million) Analysis by Product Type, 2017 to 2033

Figure 192: APEJ Market Volume (Units) Analysis by Product Type, 2017 to 2033

Figure 193: APEJ Market Value Share (%) and BPS Analysis by Product Type, 2023 to 2033

Figure 194: APEJ Market Y-o-Y Growth (%) Projections by Product Type, 2023 to 2033

Figure 195: APEJ Market Value (US$ million) Analysis by Raw Material, 2017 to 2033

Figure 196: APEJ Market Volume (Units) Analysis by Raw Material, 2017 to 2033

Figure 197: APEJ Market Value Share (%) and BPS Analysis by Raw Material, 2023 to 2033

Figure 198: APEJ Market Y-o-Y Growth (%) Projections by Raw Material, 2023 to 2033

Figure 199: APEJ Market Value (US$ million) Analysis by Capsule Size, 2017 to 2033

Figure 200: APEJ Market Volume (Units) Analysis by Capsule Size, 2017 to 2033

Figure 201: APEJ Market Value Share (%) and BPS Analysis by Capsule Size, 2023 to 2033

Figure 202: APEJ Market Y-o-Y Growth (%) Projections by Capsule Size, 2023 to 2033

Figure 203: APEJ Market Value (US$ million) Analysis by Route of Administration, 2017 to 2033

Figure 204: APEJ Market Volume (Units) Analysis by Route of Administration, 2017 to 2033

Figure 205: APEJ Market Value Share (%) and BPS Analysis by Route of Administration, 2023 to 2033

Figure 206: APEJ Market Y-o-Y Growth (%) Projections by Route of Administration, 2023 to 2033

Figure 207: APEJ Market Value (US$ million) Analysis by End User, 2017 to 2033

Figure 208: APEJ Market Volume (Units) Analysis by End User, 2017 to 2033

Figure 209: APEJ Market Value Share (%) and BPS Analysis by End User, 2023 to 2033

Figure 210: APEJ Market Y-o-Y Growth (%) Projections by End User, 2023 to 2033

Figure 211: APEJ Market Attractiveness by Product Type, 2023 to 2033

Figure 212: APEJ Market Attractiveness by Raw Material, 2023 to 2033

Figure 213: APEJ Market Attractiveness by Capsule Size, 2023 to 2033

Figure 214: APEJ Market Attractiveness by Route of Administration, 2023 to 2033

Figure 215: APEJ Market Attractiveness by End User, 2023 to 2033

Figure 216: APEJ Market Attractiveness by Country, 2023 to 2033

Figure 217: Japan Market Value (US$ million) by Product Type, 2023 to 2033

Figure 218: Japan Market Value (US$ million) by Raw Material, 2023 to 2033

Figure 219: Japan Market Value (US$ million) by Capsule Size, 2023 to 2033

Figure 220: Japan Market Value (US$ million) by Route of Administration, 2023 to 2033

Figure 221: Japan Market Value (US$ million) by End User, 2023 to 2033

Figure 222: Japan Market Value (US$ million) by Country, 2023 to 2033

Figure 223: Japan Market Value (US$ million) Analysis by Country, 2017 to 2033

Figure 224: Japan Market Volume (Units) Analysis by Country, 2017 to 2033

Figure 225: Japan Market Value Share (%) and BPS Analysis by Country, 2023 to 2033

Figure 226: Japan Market Y-o-Y Growth (%) Projections by Country, 2023 to 2033

Figure 227: Japan Market Value (US$ million) Analysis by Product Type, 2017 to 2033

Figure 228: Japan Market Volume (Units) Analysis by Product Type, 2017 to 2033

Figure 229: Japan Market Value Share (%) and BPS Analysis by Product Type, 2023 to 2033

Figure 230: Japan Market Y-o-Y Growth (%) Projections by Product Type, 2023 to 2033

Figure 231: Japan Market Value (US$ million) Analysis by Raw Material, 2017 to 2033

Figure 232: Japan Market Volume (Units) Analysis by Raw Material, 2017 to 2033

Figure 233: Japan Market Value Share (%) and BPS Analysis by Raw Material, 2023 to 2033

Figure 234: Japan Market Y-o-Y Growth (%) Projections by Raw Material, 2023 to 2033

Figure 235: Japan Market Value (US$ million) Analysis by Capsule Size, 2017 to 2033

Figure 236: Japan Market Volume (Units) Analysis by Capsule Size, 2017 to 2033

Figure 237: Japan Market Value Share (%) and BPS Analysis by Capsule Size, 2023 to 2033

Figure 238: Japan Market Y-o-Y Growth (%) Projections by Capsule Size, 2023 to 2033

Figure 239: Japan Market Value (US$ million) Analysis by Route of Administration, 2017 to 2033

Figure 240: Japan Market Volume (Units) Analysis by Route of Administration, 2017 to 2033

Figure 241: Japan Market Value Share (%) and BPS Analysis by Route of Administration, 2023 to 2033

Figure 242: Japan Market Y-o-Y Growth (%) Projections by Route of Administration, 2023 to 2033

Figure 243: Japan Market Value (US$ million) Analysis by End User, 2017 to 2033

Figure 244: Japan Market Volume (Units) Analysis by End User, 2017 to 2033

Figure 245: Japan Market Value Share (%) and BPS Analysis by End User, 2023 to 2033

Figure 246: Japan Market Y-o-Y Growth (%) Projections by End User, 2023 to 2033

Figure 247: Japan Market Attractiveness by Product Type, 2023 to 2033

Figure 248: Japan Market Attractiveness by Raw Material, 2023 to 2033

Figure 249: Japan Market Attractiveness by Capsule Size, 2023 to 2033

Figure 250: Japan Market Attractiveness by Route of Administration, 2023 to 2033

Figure 251: Japan Market Attractiveness by End User, 2023 to 2033

Figure 252: Japan Market Attractiveness by Country, 2023 to 2033

Figure 253: MEA Market Value (US$ million) by Product Type, 2023 to 2033

Figure 254: MEA Market Value (US$ million) by Raw Material, 2023 to 2033

Figure 255: MEA Market Value (US$ million) by Capsule Size, 2023 to 2033

Figure 256: MEA Market Value (US$ million) by Route of Administration, 2023 to 2033

Figure 257: MEA Market Value (US$ million) by End User, 2023 to 2033

Figure 258: MEA Market Value (US$ million) by Country, 2023 to 2033

Figure 259: MEA Market Value (US$ million) Analysis by Country, 2017 to 2033

Figure 260: MEA Market Volume (Units) Analysis by Country, 2017 to 2033

Figure 261: MEA Market Value Share (%) and BPS Analysis by Country, 2023 to 2033

Figure 262: MEA Market Y-o-Y Growth (%) Projections by Country, 2023 to 2033

Figure 263: MEA Market Value (US$ million) Analysis by Product Type, 2017 to 2033

Figure 264: MEA Market Volume (Units) Analysis by Product Type, 2017 to 2033

Figure 265: MEA Market Value Share (%) and BPS Analysis by Product Type, 2023 to 2033

Figure 266: MEA Market Y-o-Y Growth (%) Projections by Product Type, 2023 to 2033

Figure 267: MEA Market Value (US$ million) Analysis by Raw Material, 2017 to 2033

Figure 268: MEA Market Volume (Units) Analysis by Raw Material, 2017 to 2033

Figure 269: MEA Market Value Share (%) and BPS Analysis by Raw Material, 2023 to 2033

Figure 270: MEA Market Y-o-Y Growth (%) Projections by Raw Material, 2023 to 2033

Figure 271: MEA Market Value (US$ million) Analysis by Capsule Size, 2017 to 2033

Figure 272: MEA Market Volume (Units) Analysis by Capsule Size, 2017 to 2033

Figure 273: MEA Market Value Share (%) and BPS Analysis by Capsule Size, 2023 to 2033

Figure 274: MEA Market Y-o-Y Growth (%) Projections by Capsule Size, 2023 to 2033

Figure 275: MEA Market Value (US$ million) Analysis by Route of Administration, 2017 to 2033

Figure 276: MEA Market Volume (Units) Analysis by Route of Administration, 2017 to 2033

Figure 277: MEA Market Value Share (%) and BPS Analysis by Route of Administration, 2023 to 2033

Figure 278: MEA Market Y-o-Y Growth (%) Projections by Route of Administration, 2023 to 2033

Figure 279: MEA Market Value (US$ million) Analysis by End User, 2017 to 2033

Figure 280: MEA Market Volume (Units) Analysis by End User, 2017 to 2033

Figure 281: MEA Market Value Share (%) and BPS Analysis by End User, 2023 to 2033

Figure 282: MEA Market Y-o-Y Growth (%) Projections by End User, 2023 to 2033

Figure 283: MEA Market Attractiveness by Product Type, 2023 to 2033

Figure 284: MEA Market Attractiveness by Raw Material, 2023 to 2033

Figure 285: MEA Market Attractiveness by Capsule Size, 2023 to 2033

Figure 286: MEA Market Attractiveness by Route of Administration, 2023 to 2033

Figure 287: MEA Market Attractiveness by End User, 2023 to 2033

Figure 288: MEA Market Attractiveness by Country, 2023 to 2033

Recommendations

Healthcare

Advanced Empty Capsule Market

Published : June 2023

Healthcare

Capsule Endoscope and Workstations Market

Published : September 2022

Explore Healthcare Insights

View Reports