The epoxy resin industry in Asia Pacific is experiencing steady expansion driven by industrial growth, rapid urbanization, and the increasing use of advanced materials in construction and manufacturing. Rising investments in infrastructure, transportation, and electronics are creating a strong demand base for epoxy resins due to their superior adhesion, chemical resistance, and mechanical strength.
The current market scenario reflects robust utilization across end-use industries such as paints and coatings, composites, and adhesives, supported by favorable government policies and expanding production capacities in countries like China, India, and Japan. The future outlook is characterized by growing environmental awareness and a gradual shift toward bio-based epoxy resins to align with sustainability objectives.
The growth rationale centers on continuous technological innovation, cost optimization through localized production, and strategic partnerships that enhance supply chain resilience Collectively, these factors are expected to strengthen market penetration and maintain Asia Pacific’s dominant position in the global epoxy resin landscape.
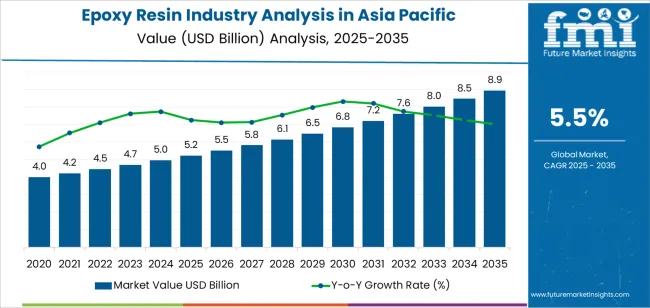
| Metric | Value |
|---|---|
| Epoxy Resin Industry Analysis in Asia Pacific Estimated Value in (2025 E) | USD 5.2 billion |
| Epoxy Resin Industry Analysis in Asia Pacific Forecast Value in (2035 F) | USD 8.9 billion |
| Forecast CAGR (2025 to 2035) | 5.5% |
The market is segmented by Product Type, Form, Application, and End-Use and region. By Product Type, the market is divided into Bisphenol-A Epoxy Resins, Bisphenol-F Type Epoxy Resins, Aliphatic Epoxy Resins, Novolac Epoxy Resins, and Others. In terms of Form, the market is classified into Liquid and Solid. Based on Application, the market is segmented into Paints And Coating, Adhesives, Composite, Electrical, Molds, and Others. By End-Use, the market is divided into Construction, Automotive, Electronics, Aerospace, Consumer Goods, and Others. Regionally, the market is classified into North America, Latin America, Western Europe, Eastern Europe, Balkan & Baltic Countries, Russia & Belarus, Central Asia, East Asia, South Asia & Pacific, and the Middle East & Africa.
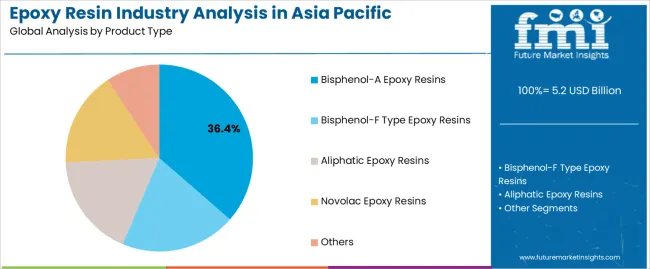
The Bisphenol-A epoxy resins segment, accounting for 36.40% of the product type category, has been leading the market due to its broad compatibility with various industrial applications and cost-effectiveness in large-scale production. The segment’s growth has been supported by its extensive use in coatings, adhesives, and electrical laminates, where high strength and chemical resistance are critical.
Continuous development of high-performance grades and improved curing agents has further enhanced material performance, meeting the evolving requirements of industrial users. Regional manufacturers have expanded production capacities to address the rising demand from construction and electronics sectors.
As technological innovation continues and product quality improves, Bisphenol-A epoxy resins are expected to retain their market leadership, driving consistent demand across multiple downstream applications.
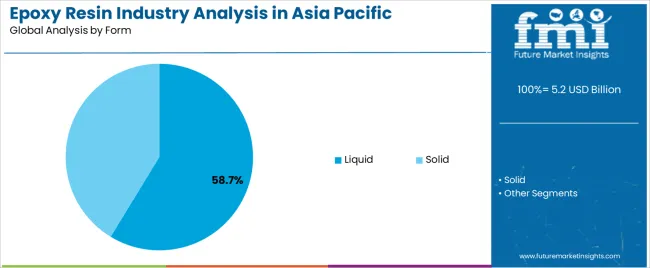
The liquid segment, holding 58.70% of the form category, dominates the market due to its ease of application, superior blending characteristics, and suitability for diverse industrial processes. Its widespread use in coatings, composites, and adhesives has been reinforced by high reactivity and flexibility during formulation.
Manufacturers prefer liquid epoxy resins for their process efficiency and ability to form strong, durable bonds in both structural and protective applications. Expanding infrastructure projects and industrial automation in Asia Pacific have increased consumption, particularly in sectors demanding lightweight and corrosion-resistant materials.
Technological enhancements in resin modification and processing have improved performance consistency, ensuring the liquid segment maintains its leading position in the regional epoxy resin market.
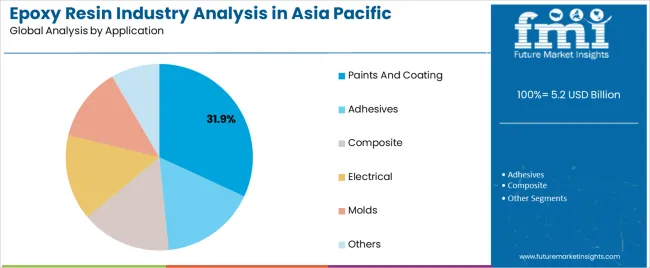
The paints and coatings segment, representing 31.90% of the application category, has been the leading application area due to its critical role in protective, decorative, and industrial uses. The segment’s growth is supported by the rapid expansion of construction and automotive industries, which require high-performance coatings offering durability, chemical resistance, and aesthetic appeal.
Epoxy-based coatings are preferred for their superior adhesion and weather resistance, making them suitable for infrastructure and marine applications. Manufacturers are increasingly focusing on low-VOC and eco-friendly formulations to comply with environmental regulations, which is further enhancing adoption.
The ongoing development of smart coatings and improved formulation technologies is expected to sustain the segment’s dominance, ensuring continued growth within the Asia Pacific epoxy resin industry.
Industry to Expand Nearly 1.1X through 2035
Asia Pacific epoxy resin industry is predicted to expand around 1.1x through 2035, amid a 3.1% surge in expected CAGR compared to the historical one. This is due to growing demand for bisphenol-A epoxy resins and increasing use of cast iron repair epoxy in the construction industry.
Sales of epoxy resins in Asia Pacific are also expected to rise due to rapid population growth, increasing government initiatives, and growing awareness about new types of resins. By 2035, the total industry revenue is set to reach USD 8,496.3 million.
China to Create New Opportunities for Epoxy Resin Manufacturers
China is expected to retain its commanding position in Asia Pacific epoxy resin industry during the forecast period. It is set to hold around 36.4% of the share in 2035.
China's robust manufacturing infrastructure, including advanced production facilities and skilled workforce, contributes to its dominance in the epoxy resin industry. The country's well-established industrial base enables efficient and cost-effective production of epoxy resin. This allows manufacturers to meet both domestic and international requirements with competitive pricing and high-quality products.
China benefits from abundant access to raw materials essential for epoxy resin production, such as epichlorohydrin and bisphenol-A. The country's proximity to key suppliers and strategic investments in upstream industries ensure a stable & reliable supply chain for epoxy resin manufacturers.
As the world's most prominent consumer of epoxy resins, China's strong domestic demand drives significant growth in the industry. The country's expanding construction, automotive, electronics, and infrastructure sectors require epoxy resin for several applications. These include coatings, adhesives, composites, and electrical components.
China's supportive government policies and incentives play a pivotal role in fostering growth of the silicone plumbing epoxy resin industry. Subsidies on research & development and investment incentives on infrastructure development are set to propel the competitiveness of epoxy resin manufacturers over manufacturers of other countries.
Sales of epoxy resins in Asia Pacific grew at a CAGR of 2.4% between 2020 and 2025. Total industry revenue reached about USD 4,715.5 million in 2025. In the forecast period, Asia Pacific epoxy resin industry is set to thrive at a CAGR of 5.5%.
| Historical CAGR (2020 to 2025) | 2.4% |
|---|---|
| Forecast CAGR (2025 to 2035) | 5.5% |
Asia Pacific epoxy resin industry witnessed steady growth between 2020 and 2025. This was due to increased demand for the chemical from construction and automotive industries. Also, a high focus on improving product quality pushed demand.
The COVID-19 pandemic underscored the crucial usage of synthetic resins in several applications. Companies became aware of the importance of epoxy resins in their applications. This led to increased demand for the chemical.
Over the forecast period, Asia Pacific epoxy resin industry is poised to exhibit healthy growth, totaling a valuation of USD 8,496.3 million by 2035. This is due to a combination of several factors. It includes increasing demand for downstream products, technological advancements in production processes, and robust expansion of end-use industries.
Automobile and Construction Sectors to Drive Demand
Significant growth of key industries like automobile and construction in Asia Pacific is driving demand for epoxy resins in several applications, especially paints and coatings. Increasing production and sales of vehicles in India and China are ensuring a constant demand for protective coatings to enhance aesthetics, corrosion resistance, and durability.
Stone coat epoxy resins offer superior adhesion and chemical resistance, making them ideal for automotive applications where performance and appearance are critical. Ongoing urbanization and infrastructure development projects across Asia Pacific are creating high demand for epoxy resin-based coatings. These are likely to help safeguard structures against corrosion, weathering, and wear.
Wind Energy Sector to be a Leading Consumer
Epoxy resin-based coatings have found a crucial role in protecting wind turbines components, such as blades and towers, from harsh environmental conditions including moisture, UV radiation, and mechanical stress. These coatings ensure increasing longevity of the structures and components.
One more area where epoxy resin is finding increased application is in the manufacturing of wind turbine blades. This is due to their exceptional mechanical properties, lightweight nature, and design flexibility.
Epoxy composites offer superior strength-to-weight ratios, enabling the construction of longer and more efficient blades capable of capturing greater wind energy. Use of epoxy resins in blade manufacturing contributes to reducing material costs, enhancing structural integrity, and improving turbine efficiency.
Epoxy Resin Adhesives and Composites Gain Traction
Increasing manufacturing activities in key countries of Asia Pacific, such as India and China, are pushing demand for epoxy resins for several applications. Industries such as automotive, electronics, aerospace, and consumer goods are experiencing rapid growth.
Epoxy resin-based adhesives play a critical role in bonding several substrates, including metals, plastics, ceramics, and composites. These offer strong and durable bonds essential for assembly processes.
Epoxy resin is lightweight, which is encouraging several end-use industries to use it as a composite material. Epoxy resin-based composites are widely used in automotive parts, aircraft components, sporting goods, and consumer electronics. This is mainly due to their superior mechanical properties, design flexibility, and corrosion resistance.
ECH and BPA Pricing Volatility Constrains Epoxy Resin Production and Cost
The production and cost of epoxy resins are highly dependent on the pricing of key raw materials, particularly epichlorohydrin (ECH) and bisphenol A (BPA). Volatility in ECH and BPA pricing poses challenges for epoxy resin manufacturers in predicting production costs and pricing strategies. Sharp increases in raw material prices can erode profit margins and reduce competitiveness, particularly for manufacturers operating in highly competitive industries.
The reliance on ECH and BPA as primary raw materials limits the flexibility of epoxy resin manufacturers to mitigate price risks through alternative sourcing or substitution. Asia Pacific epoxy resin industry is closely tied to its production cost. The pricing strategy and industry positioning are hindered due to uncertainties in its raw material pricing.
Skin and Eye Irritation Due to Epoxy Resin Fumes
Inhalation or direct contact with epoxy resin fumes can lead to irritation of the skin, eyes, and respiratory tract. It can further causediscomfort and potential health complications for individuals exposed to these substances.
Any contact with epoxy resin fumes or vapor can cause skin irritation along with redness, itching, and even rashes. Prolonged or repeated exposure may result in more severe dermatitis or allergic reactions. This is set to necessitate medical intervention and potentially affect work productivity and quality of life.
Eye irritation can occur when epoxy resin fumes come into contact with the eyes, causing redness, tearing, and a burning sensation. Continued exposure may lead to more severe eye injuries, such as corneal abrasions or chemical burns.
Workers and manufacturers of epoxy resins are advised to adhere to strict safety protocols. These include proper ventilation, personal protective equipment (PPE) such as respirators, goggles, and gloves, and regular monitoring of air quality to minimize exposure to harmful fumes.
The table below highlights revenues of key countries in Asia Pacific epoxy resin industry. China, India, and Japan are expected to remain the top three consumers of epoxy resin, with expected valuations of USD 3,004.2 million, USD 1,655.7 million, and USD 1,585.4 million, respectively in 2035.
| Countries | Asia Pacific Epoxy Resin Industry Revenue (2035) |
|---|---|
| China | USD 3,004.2 million |
| India | USD 1,655.7 million |
| Japan | USD 1,585.4 million |
| South Korea | USD 1,376.8 million |
The table below shows the estimated growth rates of several countries in the crystal clear epoxy resin industry. China, India, and ASEAN are set to record high CAGRs of 6.6%, 6.5%, and 5.9%, respectively, through 2035.
| Countries | Projected Asia Pacific Epoxy Resin Industry CAGR (2025 to 2035) |
|---|---|
| China | 6.6% |
| India | 6.5% |
| ASEAN | 5.9% |
| South Korea | 4.5% |
India’s epoxy resin industry size is projected to reach USD 1,655.7 million by 2035. Over the assessment period, demand for epoxy resins in India is set to rise at 6.5% CAGR.
Expanding industrial activities in India are driving demand for epoxy resins across several sectors, fueling growth and innovation across the country's manufacturing landscape. India’s increasing economy and emphasis on infrastructure development are also projected to boost sales. Industries like automotive, electronics, and construction are experiencing rapid expansion, boosting the need for high-performance materials like epoxy resins.
India’s construction sector is undergoing rapid urbanization and infrastructure development, fueled by government initiatives such as smart cities and ‘Make in India.’ Epoxy resin-based coatings, adhesives, and sealants play a vital role in infrastructure projects. These offer durability, corrosion resistance, and chemical protection for structures such as bridges, buildings, and industrial facilities.
The country’s ambitious infrastructure development projects, including development of ports, roads, and industrial corridors, require substantial quantities of epoxy-based construction materials. This high demand from the construction sector adds to the overall consumption of aluminum-bonding epoxy resins in India.
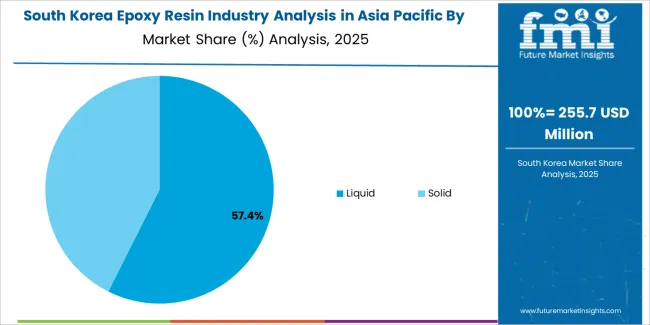
South Korea is poised to demonstrate significant growth in Asia Pacific epoxy resin industry. It is driven by factors like a strong industrial base, technological expertise, and good strategic positioning in the country.
South Korea is home to several leading chemical and petrochemical companies with state-of-the-art production facilities for epoxy resin manufacturing. These companies benefit from robust research & development initiatives. These enable them to produce high-quality epoxy resins with superior performance characteristics.
South Korea's well-developed transportation networks facilitate efficient logistics and supply chain management. These further allow manufacturers to serve both domestic and international industries seamlessly.
In addition to its vast and sophisticated manufacturing activities, South Korea’s thriving end-use industries contribute to growth of epoxy resin sales. The country's automotive, electronics, construction, and marine sectors are significant consumers of high strength epoxy resin-based products.
Sales of epoxy resins in South Korea are projected to soar at a CAGR of around 4.5% during the evaluation period. Total valuation in the country is anticipated to reach USD 1,376.8 million by 2035.
ASEAN countries are experiencing rapid urbanization and industrialization. These nations continue to invest in infrastructure projects, automotive manufacturing, electronics production, and construction activities.
Demand for epoxy resin-based products such as coatings, adhesives, and composites is expected to surge significantly. This presents an opportunity for UV-resistant epoxy resin manufacturers to capitalize on growing demand and expand their presence in the union.
ASEAN's strategic location and favorable trade agreements facilitate international trade and investment, enabling seamless access to regional and global industries. Epoxy resin manufacturers can leverage ASEAN's extensive network of free trade agreements (FTAs) and economic partnerships. They can enhance industry penetration, establish strategic alliances, and strengthen supply chain capabilities.
The commitment to sustainable development and environment conservation in ASEAN countries presents opportunities for manufacturers to innovate and develop new formulations. Its efforts to promote innovation through the ASEAN Economic Community (AEC) and the ASEAN Smart Cities Network (ASCN) create a conducive ecosystem for growth.
The epoxy resin industry value in ASEAN is anticipated to total USD 405.9 million by 2035. Over the forecast period, epoxy resin demand is set to increase at a steady CAGR of 5.9%.
The section below shows the bisphenol-A epoxy resin segment dominating based on product type. It is forecast to thrive at 3.9% CAGR between 2025 and 2035.
Based on form, the liquid segment is anticipated to hold a leading share through 2035. It is set to witness a CAGR of 5.2% during the forecast period.
Based on application, the paint and coating segment is anticipated to hold a crucial share through 2035. It is likely to showcase a CAGR of 4.7% during the forecast period.
Based on end-use, the construction segment is anticipated to hold a significant share through 2035. It is expected to exhibit a CAGR of 4.9% during the forecast period.
| Top Segment (Product Type) | Bisphenol-A Epoxy Resins |
|---|---|
| Predicted CAGR (2025 to 2035) | 3.9% |
Bisphenol-A epoxy resins are expected to dominate Asia Pacific epoxy resin industry with a volume share of about 35.4% in 2025. This is attributable to the rising usage of bisphenol-A epoxy resins for several applications due to their effectiveness and easy-to-use nature.
Bisphenol-A epoxy resins are versatile thermosetting polymers widely used in several industrial applications. They are known their exceptional mechanical strength, chemical resistance, and adhesion properties. These offer excellent durability and dimensional stability, making them suitable for demanding environments and high-performance applications.
Novolac epoxy resins, on the other hand, are anticipated to witness a considerable CAGR of 5.3% during the forecast period. This is because these resins are slowly finding usage in key industries due to their superior heat resistance characteristics.
| Top Segment (Application) | Paints and Coating |
|---|---|
| Projected CAGR (2025 to 2035) | 4.7% |
Epoxy resins are set to be extensively utilized in paints and coatings due to their exceptional properties. Epoxy resin-based coatings are widely employed in industries for applications such as corrosion protection, industrial flooring, concrete repair, and automotive finishes.
The coatings provide long-lasting protection against harsh environmental conditions, chemicals, abrasion, and UV radiation. Hence, these are considered ideal for demanding applications in diverse sectors such as manufacturing, infrastructure, marine, and automotive.
Epoxy resin coatings in Asia Pacific also offer excellent adhesion to a wide range of substrates, including metals, concrete, wood, and plastics. These ensure reliable performance and durability in different environments. Their versatility allows for customization with additives to enhance specific properties such as flexibility, hardness, and color stability.
The paints and coating segment is projected to thrive at 4.7% CAGR during the forecast period. It is set to attain a valuation of USD 2,749.1 million by 2035.
| Top Segment (End-use) | Construction |
|---|---|
| Projected CAGR (2025 to 2035) | 4.9% |
Epoxy resins are set to be used in the construction industry as a structural adhesive and bonding agent. These are commonly used to bond multiple construction materials such as concrete, metal, wood, and stone. These help in providing strong and durable connections in building structures, bridges, and infrastructure projects.
Epoxy resins are also widely employed as a coating and sealant in construction applications. Epoxy coatings are applied to concrete floors, walls, and surfaces to enhance durability, resist abrasion, and protect against chemical damage. These coatings are commonly used in industrial facilities, warehouses, parking garages, and commercial buildings to provide seamless and easy-to-clean surfaces.
Epoxy resin-based composites are expected to be utilized in construction to reinforce concrete structures, repair cracks, and strengthen building components. These composites offer excellent tensile strength, corrosion resistance, and durability, making them suitable for structural repairs, retrofitting, and restoration projects.
The construction segment is projected to thrive at 4.9% CAGR during the forecast period. It is set to attain a valuation of USD 2,508.1 million by 2035.
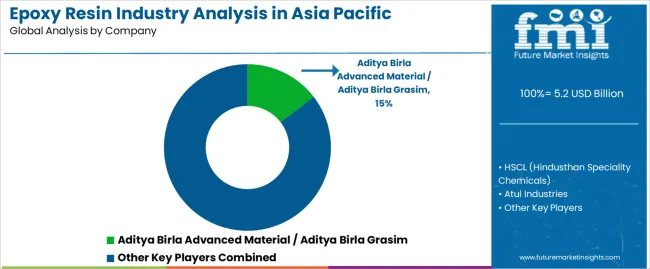
Asia Pacific epoxy resin industry is consolidated, with leading players accounting for significant shares. Aditya Birla Advanced Material / Aditya Birla Grasim, HSCL (Hindusthan Speciality Chemicals), Atul Industries, Macro Polymers, DIC Color & Comfort, Mitsubishi Chemical, Chang Chun Petrochemical, and Nan Ya Plastics Corporation are the leading manufacturers and suppliers of epoxy resins listed in the report.
Key epoxy resin manufacturers are focusing on generating high shares by engaging in new products launches. They are investing huge sums in research & development activities to discover innovative products and gain a large consumer base. Some of the other companies are joining hands with distributors, suppliers, and stakeholders to co-develop novel products.
Recent Developments in Asia Pacific Epoxy Resin Industry
| Attribute | Details |
|---|---|
| Estimated Industry Size (2025) | USD 4,953.2 million |
| Projected Industry Size (2035) | USD 8,496.3 million |
| Anticipated Growth Rate (2025 to 2035) | 5.5% |
| Historical Data | 2020 to 2025 |
| Forecast Period | 2025 to 2035 |
| Quantitative Units | Value (USD million) and Volume (metric tons) |
| Report Coverage | Revenue Forecast, Volume Forecast, Company Ranking, Competitive Landscape, Growth Factors, Trends, and Pricing Analysis |
| Industry Segments Covered |
Product Type, Form, Application, End-use, Country |
| Country Covered |
China, India, South Korea, Japan, Australia & New Zealand, ASEAN, Rest of Asia Pacific |
| Key Companies Profiled |
Aditya Birla Advanced Material / Aditya Birla Grasim; HSCL (Hindusthan Speciality Chemicals); Atul Industries; Macro Polymers; DIC Color & Comfort; Mitsubishi Chemical; Kisco Ltd; Baling Petrochemical Company Limited; Dongke Group; Sanmu Group; Chang Chun Petrochemical; Nan Ya Plastics Corporation; Kukdo Chemical Co; Kolon Industries; Other Key Players |
The global epoxy resin industry analysis in asia pacific is estimated to be valued at USD 5.2 billion in 2025.
The market size for the epoxy resin industry analysis in asia pacific is projected to reach USD 8.9 billion by 2035.
The epoxy resin industry analysis in asia pacific is expected to grow at a 5.5% CAGR between 2025 and 2035.
The key product types in epoxy resin industry analysis in asia pacific are bisphenol-a epoxy resins, bisphenol-f type epoxy resins, aliphatic epoxy resins, novolac epoxy resins and others.
In terms of form, liquid segment to command 58.7% share in the epoxy resin industry analysis in asia pacific in 2025.


Full Research Suite comprises of:
Market outlook & trends analysis
Interviews & case studies
Strategic recommendations
Vendor profiles & capabilities analysis
5-year forecasts
8 regions and 60+ country-level data splits
Market segment data splits
12 months of continuous data updates
DELIVERED AS:
PDF EXCEL ONLINE
Epoxy Type Stabilizers Market Size and Share Forecast Outlook 2025 to 2035
Epoxy Grouts Market Size and Share Forecast Outlook 2025 to 2035
Epoxy Putty and Construction Chemicals Market Size and Share Forecast Outlook 2025 to 2035
Epoxy Active Diluent Market Size and Share Forecast Outlook 2025 to 2035
Epoxy Composite Market Size and Share Forecast Outlook 2025 to 2035
Epoxy Encapsulation Material Market
Epoxy Paint Thinner Market Growth - Trends & Forecast 2025 to 2035
Epoxy Paint Market Growth – Trends & Forecast 2024-2034
Epoxy Curing Agent Market Growth - Trends & Forecast 2025 to 2035
Epoxy Resin Market Growth – Trends & Forecast 2024-2034
2K Epoxy Adhesives Market Size and Share Forecast Outlook 2025 to 2035
Concrete Epoxy Repair Market Size and Share Forecast Outlook 2025 to 2035
Fast Curing Epoxy Adhesive Market Size and Share Forecast Outlook 2025 to 2035
High Performance Epoxy Coating Market Size and Share Forecast Outlook 2025 to 2035
Resin Capsule Market Forecast and Outlook 2025 to 2035
Resin Cement for Luting Market Size and Share Forecast Outlook 2025 to 2035
Resin Pigments Market Size and Share Forecast Outlook 2025 to 2035
PE Resins Market Size and Share Forecast Outlook 2025 to 2035
Ink Resin Market Size and Share Forecast Outlook 2025 to 2035
Cast Resin Transformer Market Size and Share Forecast Outlook 2025 to 2035

Thank you!
You will receive an email from our Business Development Manager. Please be sure to check your SPAM/JUNK folder too.
Chat With
MaRIA