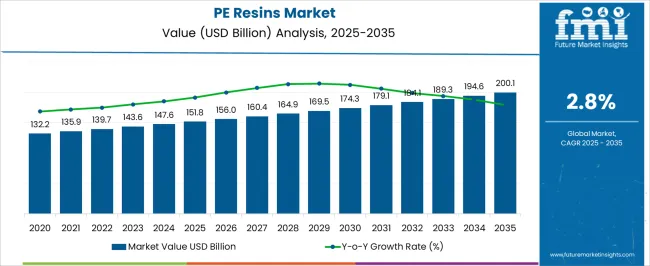
The PE Resins Market is estimated to be valued at USD 151.8 billion in 2025 and is projected to reach USD 200.1 billion by 2035, registering a compound annual growth rate (CAGR) of 2.8% over the forecast period.
| Metric | Value |
|---|---|
| PE Resins Market Estimated Value in (2025 E) | USD 151.8 billion |
| PE Resins Market Forecast Value in (2035 F) | USD 200.1 billion |
| Forecast CAGR (2025 to 2035) | 2.8% |
The PE resins market is experiencing steady expansion supported by rising demand for versatile, lightweight, and cost effective plastic materials across multiple industries. Growing use of polyethylene resins in packaging, automotive, construction, and consumer goods is driving sustained consumption.
Regulatory pressures to improve recyclability and industry initiatives to enhance the sustainability profile of PE resins are prompting manufacturers to invest in advanced material technologies. Developments in high performance grades of resins that offer improved durability, chemical resistance, and processing efficiency are reinforcing market adoption.
Increasing urbanization, growth in e commerce, and the proliferation of packaged goods are expected to sustain momentum. The outlook remains favorable as PE resins continue to deliver scalable solutions that balance functionality, cost effectiveness, and sustainability requirements in global supply chains.
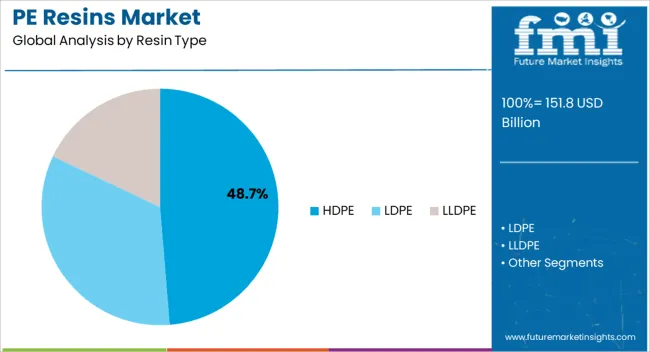
The HDPE resin type segment is projected to account for 48.70% of the overall market by 2025, positioning it as the most significant resin category. Its growth is driven by superior tensile strength, chemical resistance, and versatility in applications ranging from rigid containers to industrial components.
HDPE’s recyclability and adaptability to sustainable production practices have also enhanced its adoption, particularly in regions emphasizing circular economy initiatives. Cost efficiency in large scale production and compatibility with modern processing methods further reinforce its dominance.
As industries demand durable and eco friendly materials, HDPE continues to secure its leadership within the resin type category.
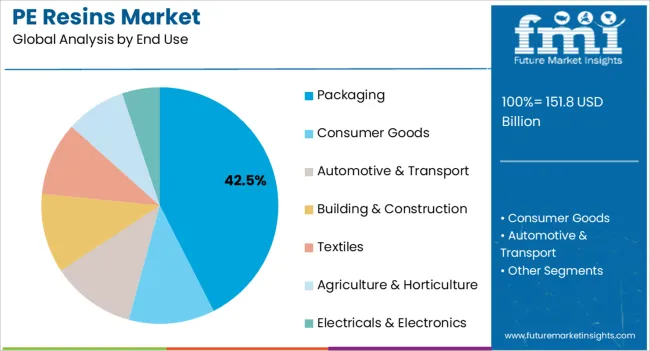
The packaging segment is expected to contribute 42.50% of the total market revenue by 2025, making it the leading end use category. Its growth is supported by expanding consumption of packaged food, beverages, and personal care products as well as the rapid rise of e commerce logistics.
PE resins offer flexibility, durability, and moisture resistance, making them highly suitable for films, pouches, bottles, and containers. Increasing focus on lightweight and recyclable packaging has further strengthened demand.
Continuous innovation in barrier properties and sustainable packaging formats has enabled PE resins to maintain a central role in meeting consumer and regulatory expectations. This consistent performance establishes packaging as the dominant end use driver in the PE resins market.
The high concentration of resin manufacturers in the Asia Pacific has made the market more competitive. It is another factor boosting the expansion of polyethylene resin market in the region. Against the backdrop of physical properties such as high moisture, and abrasion resistance the demand for different grades of PE polymer is expected to increase over the forecast period.
According to reliable sources, the Asia Pacific is home to 60% of the world’s youth and this region is one of the key contributors to the growth of the global consumer electronics industry. As millennial generation is more inclined to purchase new gadgets and remain up-to-date with trends.
This can also be attributed to the growing middle class in the region. Several countries in the Asia Pacific region have experienced high growth GDP rates in the last decade despite the COVID-19 impact. Resulting in increased annual disposable income. Increased digital awareness has resulted in more people exploring new products, such as smartphones, and tablets, among other household electronic gadgets.
PE resins are widely used in the production of surface protection films for flat displays on these gadgets. The Asia Pacific PE resins industry is expected to enjoy healthy growth over the forecast period, on the backdrop of increased consumer electronics sales in the region. However, consumers have shown more inclination toward portable consumer electronics. This means sales of specialty films such as surface protection films for smartphones, laptops, and tablets are projected to outdo that for products such as televisions.
PE resins industry is expected to showcase a remarkable 3.3% CAGR between the forecast years, contrary to the 2.8% CAGR witnessed during historical years. This exponential rise in growth is accounted for due to an increase in demand from packaging and consumer end-use.
To fulfilling the escalating demand for PE polymers, local and multinational resin manufacturers are strengthening their supply chain capabilities. About 41% market share of global PE resin demand is from the Asia Pacific.
Strong demand for consumer goods and the homecare industry in India, ASEAN countries, and China is positively impacting the PE resin market across the Asia Pacific region.
Some other distinctive advantages of the use of plastic are the reduced carbon footprint of manufacturers by limiting the consumption of energy during the production process. Additionally, the ability to protect goods & food, thereby reducing breakage and waste.
Apart from the application and physical properties of plastic, plastic also has a strong influence on the global economy. It has the potential to create a multiplier effect in the regional economy thus boosting the demand for the PE resins industry.
The market has a very large and complex supply chain network and to ensure the safety and surety of goods, plastic packaging is playing a key role. For securing and palletizing goods during transport manufacturers are relying on LLDPE shrink and stretch films for over-wrapping and stacking of goods.
Huge trade in the region is generating the demand for LLDPE film and thus boosting the growth in the plastic resin market. Apart from exports, the use of plastic films for packaging fresh and processed food is also positively impacting the demand for PE resins.
PE resins of film grade are now more in demand due to the rapidly increasing traction of flexible packaging in the North American market. North America accounts for 1/4th of the world's flexible packaging market, thus, creating immense opportunity for the PE resins industry.
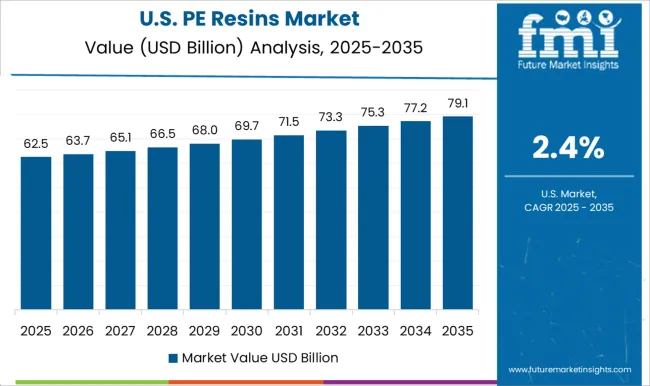
| Attribute | Details |
|---|---|
| Region | The United States |
| Market Share % 2025 | 16.4% |
| Market Size (USD million) by 2025 | USD 23,554.04 million |
| Market Size (USD million) by End of Forecast Period (2035) | USD 32,588.81 million |
The PE resins market in the United States is expected to attain a market value of USD 23,554.04 million by the end of 2025. The United States is expected to capture the single-leading market share for the PE resins industry globally. According to the United States Department of Agriculture, food industries in 2024, account for almost USD 1.7 trillion. Packaging and consumer goods are projected to witness subsequent growth in the region and lead the United States end-use segment by 2035.
| Country | CAGR % (2025 to 2035) |
|---|---|
| India | 4.3% |
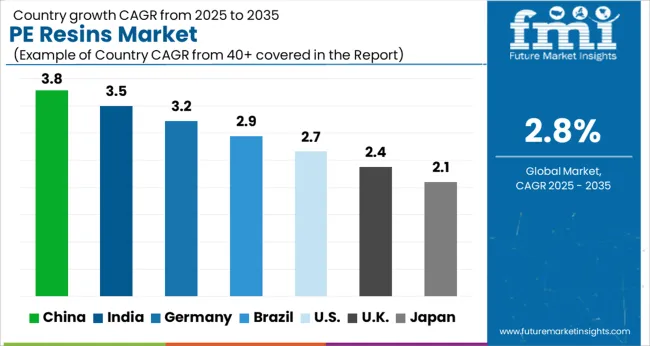
In the Asia Pacific, the Indian PE resins industry is anticipated to expand at a CAGR of 4.3% during the period 2025 to 2035. The FMCG sector in India is continuously increasing because of the rise in demand for high-end quality products, along with increasing per capita income in the country as India is an economy which is driven by the consumer.
As per FMI, India’s fast-moving consumer goods market is expected to increase exponentially and reach a value of USD 151.8 billion in the year 2025. The consistent growth of the FMCG industry in India is expected to create notable demand for PE resin solutions during the forecast years.
The HDPE segment is expected to observe healthy growth over the forecast period. This can be attributed to the heightened demand for the product from the food and beverages sector. Following this, the segment growth is also fueled by the restrictions imposed on the use of single-use plastics.
The ongoing surge in the demand for packaging raw materials is further boosting the HDPE segment growth. Various benefits of HDPE resins include UV resistance, high quality, affordable, chemical resistance, and varied temperature tolerance. This is expected to make HDPE resins ideal solutions for substantial end-use such as packaging, consumer goods, automotive & transport, textiles, building & construction among others. This is projected to bolster the demand for HDPE resins in the forecast period.
| Segment | Market Share (2025) |
|---|---|
| Packaging | 35.5% |
Packaging and consumer goods are leading segments in end-use for the PE resins industry. These segments are projected to anticipate to collectively offer an incremental opportunity of USD 19.4 billion during the future years and are expected to hold 63% market share. Pre-packed consumer goods have seen an increase in demand because of the convenience factor which the millennial generation is deeply inclined toward.
The automotive & transport and building & construction are expected to hold 11% & 12% market shares respectively and expand at a 1.2 times expansion rate each. Developing countries are investing more in infrastructure to construct hospitals, industries, and many buildings. To improve their citizen’s standard of living and decrease the mortality rate.
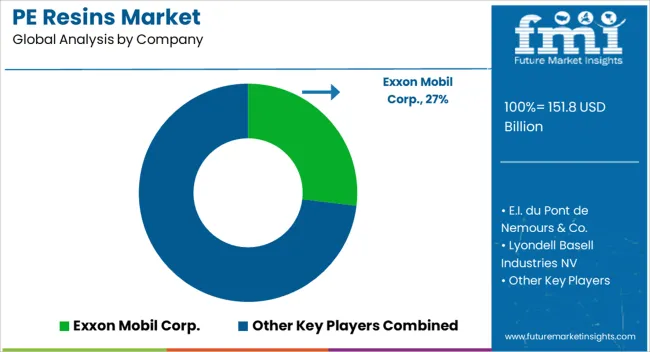
Leading PE resin manufacturers are committed to the research and development of the product. Moreover, they are consistently offering innovative PE resin solutions targeted towards specific end-use. Companies operating in the PE resins industry are aiming at product launches and expansions with other manufacturers.
| Attribute | Details |
|---|---|
| Forecast Period | 2025 to 2035 |
| Historical Data Available for | 2020 to 2025 |
| Market Analysis | USD million for Value and ‘000 Tonnes for Volume |
| Key Regions Covered | North America; the Asia Pacific; Western Europe; Eastern Europe; Latin America; the Middle East & Africa |
| Key Countries Covered | The United States, Canada, Brazil, Mexico, Germany, Italy, France, the United Kingdom, Spain, Russia, GCC Countries, China, India, and Australia & New Zealand |
| Key Segments Covered | Resin Type, End Use, Region |
| Key Companies Profiled | Exxon Mobil Corp.; E.I. du Pont de Nemours & Co.; Lyondell Basell Industries NV; LG Chem Ltd.; Formosa Plastics Corporation; The Dow Chemical Company; Saudi Arabia Basic Industries Corporation; Ineos Group Limited; Chevron Phillips Chemical Co. LLC; Saudi International Petrochemical Company - Sipchem; LANXESS Corporation; Braskem S.A.; Borouge; Versalis S.p.A.; NOVA Chemicals Corporation; BASF SE |
| Report Coverage | Market Forecast, Company Share Analysis, Competition Intelligence, DROT Analysis, Market Dynamics and Challenges, and Strategic Growth Initiatives |
| Customization & Pricing | Available upon Request |
The global PE resins market is estimated to be valued at USD 151.8 billion in 2025.
The market size for the PE resins market is projected to reach USD 200.1 billion by 2035.
The PE resins market is expected to grow at a 2.8% CAGR between 2025 and 2035.
The key product types in PE resins market are hdpe, ldpe and lldpe.
In terms of end use, packaging segment to command 42.5% share in the PE resins market in 2025.


Our Research Products

The "Full Research Suite" delivers actionable market intel, deep dives on markets or technologies, so clients act faster, cut risk, and unlock growth.

The Leaderboard benchmarks and ranks top vendors, classifying them as Established Leaders, Leading Challengers, or Disruptors & Challengers.

Locates where complements amplify value and substitutes erode it, forecasting net impact by horizon

We deliver granular, decision-grade intel: market sizing, 5-year forecasts, pricing, adoption, usage, revenue, and operational KPIs—plus competitor tracking, regulation, and value chains—across 60 countries broadly.

Spot the shifts before they hit your P&L. We track inflection points, adoption curves, pricing moves, and ecosystem plays to show where demand is heading, why it is changing, and what to do next across high-growth markets and disruptive tech

Real-time reads of user behavior. We track shifting priorities, perceptions of today’s and next-gen services, and provider experience, then pace how fast tech moves from trial to adoption, blending buyer, consumer, and channel inputs with social signals (#WhySwitch, #UX).

Partner with our analyst team to build a custom report designed around your business priorities. From analysing market trends to assessing competitors or crafting bespoke datasets, we tailor insights to your needs.
Supplier Intelligence
Discovery & Profiling
Capacity & Footprint
Performance & Risk
Compliance & Governance
Commercial Readiness
Who Supplies Whom
Scorecards & Shortlists
Playbooks & Docs
Category Intelligence
Definition & Scope
Demand & Use Cases
Cost Drivers
Market Structure
Supply Chain Map
Trade & Policy
Operating Norms
Deliverables
Buyer Intelligence
Account Basics
Spend & Scope
Procurement Model
Vendor Requirements
Terms & Policies
Entry Strategy
Pain Points & Triggers
Outputs
Pricing Analysis
Benchmarks
Trends
Should-Cost
Indexation
Landed Cost
Commercial Terms
Deliverables
Brand Analysis
Positioning & Value Prop
Share & Presence
Customer Evidence
Go-to-Market
Digital & Reputation
Compliance & Trust
KPIs & Gaps
Outputs
Full Research Suite comprises of:
Market outlook & trends analysis
Interviews & case studies
Strategic recommendations
Vendor profiles & capabilities analysis
5-year forecasts
8 regions and 60+ country-level data splits
Market segment data splits
12 months of continuous data updates
DELIVERED AS:
PDF EXCEL ONLINE
Paper Processing Resins Market Size and Share Forecast Outlook 2025 to 2035
Chlorinated Polyethylene Resins and Elastomers (CPE) Market Size, Growth, and Forecast for 2025 to 2035
Personal Care Products Filling System Market Size and Share Forecast Outlook 2025 to 2035
Perfluorosulfonic Acid Fuel Cell Proton Membrane Market Size and Share Forecast Outlook 2025 to 2035
Peg Hammer Market Size and Share Forecast Outlook 2025 to 2035
Pet Food Pulverizer Market Size and Share Forecast Outlook 2025 to 2035
Pet Food Emulsifier Market Size and Share Forecast Outlook 2025 to 2035
Personal Fitness Training Software Market Size and Share Forecast Outlook 2025 to 2035
Permalloy Sputtering Target Market Size and Share Forecast Outlook 2025 to 2035
PET Film for Face Shield Market Size and Share Forecast Outlook 2025 to 2035
Pegfilgrastim Injection Market Size and Share Forecast Outlook 2025 to 2035
Permanent Magnet Integrated Air Compressor Market Size and Share Forecast Outlook 2025 to 2035
Pet Perfume Market Size and Share Forecast Outlook 2025 to 2035
Pet Shampoo Market Size and Share Forecast Outlook 2025 to 2035
Personal Emergency Response System (PERS) Market Size and Share Forecast Outlook 2025 to 2035
Pea Grits Market Size and Share Forecast Outlook 2025 to 2035
Permanent Magnet Motor Market Forecast Outlook 2025 to 2035
Pet Tick and Flea Prevention Market Forecast and Outlook 2025 to 2035
Pet Hotel Market Forecast and Outlook 2025 to 2035
PET Vascular Prosthesis Market Size and Share Forecast Outlook 2025 to 2035

Thank you!
You will receive an email from our Business Development Manager. Please be sure to check your SPAM/JUNK folder too.
Chat With
MaRIA