Polyamide Resins Market Outlook (2022-2032)

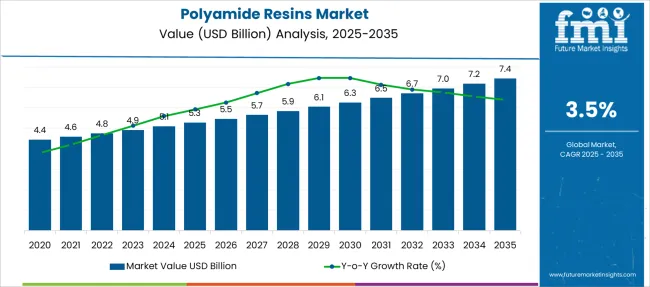
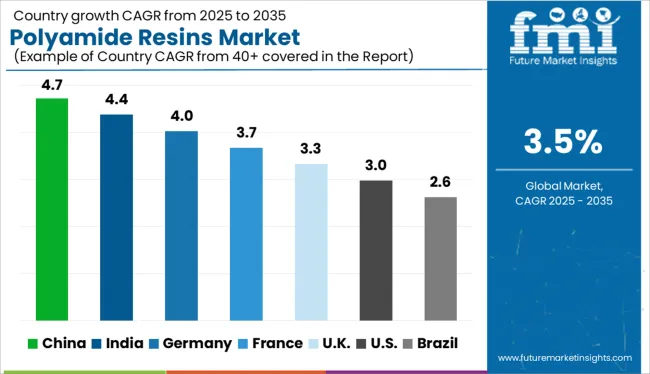
[304 Pages Report] The global polyamide resins market is projected to amass a revenue of around US$ 6.7 billion by 2032, up from US$ 4.6 billion in 2022 moving forward with a CAGR of 3.5% during the forecast period (2022-2032).

The substitution of polyamide resins for conventional resins, and the rising popularity of bio-based polyamide resins play a pivotal role in pushing the demand for polyamide resins forward.

Apart from this, the sales of polyamide resins are soared by the increasing adoption of recycled polyamide resins during the forecast period.

Report Attribute Details
Polyamide Resins Market Value (2022) US$ 4.6 Billion
Polyamide Resins Market Anticipated Forecast Value (2032) US$ 6.7 Billion
Polyamide Resins Market Projected Growth Rate (2022-2032) 3.5%

Polyamide resins are a type of micro-molecular polycondensed compound made from vegetable oil and unsaturated fatty acid dimer and polyamine, consisting of active groups, hydroxyl groups, and amide.

Hence, polyamide resins are also widely used in chemical plants due to their excellent chemical resistance due to their crystalline structure, thereby spiking the demand for polyamide resins.

The rising demand for polyamide resins can be attributed to its curing properties and plasticizer for epoxy resins.

In addition, the sales of polyamide resins are on the rise owing to its wide range of properties such as – flexibility, water resistance, wear resistance, corrosion resistance, better insulation and adhesion properties, etc.

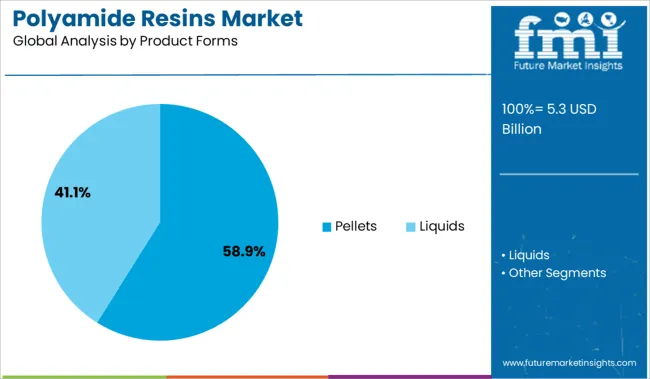
Adoption of polyamide resins is likely to grow significantly as these are available in pellets as well as liquid form, in turn, spiking the demand for polyamide resins.

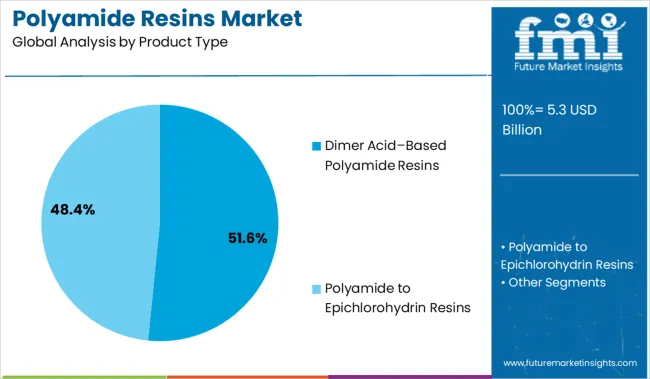
On the basis of its functional group, polyamide resins have two types which are - dimer acid–based (DAB) polyamide resins and polyamide-epichlorohydrin resins.

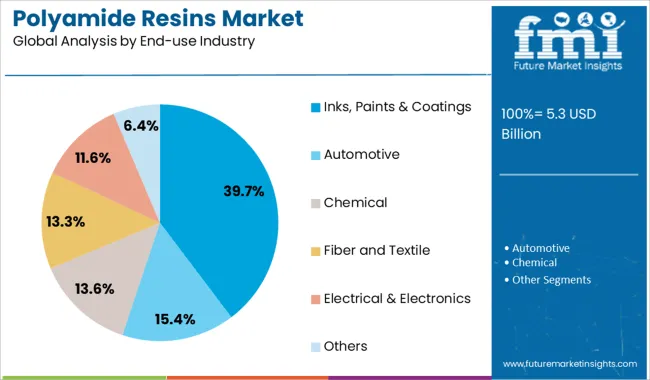
On account of the a wide range of application  of  polyamide resins across numerous end-use industries such as automotive, chemical, fiber, textile, electronics and electrical, inks, and among others, the sales of polyamide resins is likely to go up.

The demand for polyamide resins is also due to their high-density, opaqueness that outperforms other polymers in terms of strength and heat tolerance in automotive applications. 

Increased adoption of magazines, internet penetration, newspapers, and books is expected to drive demand for inks and printing, in turn, the demand for polyamide resins.

The sales of polyamide resins are fuelled by the increased product penetration by ongoing advances in lead-free soldering across the electronic connectors industry.

Emerging trends influencing the demand for polyamide resins as well as sales of polyamide resins include increased use of post-consumer recycled polyamide resins, and increased inter-material competition.

Furthermore, increasing automobile production is projected to drive the demand for polyamide resins as a result of the consistent demand for weight reduction in new vehicles over the years.

Don't pay for what you don't need

Customize your report by selecting specific countries or regions and save 30%!

What are the Key Polyamide Resins Market Dynamics?

The versatility of the flexographic printing market is a key factor fuelling the demand for polyamide resins, in turn, the growth of the global polyamide resins market.

In spite of e-books and internet having increased tremendously from last decade, the demand for magazines, newspapers, books, is also growing on a sound rate and the same is predicted to spur the sales of polyamide resins to an extent.

The demand from paper print sector, in turn, fuels the global polyamide resins market share.

Additionally, the demand for polyamide resins is also expected to augment form its use as a paper based packaging material whose end usage has rapidly grown in the recent times.

Polyamide resins have superior properties such as it provides the high clarity to the printing. Owing to this, sales of polyamide resins surges as it is mostly preferable in the flexographic printing inks. 

Other advantages associated with polyamide resins considered to soar the demand for polyamide resins are – it enhances gel recovery, has effective anti-blocking properties, water resistance properties, ester resistance properties, etc.

However, the stringent environmental regulations on polyamide resins are projected to hamper the global demand for polyamide resins.

For instance, polyamide resins listed under the various regulations such as – Toxic Substances Control Act (USA), Domestic Substances List (Canada).

The Philippine Inventory of Chemicals and Chemical Substances (Philippine), Australian Inventory of Chemical Substances (Australia), Existing and New Chemical Substances (Japan), and China's chemical inventory of existing chemical substances, etc.
Which Region is Expected to Dominate the Polyamide Resins Market?

Geographically, Europe is to hold a major polyamide resins market share and is anticipated to be a significant platform for polyamide resins manufactures as it accounts around 60% market in term of label manufacturing which consumes ink in a huge volume.

Further, Asia Pacific is expected to witness the maximum growth in term of polyamide resins primarily due to the growth in the automotive and chemical industry in the developing economies such as India and China.  

The sales of polyamide resins expected to upsurge in developing economies due to increasing disposable incomes, changing lifestyle which has increased the usage of packed food in these countries, growing retail industry, etc.

Furthermore, North America and Middle East & Africa expected to grow at a moderate growth rate and hold only a minor polyamide resins market share towards the end of the forecast period.
Nikhil Kaitwade
Nikhil Kaitwade

Principal Consultant

Talk to Analyst

Find your sweet spots for generating winning opportunities in this market.

How is the Competition in the Polyamide Resins Market?

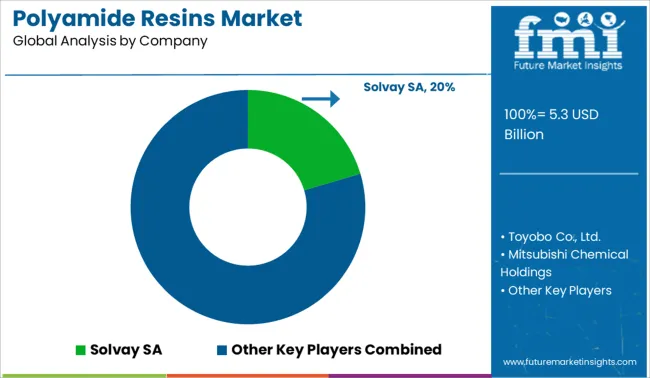
The global polyamide resins market is a highly fragmented market owing to the presence of small as well as international market players at the regional level.

Few of them are identified across the value chain of polyamide resins market are – Solvay SA, Toyobo Co., Ltd., Mitsubishi Chemical holdings, The Ensinger Group, Merck KGaA, RI Chemical Corporation, Gabriel, MPD Industries Pvt. Limited.

Some other key players are Arizona Chemical, The Dow Chemical Company, AnqingHongyu Chemical Co., Ltd, Jinan Tongfa Resin Co., Ltd., RITEKS, Cytech Coatings Private Limited, Thomas Swan & Co. Ltd., and among others.

Report Scope

Report Attribute Details
Growth Rate CAGR of 3.5% from 2022 to 2032
Base Year for Estimation 2021
Historical Data 2014-2020
Forecast Period 2022-2032
Quantitative Units Revenue in USD Billion, Volume in Kilotons and CAGR from 2022-2032
Report Coverage Revenue Forecast, Volume Forecast, Company Ranking, Competitive Landscape, Growth Factors, Trends and Pricing Analysis
Segments Covered
  • Product Type
  • Product Form
  • End Use
  • Region
Regions Covered
  • North America
  • Latin America
  • Western Europe
  • Eastern Europe
  • Asia Pacific
  • Japan
  • Middle East and Africa
Key Countries Profiled
  • USA
  • Canada
  • Brazil
  • Argentina
  • Germany
  • UK
  • France
  • Spain
  • Italy
  • Nordics
  • BENELUX
  • Australia & New Zealand
  • China
  • India
  • ASEAN
  • GCC
  • South Africa
Key Companies Profiled
  • Solvay SA
  • Toyobo Co., Ltd.
  • Mitsubishi Chemical holdings
  • The Ensinger Group
  • Merck KGaA
  • RI Chemical Corporation
  • Gabriel
  • MPD Industries Pvt. Limited.
  • Arizona Chemical
  • The Dow Chemical Company
  • AnqingHongyu Chemical Co. Ltd.
  • Jinan Tongfa Resin Co., Ltd.
  • RITEKS
  • Cytech Coatings Private Limited
  • Thomas Swan & Co. Ltd.
Customization Available Upon Request

Get the data you need at a Fraction of the cost

Personalize your report by choosing insights you need
and save 40%!

Key Segments Profiled in the Polyamide Resins Market Survey

By Product Type:

  • Dimer Acid–Based (DAB) Polyamide Resins
  • Polyamide-epichlorohydrin Resins)

By Product Form:

  • Pellets
  • Liquids

By End Use:

  • Inks
  • Paints & coating
  • Automotive
  • Chemical
  • Fiber and Textile
  • Electrical & Electronics
  • Others

By Region:

  • North America
  • Latin America
  • Western Europe
  • Eastern Europe
  • Asia Pacific
  • Japan
  • Middle East and Africa

Frequently Asked Questions

What is the Growth Outlook for the Polyamide Resins Market?

The global polyamide resins market is set to advance at a CAGR of 3.5% from 2022 to 2032.

Which Region is Likely to Hold a Major Polyamide Resins Market Share?

Europe is likely to hold a major polyamide resins market share during the forecast period.

Who are a Few Key Players in the Polyamide Resins Market?

Some of the key players in the global polyamide resins market are Solvay SA, Toyobo Co., Ltd., Mitsubishi Chemical holdings, The Ensinger Group, Merck KGaA, RI Chemical Corporation, Gabriel, MPD Industries Pvt. Limited.

Table of Content
1. Executive Summary

    1.1. Global Market Outlook

    1.2. Demand-side Trends

    1.3. Supply-side Trends

    1.4. Technology Roadmap Analysis

    1.5. Analysis and Recommendations

2. Market Overview

    2.1. Market Coverage / Taxonomy

    2.2. Market Definition / Scope / Limitations

3. Market Background

    3.1. Market Dynamics

        3.1.1. Drivers

        3.1.2. Restraints

        3.1.3. Opportunity 

        3.1.4. Trends

    3.2. Scenario Forecast

        3.2.1. Demand in Optimistic Scenario

        3.2.2. Demand in Likely Scenario

        3.2.3. Demand in Conservative Scenario

    3.3. Opportunity Map Analysis

    3.4. Product Life Cycle Analysis

    3.5. Supply Chain Analysis

        3.5.1. Supply Side Participants and their Roles

            3.5.1.1. Producers

            3.5.1.2. Mid-Level Participants (Traders/ Agents/ Brokers)

            3.5.1.3. Wholesalers and Distributors

        3.5.2. Value Added and Value Created at Node in the Supply Chain

        3.5.3. List of Raw Material Suppliers

        3.5.4. List of Existing and Potential Buyer’s

    3.6. Investment Feasibility Matrix

    3.7. Value Chain Analysis

        3.7.1. Profit Margin Analysis

        3.7.2. Wholesalers and Distributors

        3.7.3. Retailers

    3.8. PESTLE and Porter’s Analysis

    3.9. Regulatory Landscape

        3.9.1. By Key Regions

        3.9.2. By Key Countries

    3.10. Regional Parent Market Outlook

    3.11. Production and Consumption Statistics

    3.12. Import and Export Statistics

4. Global Polyamide Resins Market Analysis 2017-2021 and Forecast, 2022-2032

    4.1. Historical Market Size Value (US$ Mn) & Volume (Tons) Analysis, 2017-2021

    4.2. Current and Future Market Size Value (US$ Mn) & Volume (Tons) Projections, 2022-2032

        4.2.1. Y-o-Y Growth Trend Analysis

        4.2.2. Absolute $ Opportunity Analysis

5. Global Polyamide Resins Market Analysis 2017-2021 and Forecast 2022-2032, By Product Type

    5.1. Introduction / Key Findings

    5.2. Historical Market Size Value (US$ Mn) & Volume (Tons) Analysis By Product Type, 2017-2021

    5.3. Current and Future Market Size Value (US$ Mn) & Volume (Tons) Analysis and Forecast By Product Type, 2022-2032

        5.3.1. Dimer Acid–Based Polyamide Resins

        5.3.2. Polyamide-epichlorohydrin Resins

    5.4. Y-o-Y Growth Trend Analysis By Product Type, 2017-2021

    5.5. Absolute $ Opportunity Analysis By Product Type, 2022-2032

6. Global Polyamide Resins Market Analysis 2017-2021 and Forecast 2022-2032, By Product Forms

    6.1. Introduction / Key Findings

    6.2. Historical Market Size Value (US$ Mn) & Volume (Tons) Analysis By Product Forms, 2017-2021

    6.3. Current and Future Market Size Value (US$ Mn) & Volume (Tons) Analysis and Forecast By Product Forms, 2022-2032

        6.3.1. Pellets

        6.3.2. Liquids

    6.4. Y-o-Y Growth Trend Analysis By Product Forms, 2017-2021

    6.5. Absolute $ Opportunity Analysis By Product Forms, 2022-2032

7. Global Polyamide Resins Market Analysis 2017-2021 and Forecast 2022-2032, By End-use Industry

    7.1. Introduction / Key Findings

    7.2. Historical Market Size Value (US$ Mn) & Volume (Tons) Analysis By End-use Industry, 2017-2021

    7.3. Current and Future Market Size Value (US$ Mn) & Volume (Tons) Analysis and Forecast By End-use Industry, 2022-2032

        7.3.1. Inks, Paints & Coatings

        7.3.2. Automotive

        7.3.3. Chemical

        7.3.4. Fiber and Textile

        7.3.5. Electrical & Electronics

        7.3.6. Others

    7.4. Y-o-Y Growth Trend Analysis By End-use Industry, 2017-2021

    7.5. Absolute $ Opportunity Analysis By End-use Industry, 2022-2032

8. Global Polyamide Resins Market Analysis 2017-2021 and Forecast 2022-2032, By Region

    8.1. Introduction

    8.2. Historical Market Size Value (US$ Mn) & Volume (Tons) Analysis By Region, 2017-2021

    8.3. Current Market Size Value (US$ Mn) & Volume (Tons) Analysis and Forecast By Region, 2022-2032

        8.3.1. North America

        8.3.2. Latin America

        8.3.3. Europe

        8.3.4. East Asia

        8.3.5. South Asia & Pacific

        8.3.6. MEA

    8.4. Market Attractiveness Analysis By Region

9. North America Polyamide Resins Market Analysis 2017-2021 and Forecast 2022-2032, By Country

    9.1. Historical Market Size Value (US$ Mn) & Volume (Tons) Trend Analysis By Market Taxonomy, 2017-2021

    9.2. Market Size Value (US$ Mn) & Volume (Tons) Forecast By Market Taxonomy, 2022-2032

        9.2.1. By Country

            9.2.1.1. U.S.

            9.2.1.2. Canada

        9.2.2. By Product Type

        9.2.3. By Product Forms

        9.2.4. By End-use Industry

    9.3. Market Attractiveness Analysis

        9.3.1. By Country

        9.3.2. By Product Type

        9.3.3. By Product Forms

        9.3.4. By End-use Industry

    9.4. Key Takeaways

10. Latin America Polyamide Resins Market Analysis 2017-2021 and Forecast 2022-2032, By Country

    10.1. Historical Market Size Value (US$ Mn) & Volume (Tons) Trend Analysis By Market Taxonomy, 2017-2021

    10.2. Market Size Value (US$ Mn) & Volume (Tons) Forecast By Market Taxonomy, 2022-2032

        10.2.1. By Country

            10.2.1.1. Mexico

            10.2.1.2. Brazil

            10.2.1.3. Rest of Latin America

        10.2.2. By Product Type

        10.2.3. By Product Forms

        10.2.4. By End-use Industry

    10.3. Market Attractiveness Analysis

        10.3.1. By Country

        10.3.2. By Product Type

        10.3.3. By Product Forms

        10.3.4. By End-use Industry

    10.4. Key Takeaways

11. Europe Polyamide Resins Market Analysis 2017-2021 and Forecast 2022-2032, By Country

    11.1. Historical Market Size Value (US$ Mn) & Volume (Tons) Trend Analysis By Market Taxonomy, 2017-2021

    11.2. Market Size Value (US$ Mn) & Volume (Tons) Forecast By Market Taxonomy, 2022-2032

        11.2.1. By Country

            11.2.1.1. Germany

            11.2.1.2. Italy

            11.2.1.3. France

            11.2.1.4. U.K.

            11.2.1.5. Spain

            11.2.1.6. BENELUX

            11.2.1.7. Russia

            11.2.1.8. Rest of Europe

        11.2.2. By Product Type

        11.2.3. By Product Forms

        11.2.4. By End-use Industry

    11.3. Market Attractiveness Analysis

        11.3.1. By Country

        11.3.2. By Product Type

        11.3.3. By Product Forms

        11.3.4. By End-use Industry

    11.4. Key Takeaways

12. East Asia Polyamide Resins Market Analysis 2017-2021 and Forecast 2022-2032, By Country

    12.1. Historical Market Size Value (US$ Mn) & Volume (Tons) Trend Analysis By Market Taxonomy, 2017-2021

    12.2. Market Size Value (US$ Mn) & Volume (Tons) Forecast By Market Taxonomy, 2022-2032

        12.2.1. By Country

            12.2.1.1. China

            12.2.1.2. Japan

            12.2.1.3. South Korea

        12.2.2. By Product Type

        12.2.3. By Product Forms

        12.2.4. By End-use Industry

    12.3. Market Attractiveness Analysis

        12.3.1. By Country

        12.3.2. By Product Type

        12.3.3. By Product Forms

        12.3.4. By End-use Industry

    12.4. Key Takeaways

13. South Asia & Pacific Polyamide Resins Market Analysis 2017-2021 and Forecast 2022-2032, By Country

    13.1. Historical Market Size Value (US$ Mn) & Volume (Tons) Trend Analysis By Market Taxonomy, 2017-2021

    13.2. Market Size Value (US$ Mn) & Volume (Tons) Forecast By Market Taxonomy, 2022-2032

        13.2.1. By Country

            13.2.1.1. India

            13.2.1.2. ASEAN

            13.2.1.3. Australia and New Zealand

            13.2.1.4. Rest of South Asia & Pacific

        13.2.2. By Product Type

        13.2.3. By Product Forms

        13.2.4. By End-use Industry

    13.3. Market Attractiveness Analysis

        13.3.1. By Country

        13.3.2. By Product Type

        13.3.3. By Product Forms

        13.3.4. By End-use Industry

    13.4. Key Takeaways

14. MEA Polyamide Resins Market Analysis 2017-2021 and Forecast 2022-2032, By Country

    14.1. Historical Market Size Value (US$ Mn) & Volume (Tons) Trend Analysis By Market Taxonomy, 2017-2021

    14.2. Market Size Value (US$ Mn) & Volume (Tons) Forecast By Market Taxonomy, 2022-2032

        14.2.1. By Country

            14.2.1.1. GCC Countries

            14.2.1.2. Turkey

            14.2.1.3. South Africa

            14.2.1.4. Rest of MEA

        14.2.2. By Product Type

        14.2.3. By Product Forms

        14.2.4. By End-use Industry

    14.3. Market Attractiveness Analysis

        14.3.1. By Country

        14.3.2. By Product Type

        14.3.3. By Product Forms

        14.3.4. By End-use Industry

    14.4. Key Takeaways

15. Key Countries Polyamide Resins Market Analysis

    15.1. U.S.

        15.1.1. Pricing Analysis

        15.1.2. Market Share Analysis, 2021

            15.1.2.1. By Product Type

            15.1.2.2. By Product Forms

            15.1.2.3. By End-use Industry

    15.2. Canada

        15.2.1. Pricing Analysis

        15.2.2. Market Share Analysis, 2021

            15.2.2.1. By Product Type

            15.2.2.2. By Product Forms

            15.2.2.3. By End-use Industry

    15.3. Mexico

        15.3.1. Pricing Analysis

        15.3.2. Market Share Analysis, 2021

            15.3.2.1. By Product Type

            15.3.2.2. By Product Forms

            15.3.2.3. By End-use Industry

    15.4. Brazil

        15.4.1. Pricing Analysis

        15.4.2. Market Share Analysis, 2021

            15.4.2.1. By Product Type

            15.4.2.2. By Product Forms

            15.4.2.3. By End-use Industry

    15.5. Germany

        15.5.1. Pricing Analysis

        15.5.2. Market Share Analysis, 2021

            15.5.2.1. By Product Type

            15.5.2.2. By Product Forms

            15.5.2.3. By End-use Industry

    15.6. Italy

        15.6.1. Pricing Analysis

        15.6.2. Market Share Analysis, 2021

            15.6.2.1. By Product Type

            15.6.2.2. By Product Forms

            15.6.2.3. By End-use Industry

    15.7. France

        15.7.1. Pricing Analysis

        15.7.2. Market Share Analysis, 2021

            15.7.2.1. By Product Type

            15.7.2.2. By Product Forms

            15.7.2.3. By End-use Industry

    15.8. U.K.

        15.8.1. Pricing Analysis

        15.8.2. Market Share Analysis, 2021

            15.8.2.1. By Product Type

            15.8.2.2. By Product Forms

            15.8.2.3. By End-use Industry

    15.9. Spain

        15.9.1. Pricing Analysis

        15.9.2. Market Share Analysis, 2021

            15.9.2.1. By Product Type

            15.9.2.2. By Product Forms

            15.9.2.3. By End-use Industry

    15.10. BENELUX

        15.10.1. Pricing Analysis

        15.10.2. Market Share Analysis, 2021

            15.10.2.1. By Product Type

            15.10.2.2. By Product Forms

            15.10.2.3. By End-use Industry

    15.11. Russia

        15.11.1. Pricing Analysis

        15.11.2. Market Share Analysis, 2021

            15.11.2.1. By Product Type

            15.11.2.2. By Product Forms

            15.11.2.3. By End-use Industry

    15.12. China

        15.12.1. Pricing Analysis

        15.12.2. Market Share Analysis, 2021

            15.12.2.1. By Product Type

            15.12.2.2. By Product Forms

            15.12.2.3. By End-use Industry

    15.13. Japan

        15.13.1. Pricing Analysis

        15.13.2. Market Share Analysis, 2021

            15.13.2.1. By Product Type

            15.13.2.2. By Product Forms

            15.13.2.3. By End-use Industry

    15.14. South Korea

        15.14.1. Pricing Analysis

        15.14.2. Market Share Analysis, 2021

            15.14.2.1. By Product Type

            15.14.2.2. By Product Forms

            15.14.2.3. By End-use Industry

    15.15. India

        15.15.1. Pricing Analysis

        15.15.2. Market Share Analysis, 2021

            15.15.2.1. By Product Type

            15.15.2.2. By Product Forms

            15.15.2.3. By End-use Industry

    15.16. ASEAN

        15.16.1. Pricing Analysis

        15.16.2. Market Share Analysis, 2021

            15.16.2.1. By Product Type

            15.16.2.2. By Product Forms

            15.16.2.3. By End-use Industry

    15.17. Australia and New Zealand

        15.17.1. Pricing Analysis

        15.17.2. Market Share Analysis, 2021

            15.17.2.1. By Product Type

            15.17.2.2. By Product Forms

            15.17.2.3. By End-use Industry

    15.18. GCC Countries

        15.18.1. Pricing Analysis

        15.18.2. Market Share Analysis, 2021

            15.18.2.1. By Product Type

            15.18.2.2. By Product Forms

            15.18.2.3. By End-use Industry

    15.19. Turkey

        15.19.1. Pricing Analysis

        15.19.2. Market Share Analysis, 2021

            15.19.2.1. By Product Type

            15.19.2.2. By Product Forms

            15.19.2.3. By End-use Industry

    15.20. South Africa

        15.20.1. Pricing Analysis

        15.20.2. Market Share Analysis, 2021

            15.20.2.1. By Product Type

            15.20.2.2. By Product Forms

            15.20.2.3. By End-use Industry

16. Market Structure Analysis

    16.1. Competition Dashboard

    16.2. Competition Benchmarking

    16.3. Market Share Analysis of Top Players

        16.3.1. By Regional

        16.3.2. By Product Type

        16.3.3. By Product Forms

        16.3.4. By End-use Industry

17. Competition Analysis

    17.1. Competition Deep Dive

        17.1.1. Solvay SA

            17.1.1.1. Overview

            17.1.1.2. Product Portfolio

            17.1.1.3. Profitability by Market Segments

            17.1.1.4. Sales Footprint

            17.1.1.5. Strategy Overview

                17.1.1.5.1. Marketing Strategy

                17.1.1.5.2. Product Strategy

                17.1.1.5.3. Channel Strategy

        17.1.2. Toyobo Co., Ltd.

            17.1.2.1. Overview

            17.1.2.2. Product Portfolio

            17.1.2.3. Profitability by Market Segments

            17.1.2.4. Sales Footprint

            17.1.2.5. Strategy Overview

                17.1.2.5.1. Marketing Strategy

                17.1.2.5.2. Product Strategy

                17.1.2.5.3. Channel Strategy

        17.1.3. Mitsubishi Chemical holdings

            17.1.3.1. Overview

            17.1.3.2. Product Portfolio

            17.1.3.3. Profitability by Market Segments

            17.1.3.4. Sales Footprint

            17.1.3.5. Strategy Overview

                17.1.3.5.1. Marketing Strategy

                17.1.3.5.2. Product Strategy

                17.1.3.5.3. Channel Strategy

        17.1.4. The Ensinger Group

            17.1.4.1. Overview

            17.1.4.2. Product Portfolio

            17.1.4.3. Profitability by Market Segments

            17.1.4.4. Sales Footprint

            17.1.4.5. Strategy Overview

                17.1.4.5.1. Marketing Strategy

                17.1.4.5.2. Product Strategy

                17.1.4.5.3. Channel Strategy

        17.1.5. Merck KGaA

            17.1.5.1. Overview

            17.1.5.2. Product Portfolio

            17.1.5.3. Profitability by Market Segments

            17.1.5.4. Sales Footprint

            17.1.5.5. Strategy Overview

                17.1.5.5.1. Marketing Strategy

                17.1.5.5.2. Product Strategy

                17.1.5.5.3. Channel Strategy

        17.1.6. RI Chemical Corporation

            17.1.6.1. Overview

            17.1.6.2. Product Portfolio

            17.1.6.3. Profitability by Market Segments

            17.1.6.4. Sales Footprint

            17.1.6.5. Strategy Overview

                17.1.6.5.1. Marketing Strategy

                17.1.6.5.2. Product Strategy

                17.1.6.5.3. Channel Strategy

        17.1.7. Gabriel

            17.1.7.1. Overview

            17.1.7.2. Product Portfolio

            17.1.7.3. Profitability by Market Segments

            17.1.7.4. Sales Footprint

            17.1.7.5. Strategy Overview

                17.1.7.5.1. Marketing Strategy

                17.1.7.5.2. Product Strategy

                17.1.7.5.3. Channel Strategy

        17.1.8. MPD Industries Pvt. Limited

            17.1.8.1. Overview

            17.1.8.2. Product Portfolio

            17.1.8.3. Profitability by Market Segments

            17.1.8.4. Sales Footprint

            17.1.8.5. Strategy Overview

                17.1.8.5.1. Marketing Strategy

                17.1.8.5.2. Product Strategy

                17.1.8.5.3. Channel Strategy

        17.1.9. Arizona Chemical

            17.1.9.1. Overview

            17.1.9.2. Product Portfolio

            17.1.9.3. Profitability by Market Segments

            17.1.9.4. Sales Footprint

            17.1.9.5. Strategy Overview

                17.1.9.5.1. Marketing Strategy

                17.1.9.5.2. Product Strategy

                17.1.9.5.3. Channel Strategy

        17.1.10. The Dow Chemical Company

            17.1.10.1. Overview

            17.1.10.2. Product Portfolio

            17.1.10.3. Profitability by Market Segments

            17.1.10.4. Sales Footprint

            17.1.10.5. Strategy Overview

                17.1.10.5.1. Marketing Strategy

                17.1.10.5.2. Product Strategy

                17.1.10.5.3. Channel Strategy

        17.1.11. Jinan Tongfa Resin Co., Ltd.

            17.1.11.1. Overview

            17.1.11.2. Product Portfolio

            17.1.11.3. Profitability by Market Segments

            17.1.11.4. Sales Footprint

            17.1.11.5. Strategy Overview

                17.1.11.5.1. Marketing Strategy

                17.1.11.5.2. Product Strategy

                17.1.11.5.3. Channel Strategy

        17.1.12. RITEKS

            17.1.12.1. Overview

            17.1.12.2. Product Portfolio

            17.1.12.3. Profitability by Market Segments

            17.1.12.4. Sales Footprint

            17.1.12.5. Strategy Overview

                17.1.12.5.1. Marketing Strategy

                17.1.12.5.2. Product Strategy

                17.1.12.5.3. Channel Strategy

        17.1.13. Cytech Coatings Private Limited

            17.1.13.1. Overview

            17.1.13.2. Product Portfolio

            17.1.13.3. Profitability by Market Segments

            17.1.13.4. Sales Footprint

            17.1.13.5. Strategy Overview

                17.1.13.5.1. Marketing Strategy

                17.1.13.5.2. Product Strategy

                17.1.13.5.3. Channel Strategy

        17.1.14. Thomas Swan & Co. Ltd.

            17.1.14.1. Overview

            17.1.14.2. Product Portfolio

            17.1.14.3. Profitability by Market Segments

            17.1.14.4. Sales Footprint

            17.1.14.5. Strategy Overview

                17.1.14.5.1. Marketing Strategy

                17.1.14.5.2. Product Strategy

                17.1.14.5.3. Channel Strategy

18. Assumptions & Acronyms Used

19. Research Methodology
Recommendations

Chemicals & Materials

Dimer Acid-based (DAB) Polyamide Resin Market

February 2022

REP-GB-337

April 2024

333 pages

Chemicals & Materials

Nylon-6 Market

March 2018

REP-GB-1291

October 2022

300 pages

Explore Chemicals & Materials Insights

View Reports