Immunochromatography Kits Market Size and Share Forecast Outlook (2022 to 2032)

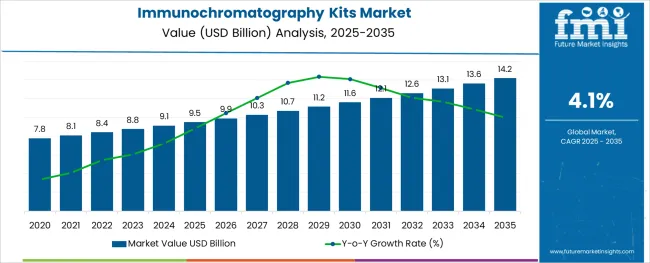
By the end of 2022, the global immunochromatography kits market is anticipated to be worth USD 8.1 Billion, and it will grow at a CAGR of 4.1% to reach an expected valuation of around USD 12.1 Billion by the year 2032.

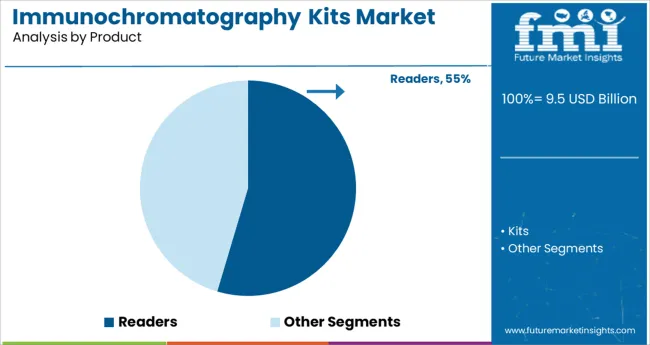
Kits dominate the worldwide market in 2021, as a product, with a share of around 72.7%, according to a recent analysis by Future Market Insights.

Market Outlook:

Data Points Market Insights
Market Value 2022 USD 8.1 Billion
Market Value 2032 USD 12.1 Billion
CAGR 2022 to 2032 4.1%
Market Share of Top 5 Countries 60.7%
Key Market Players Abbott Laboratories, PerkinElmer Inc., Danaher Corporation, Bio-rad Laboratories, F. Hoffmann-La Roche AG, bioMérieux SA, Becton, Dickinson and Company, Siemens Healthineers AG, Thermo Fisher Scientific Inc., and QIAGEN

The lateral flow test or immunochromatography assay is a simple method for determining if the target analyte is present or missing. The immunochromatography test is the most often utilized test in diagnostic laboratories around the world for rapid patient diagnosis and treatment.

The goal of immunochromatography kits is to identify whether a target analyte (such as an antigen or an antibody) is present or missing in a sample in a timely and cost-effective manner.

Comparison of Sales (2012 to 2021) vs Forecast to 2032

The market value for immunochromatography kits was approximately 22.9% of the overall ~USD 33.7 Billion of the global immunoassay market in 2021.

The sale of immunochromatography kits expanded at a CAGR of 4.2% from 2012 to 2021.

Immunochromatography kits are unquestionably one of the most effective analytical tools for on-site target identification. Immunochromatography, which is analogous to a lab-in-a-hand, along with other point-of-need diagnostics, has marked a paradigm change from lab-to-lab to lab-to-sample intended to enable faster decision-making and turnaround time. Immunochromatography kits have a number of characteristics that make them a desirable resource for clinical diagnostics, where they can enhance patient care by facilitating faster treatment and diagnosis decisions.

Widespread acceptance of immunochromatography kits is a result of their efficiency, simplicity, relative affordability, and ability to be used by unskilled individuals. Public health continues to be seriously endangered by hepatitis B. According to the World Health Organization's bulletin from 2018, it is estimated that more than 257 million individuals worldwide have chronic hepatitis B infection and that about 9 million have died from liver failure, hepatocellular carcinoma, liver cirrhosis, and other diseases linked to HBV.

The most widely used serological marker for the screening, diagnosis and evaluation of antiviral therapy for hepatitis B is hepatitis B surface antigen (HBsAg), which is the envelope protein of HBV. Due to their numerous benefits, such as ease of use, low cost, and quick turnaround time, immunochromatography kits have been extensively used in HBV screenings, including self-examinations, medical checks, donating blood, and emergency, and epidemiologic surveys.

The prevalence of cancer is gradually rising, which is anticipated to increase the need for efficient diagnostic tools like immunoassay. This method is important for determining oncogenesis and diagnosing cancer in all of its forms, including benign and malignant cancer.

Globally, the use of immunoassay-based diagnostics is steadily rising. The control of the epidemic disease is greatly aided by public awareness initiatives that educate the public about the signs of infectious diseases and how to prevent them. As a result, there is a significant demand for immunochromatography kits due to greater patient awareness.

Because of the aforementioned factors, it is anticipated that from 2022 to 2032, the global immunochromatography kits market will expand at a CAGR of 4.1%.

Key Opportunities in the Immunochromatography Kits Market

Since there are more infectious pathogens causing dangerous diseases globally, the development and implementation of rapid diagnostic technologies are urgently needed. Early interventions can make a significant difference in the severity of any disease epidemic by reducing the number of cases.

In recent years, researchers have thought about using more difficult and expensive immunoassay techniques, such as radioimmunoassay and ELISA, in place of the construction of quick, precise, and sensitive approaches.

The majority of these approaches rely on agglutination, immunochromatography (ICG), and several molecular methods. In hospitals, clinics, doctor's offices, and clinical labs, ICG tests are utilized for the qualitative and quantitative detection of a wide range of antigens and antibodies. Additional diagnostic alternatives for parasitic diseases are offered by the novel immunochromatography technology, which may be examined and contrasted with existing conventional diagnostic approaches.

For the diagnosis of parasitic infections such as intestinal parasite protozoa, leishmaniasis, filariasis, trypanosomiasis, trichomoniasis, toxoplasmosis, and others, a number of ICTs have been developed. A number of immunochromatography kits based primarily on the detection of several parasite antigens (and antibodies in certain tests) have recently been developed for the diagnosis of parasitic infections, and the findings are encouraging. Researchers for the identification of various parasite infections have recently evaluated Immunochromatography kits.

Although immunochromatography kits have been around for a while and can be used in the field, there is currently no conclusive data on how well they perform in addressing specific diseases. In terms of performance, scientists concur that immunochromatography kits are a potential tool for diagnosing parasite infections and are reasonably reliable in differentiating between positive and negative people.

Immunochromatography kits are thus a potentially valuable supplement to existing diagnostic tools for parasitic illnesses, providing manufacturers with lucrative opportunities for expansion in the global market during the forecast period.

Factors Limiting the Growth of Immunochromatography Kits

Despite being widely used as the gold standard approach, the use of immunochromatography kits has certain drawbacks.

False-negative results can happen as a result of poor specimen quality, such as when the sample is taken at an inopportune time relative to the onset of the illness, or owing to improper specimen handling or shipping to the laboratory department. False positive results might also be the result of contamination or technical aspects.

Since the detection of an immune response to the virus is an indirect indicator of infection, unlike molecular testing, the development of reliable serological tests and their proper application are crucial to support ongoing public health efforts for effective epidemic prevention.

In order to achieve a quantitative improvement using immunochromatography, additional detecting equipment is needed. The immunoassay method also has a lot of disadvantages when used as an easy and affordable sensing method for domestic or personal use.

Additionally, because it is a one-step assay, the total volume in the test is limited, putting a cap on the sensitivity. Moreover, the analysis is reliant on the characteristics of the sample, including sample viscosity. These are some of the factors restraining the market for immunochromatography kits' adoption globally.
Analysis of Top Countries Producing, Formulating, Distributing, and Utilizing Immunochromatography Kits

What Makes the USA a Large Market for Immunochromatography Kits?

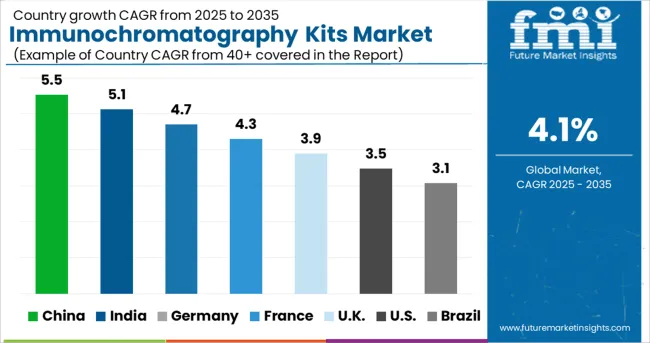
With a market share of 82.8% in all of North America in 2021, the USA presently dominates the region and is expected to sustain this growth throughout the forecast period.

This can be attributable to two factors: the simple accessibility of technologically enhanced diagnostic tools, as well as the increased demand for diagnostics brought on by the rise in cancer incidence. The high prevalence of infectious diseases including HIV, TB, and influenza in the region is also driving up the demand for treatment and diagnostic services.

What Makes China a Highly Lucrative Market for Immunochromatography Kits?

China represents roughly 60.1% of the East Asia market in 2021, with growth at a lucrative CAGR of 4.8% throughout the forecast period. The growing aging population within the country, as well as the wide prevalence of chronic and infectious diseases, presents this growth. Moreover, with the rapidly enhancing healthcare structure in the country, the market for immunochromatography kits is set to advance at a high rate over the forecasted years.

Moreover, with the advent of the COVID-19 pandemic, the country presented a greater adoption of immunochromatography kits for the rapid detection of the SARS COV-2 antigen, for the effective management of infection and its prevention.

What is the Outlook of Germany in the Immunochromatography Kits Market?

During the forecast years, Germany is projected to grow at a CAGR of nearly 3.7% in the global immunochromatography kits market. Germany holds the presence of established key players within the global immunochromatography space. Key players like Qiagen have posed a dominant hand in the distribution and development of novel point-of-need diagnosis, thus presenting Germany with a larger market share of around 24.9% within the European market, in 2021.

Moreover, growing awareness of infection prevention, as well as the presence of reimbursement for treatment, has aided Germany with lucrative growth opportunities during the forecast period.

Immunochromatography Kits Industry Analysis by Top Investment Segments

Which Product is Widely Adopted within the Global Immunochromatography Kits Market?

Kits are expected to present high growth at a CAGR of 4.2% throughout the forecast period. The benefits of immunochromatography kits include a small sample amount, portable devices, and the absence of the requirement for huge and expensive equipment. Immunochromatography kit technology and design today substantially dismiss previous concerns about their specificity, accuracy, and reproducibility.

Which Application of Immunochromatography Kits is Widely Taken over Globally?

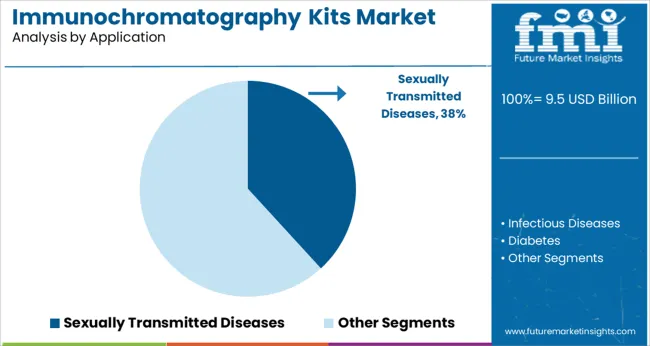
The application of immunochromatography kits for the detection of infectious diseases holds a share of around 34.5% in 2021, and this segment is expected to display gradual growth over the forecast period. Immunochromatography assays (ICA), which detect antibodies against pathogens, have been routinely utilized to diagnose a variety of infectious diseases. Rapid direct tests (viral protein screening) have an advantage over indirect ELISA tests (serology) in the case of immunocompromised patients since these patients do not have antibody levels that are high enough to be identified, thus propelling demand for immunochromatography kits for infectious disease detection.

How are Hospital Pharmacies a Major Distribution Channel for Immunochromatography Kits?

Hospital pharmacies held the highest market share value of 36.5% during the year 2021. Being the prime source for the distribution of immunochromatography kits, this segment is expected to expand at a CAGR of 4.0% during the forecast period. Moreover, point-of-care tests are highly useful for repeat follow-up tests to check treatment progress or for continuous monitoring of a specific analyte. Point-of-care testing substantially shortens the turnaround time, which is crucial and very helpful in addressing serious conditions like heart disease.
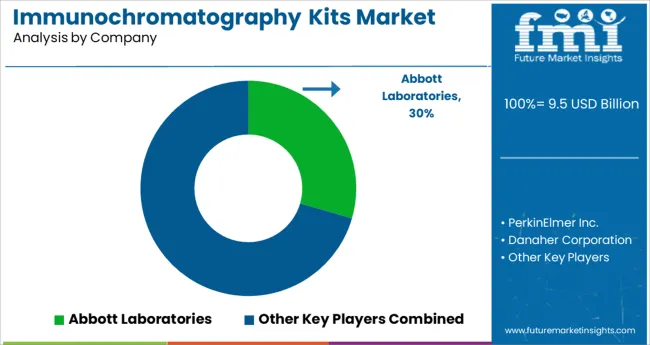
Leading Suppliers of Immunochromatography Kits

To increase their market position, major competitors in the immunochromatography kits market are using a variety of organic and inorganic methods, including alliances, mergers, and acquisitions, geographic growth, and strategic collaborations.

  • For instance, Quidel Corporation and Ortho Clinical Diagnostics entered into an acquisition agreement in December 2021. The company's growth is anticipated to be positively impacted by the purchase by expanding its diagnostics offering.
  • In January 2021, Abbott received a CE mark for their Panbio rapid antigen test, allowing it to be used for asymptomatic screening and self-administered sample collection via a nose swab.

Similarly, recent developments related to companies manufacturing immunochromatography kits have been tracked by the team at Future Market Insights, which are available in the full report.

Top Segments Studied in the Immunochromatography Kits Market Research Report

Attribute Details
Forecast Period 2022 to 2032
Historical Data Available for 2012 to 2021
Market Analysis USD Million for Value
Key Regions Covered North America, Latin America, Europe, South Asia, East Asia, Oceania, and Middle East & Africa
Key Countries Covered USA, Canada, Brazil, Mexico, Argentina, UK, Germany, Italy, Russia, Spain, France, BENELUX, India, Thailand, Indonesia, Malaysia, Japan, China, South Korea, Australia, New Zealand, Turkey, GCC Countries, North Africa, and South Africa
Key Market Segments Covered Product, Application, Usage, Distribution Channel, and Region
Key Companies Profiled Abbott Laboratories; PerkinElmer Inc.; Danaher Corporation; Bio-rad Laboratories; F. Hoffmann-La Roche AG; bioMérieux SA; Becton, Dickinson, and Company; Siemens Healthineers AG; Thermo Fisher Scientific Inc.; QIAGEN
Pricing Available upon Request

Key Market Segments Covered in Immunochromatography Kits Industry Research

By Product:

  • Readers
  • Kits

By Application:

  • Sexually Transmitted Diseases
  • Infectious Diseases
  • Diabetes
  • Pregnancy Testing
  • Drug Abuse Testing
  • Others

By Distribution Channel:

  • Hospital Pharmacies
  • Retail Pharmacies
  • Supermarket/Hypermarket
  • E-Commerce

By Region:

  • North America
  • Latin America
  • Europe
  • South Asia
  • East Asia
  • Oceania
  • Middle East and Africa (MEA)

Table of Content

  • 1. Executive Summary 
  • 2. Market Overview
  • 3. Key Market Trends
  • 4. Key Success Factors
  • 5. Market Background
  • 6. COVID-19 Crisis Analysis
  • 7. Global Market Volume (Units) Analysis 2012 to 2021 and Forecast, 2022 to 2032
  • 8. Global Market - Pricing Analysis
  • 9. Global Market Demand (in Value or Size in USD Million) Analysis 2012 to 2021 and Forecast, 2022 to 2032
  • 10. Global Market Analysis By Product
    • 10.1. Readers
    • 10.2. Kits
  • 11. Global Market Analysis By Application
    • 11.1. Sexually Transmitted Diseases
    • 11.2. Infectious Diseases
    • 11.3. Diabetes
    • 11.4. Pregnancy Testing
    • 11.5. Drug Abuse Testing
    • 11.6. Others
  • 12. Global Market Analysis By Distribution Channel
    • 12.1. Hospital Pharmacies
    • 12.2. Retail Pharmacies
    • 12.3. Supermarket/Hypermarket
    • 12.4. E-Commerce
  • 13. Global Market Analysis By Region
    • 13.1. North America
    • 13.2. Latin America
    • 13.3. Europe
    • 13.4. East Asia
    • 13.5. South Asia
    • 13.6. Oceania
    • 13.7. Middle East and Africa (MEA)
  • 14. North America Market Analysis
  • 15. Latin America Market Analysis
  • 16. Europe Market Analysis
  • 17. East Asia Market Analysis
  • 18. South Asia Market Analysis
  • 19. Oceania Market Analysis
  • 20. Middle East and Africa (MEA) Market Analysis
  • 21. Market Structure Analysis
  • 22. Competition Analysis
    • 22.1. Abbott Laboratories
    • 22.2. PerkinElmer Inc.
    • 22.3. Danaher Corporation
    • 22.4. Bio-Rad Laboratories
    • 22.5. F. Hoffmann-La Roche AG
    • 22.6. BioMérieux SA
    • 22.7. Becton, Dickinson, and Company
    • 22.8. Siemens Healthineers AG
    • 22.9. Thermo Fisher Scientific Inc.
    • 22.10. QIAGEN
  • 23. Assumptions and Acronyms Used
  • 24. Research Methodology

List of Tables

Table 01: Global Market Value (US$ Million) Analysis and Forecast 2012 to 2032, by Product

Table 02: Global Market Volume (Units) Analysis and Forecast 2012 to 2032, by Product

Table 03: Global Market Value (US$ Million) Analysis and Forecast 2012 to 2032, by Application

Table 04: Global Market Value (US$ Million) Analysis and Forecast 2012 to 2032, by Distribution Channel

Table 05: Global Market Value (US$ Million) Analysis and Forecast 2012 to 2032, by Region

Table 06: North America Market Value (US$ Million) Analysis 2012 to 2021 and Forecast 2022 to 2032, by Country

Table 07: North America Market Value (US$ Million) Analysis and Forecast 2012 to 2032, by Product

Table 08: North America Market Volume (Units) Analysis and Forecast 2012 to 2032, by Product

Table 09: North America Market Value (US$ Million) Analysis and Forecast 2012 to 2032, by Application

Table 10: North America Market Value (US$ Million) Analysis and Forecast 2012 to 2032, by Distribution Channel

Table 11: Latin America Market Value (US$ Million) Analysis 2012 to 2021 and Forecast 2022 to 2032, by Country

Table 12: Latin America Market Value (US$ Million) Analysis and Forecast 2012 to 2032, by Product

Table 13: Latin America Market Volume (Units) Analysis and Forecast 2012 to 2032, by Product

Table 14: Latin America Market Value (US$ Million) Analysis and Forecast 2012 to 2032, by Application

Table 15: Latin America Market Value (US$ Million) Analysis and Forecast 2012 to 2032, by Distribution Channel

Table 16: Europe Market Value (US$ Million) Analysis 2012 to 2021 and Forecast 2022 to 2032, by Country

Table 17: Europe Market Value (US$ Million) Analysis and Forecast 2012 to 2032, by Product

Table 18: Europe Market Volume (Units) Analysis and Forecast 2012 to 2032, by Product

Table 19: Europe Market Value (US$ Million) Analysis and Forecast 2012 to 2032, by Application

Table 20: Europe Market Value (US$ Million) Analysis and Forecast 2012 to 2032, by Distribution Channel

Table 21: South Asia Market Value (US$ Million) Analysis 2012 to 2021 and Forecast 2022 to 2032, by Country

Table 22: South Asia Market Value (US$ Million) Analysis and Forecast 2012 to 2032, by Product

Table 23: South Asia Market Volume (Units) Analysis and Forecast 2012 to 2032, by Product

Table 24: South Asia Market Value (US$ Million) Analysis and Forecast 2012 to 2032, by Application

Table 25: South Asia Market Value (US$ Million) Analysis and Forecast 2012 to 2032, by Distribution Channel

Table 26: East Asia Market Value (US$ Million) Analysis 2012 to 2021 and Forecast 2022 to 2032, by Country

Table 27: East Asia Market Value (US$ Million) Analysis and Forecast 2012 to 2032, by Product

Table 28: East Asia Market Volume (Units) Analysis and Forecast 2012 to 2032, by Product

Table 29: East Asia Market Value (US$ Million) Analysis and Forecast 2012 to 2032, by Application

Table 30: East Asia Market Value (US$ Million) Analysis and Forecast 2012 to 2032, by Distribution Channel

Table 31: Oceania Market Value (US$ Million) Analysis 2012 to 2021 and Forecast 2022 to 2032, by Country

Table 32: Oceania Market Value (US$ Million) Analysis and Forecast 2012 to 2032, by Product

Table 33: Oceania Market Volume (Units) Analysis and Forecast 2012 to 2032, by Product

Table 34: Oceania Market Value (US$ Million) Analysis and Forecast 2012 to 2032, by Application

Table 35: Oceania Market Value (US$ Million) Analysis and Forecast 2012 to 2032, by Distribution Channel

Table 36: MEA Market Value (US$ Million) Analysis 2012 to 2021 and Forecast 2022 to 2032, by Country

Table 37: MEA Market Value (US$ Million) Analysis and Forecast 2012 to 2032, by Product

Table 38: MEA Market Volume (Units) Analysis and Forecast 2012 to 2032, by Product

Table 39: MEA Market Value (US$ Million) Analysis and Forecast 2012 to 2032, by Application

Table 40: MEA Market Value (US$ Million) Analysis and Forecast 2012 to 2032, by Distribution Channel

List of Figures

Figure 01: Global Market Volume (Units), 2012 to 2021

Figure 02: Global Market Volume (Units) & Y-o-Y Growth (%) Analysis, 2022 to 2032

Figure 03: Immunochromatography Kits, Pricing Analysis per unit (US$), in 2022

Figure 04: Immunochromatography Kits, Pricing Forecast per unit (US$), in 2032

Figure 05: Global Market Value (US$ Mn) Analysis, 2012 to 2021

Figure 06: Global Market Forecast & Y-o-Y Growth, 2022 to 2032

Figure 07: Global Market Absolute $ Opportunity (US$ Mn) Analysis, 2021 to 2032

Figure 08: Global Market Value Share (%) Analysis 2022 and 2032, by Product

Figure 09: Global Market Y-o-Y Growth (%) Analysis 2021-2032, by Product

Figure 10: Global Market Attractiveness Analysis 2022 to 2032, by Product

Figure 11: Global Market Value Share (%) Analysis 2022 and 2032, by Application

Figure 12: Global Market Y-o-Y Growth (%) Analysis 2021-2032, by Application

Figure 13: Global Market Attractiveness Analysis 2022 to 2032, by Application

Figure 14: Global Market Value Share (%) Analysis 2022 and 2032, by Distribution Channel

Figure 15: Global Market Y-o-Y Growth (%) Analysis 2021-2032, by Distribution Channel

Figure 16: Global Market Attractiveness Analysis 2022 to 2032, by Distribution Channel

Figure 17: Global Market Value Share (%) Analysis 2022 and 2032, by Region

Figure 18: Global Market Y-o-Y Growth (%) Analysis 2021-2032, by Region

Figure 19: Global Market Attractiveness Analysis 2022 to 2032, by Region

Figure 20: North America Market Value (US$ Mn) Analysis, 2012 to 2021

Figure 21: North America Market Value (US$ Mn) Forecast, 2022 to 2032

Figure 22: North America Market Value Share, by Product (2022 E)

Figure 23: North America Market Value Share, by Application (2022 E)

Figure 24: North America Market Value Share, by Distribution Channel (2022 E)

Figure 25: North America Market Value Share, by Country (2022 E)

Figure 26: North America Market Attractiveness Analysis by Product, 2022 to 2032

Figure 27: North America Market Attractiveness Analysis by Application, 2022 to 2032

Figure 28: North America Market Attractiveness Analysis by Distribution Channel, 2022 to 2032

Figure 29: North America Market Attractiveness Analysis by Country, 2022 to 2032

Figure 30: U.S. Market Value Proportion Analysis, 2021

Figure 31: Global Vs. The US Growth Comparison

Figure 32: The US Market Share Analysis (%) by Product, 2021 to 2032

Figure 33: The US Market Share Analysis (%) by Application, 2021 to 2032

Figure 34: The US Market Share Analysis (%) by Distribution Channel, 2021 to 2032

Figure 35: Canada Market Value Proportion Analysis, 2021

Figure 36: Global Vs. Canada. Growth Comparison

Figure 37: Canada Market Share Analysis (%) by Product, 2021 to 2032

Figure 38: Canada Market Share Analysis (%) by Application, 2021 to 2032

Figure 39: Canada Market Share Analysis (%) by Distribution Channel, 2021 to 2032

Figure 40: Latin America Market Value (US$ Mn) Analysis, 2012 to 2021

Figure 41: Latin America Market Value (US$ Mn) Forecast, 2022 to 2032

Figure 42: Latin America Market Value Share, by Product (2022 E)

Figure 43: Latin America Market Value Share, by Application (2022 E)

Figure 44: Latin America Market Value Share, by Distribution Channel (2022 E)

Figure 45: Latin America Market Value Share, by Country (2022 E)

Figure 46: Latin America Market Attractiveness Analysis by Product, 2022 to 2032

Figure 47: Latin America Market Attractiveness Analysis by Application, 2022 to 2032

Figure 48: Latin America Market Attractiveness Analysis by Distribution Channel, 2022 to 2032

Figure 49: Latin America Market Attractiveness Analysis by Country, 2022 to 2032

Figure 50: Mexico Market Value Proportion Analysis, 2021

Figure 51: Global Vs Mexico Growth Comparison

Figure 52: Mexico Market Share Analysis (%) by Product, 2021 to 2032

Figure 53: Mexico Market Share Analysis (%) by Application, 2021 to 2032

Figure 54: Mexico Market Share Analysis (%) by Distribution Channel, 2021 to 2032

Figure 55: Brazil Market Value Proportion Analysis, 2021

Figure 56: Global Vs. Brazil. Growth Comparison

Figure 57: Brazil Market Share Analysis (%) by Product, 2021 to 2032

Figure 58: Brazil Market Share Analysis (%) by Application, 2021 to 2032

Figure 59: Brazil Market Share Analysis (%) by Distribution Channel, 2021 to 2032

Figure 60: Argentina Market Value Proportion Analysis, 2021

Figure 61: Global Vs Argentina Growth Comparison

Figure 62: Argentina Market Share Analysis (%) by Product, 2021 to 2032

Figure 63: Argentina Market Share Analysis (%) by Application, 2021 to 2032

Figure 64: Argentina Market Share Analysis (%) by Distribution Channel, 2021 to 2032

Figure 65: Europe Market Value (US$ Mn) Analysis, 2012 to 2021

Figure 66: Europe Market Value (US$ Mn) Forecast, 2022 to 2032

Figure 67: Europe Market Value Share, by Product (2022 E)

Figure 68: Europe Market Value Share, by Application (2022 E)

Figure 69: Europe Market Value Share, by Distribution Channel (2022 E)

Figure 70: Europe Market Value Share, by Country (2022 E)

Figure 71: Europe Market Attractiveness Analysis by Product, 2022 to 2032

Figure 72: Europe Market Attractiveness Analysis by Application, 2022 to 2032

Figure 73: Europe Market Attractiveness Analysis by Distribution Channel, 2022 to 2032

Figure 74: Europe Market Attractiveness Analysis by Country, 2022 to 2032

Figure 75: UK Market Value Proportion Analysis, 2021

Figure 76: Global Vs. UK Growth Comparison

Figure 77: UK Market Share Analysis (%) by Product, 2021 to 2032

Figure 78: UK Market Share Analysis (%) by Application, 2021 to 2032

Figure 79: UK Market Share Analysis (%) by Distribution Channel, 2021 to 2032

Figure 80: Germany Market Value Proportion Analysis, 2021

Figure 81: Global Vs. Germany Growth Comparison

Figure 82: Germany Market Share Analysis (%) by Product, 2021 to 2032

Figure 83: Germany Market Share Analysis (%) by Application, 2021 to 2032

Figure 84: Germany Market Share Analysis (%) by Distribution Channel, 2021 to 2032

Figure 85: Italy Market Value Proportion Analysis, 2021

Figure 86: Global Vs. Italy Growth Comparison

Figure 87: Italy Market Share Analysis (%) by Product, 2021 to 2032

Figure 88: Italy Market Share Analysis (%) by Application, 2021 to 2032

Figure 89: Italy Market Share Analysis (%) by Distribution Channel, 2021 to 2032

Figure 90: France Market Value Proportion Analysis, 2021

Figure 91: Global Vs France Growth Comparison

Figure 92: France Market Share Analysis (%) by Product, 2021 to 2032

Figure 93: France Market Share Analysis (%) by Application, 2021 to 2032

Figure 94: France Market Share Analysis (%) by Distribution Channel, 2021 to 2032

Figure 95: Spain Market Value Proportion Analysis, 2021

Figure 96: Global Vs Spain Growth Comparison

Figure 97: Spain Market Share Analysis (%) by Product, 2021 to 2032

Figure 98: Spain Market Share Analysis (%) by Application, 2021 to 2032

Figure 99: Spain Market Share Analysis (%) by Distribution Channel, 2021 to 2032

Figure 100: Russia Market Value Proportion Analysis, 2021

Figure 101: Global Vs Russia Growth Comparison

Figure 102: Russia Market Share Analysis (%) by Product, 2021 to 2032

Figure 103: Russia Market Share Analysis (%) by Application, 2021 to 2032

Figure 104: Russia Market Share Analysis (%) by Distribution Channel, 2021 to 2032

Figure 105: BENELUX Market Value Proportion Analysis, 2021

Figure 106: Global Vs BENELUX Growth Comparison

Figure 107: BENELUX Market Share Analysis (%) by Product, 2021 to 2032

Figure 108: BENELUX Market Share Analysis (%) by Application, 2021 to 2032

Figure 109: BENELUX Market Share Analysis (%) by Distribution Channel, 2021 to 2032

Figure 110: East Asia Market Value (US$ Mn) Analysis, 2012 to 2021

Figure 111: East Asia Market Value (US$ Mn) Forecast, 2022 to 2032

Figure 112: East Asia Market Value Share, by Product (2022 E)

Figure 113: East Asia Market Value Share, by Application (2022 E)

Figure 114: East Asia Market Value Share, by Distribution Channel (2022 E)

Figure 115: East Asia Market Value Share, by Country (2022 E)

Figure 116: East Asia Market Attractiveness Analysis by Product, 2022 to 2032

Figure 117: East Asia Market Attractiveness Analysis by Application, 2022 to 2032

Figure 118: East Asia Market Attractiveness Analysis by Distribution Channel, 2022 to 2032

Figure 119: East Asia Market Attractiveness Analysis by Country, 2022 to 2032

Figure 120: China Market Value Proportion Analysis, 2021

Figure 121: Global Vs. China Growth Comparison

Figure 122: China Market Share Analysis (%) by Product, 2021 to 2032

Figure 123: China Market Share Analysis (%) by Application, 2021 to 2032

Figure 124: China Market Share Analysis (%) by Distribution Channel, 2021 to 2032

Figure 125: Japan Market Value Proportion Analysis, 2021

Figure 126: Global Vs. Japan Growth Comparison

Figure 127: Japan Market Share Analysis (%) by Product, 2021 to 2032

Figure 128: Japan Market Share Analysis (%) by Application, 2021 to 2032

Figure 129: Japan Market Share Analysis (%) by Distribution Channel, 2021 to 2032

Figure 130: South Korea Market Value Proportion Analysis, 2021

Figure 131: Global Vs South Korea Growth Comparison

Figure 132: South Korea Market Share Analysis (%) by Product, 2021 to 2032

Figure 133: South Korea Market Share Analysis (%) by Application, 2021 to 2032

Figure 134: South Korea Market Share Analysis (%) by Distribution Channel, 2021 to 2032

Figure 135: South Asia Market Value (US$ Mn) Analysis, 2012 to 2021

Figure 136: South Asia Market Value (US$ Mn) Forecast, 2022 to 2032

Figure 137: South Asia Market Value Share, by Product (2022 E)

Figure 138: South Asia Market Value Share, by Application (2022 E)

Figure 139: South Asia Market Value Share, by Distribution Channel (2022 E)

Figure 140: South Asia Market Value Share, by Country (2022 E)

Figure 141: South Asia Market Attractiveness Analysis by Product, 2022 to 2032

Figure 142: South Asia Market Attractiveness Analysis by Application, 2022 to 2032

Figure 143: South Asia Market Attractiveness Analysis by Distribution Channel, 2022 to 2032

Figure 144: South Asia Market Attractiveness Analysis by Country, 2022 to 2032

Figure 145: India Market Value Proportion Analysis, 2021

Figure 146: Global Vs. India Growth Comparison

Figure 147: India Market Share Analysis (%) by Product, 2021 to 2032

Figure 148: India Market Share Analysis (%) by Application, 2021 to 2032

Figure 149: India Market Share Analysis (%) by Distribution Channel, 2021 to 2032

Figure 150: Indonesia Market Value Proportion Analysis, 2021

Figure 151: Global Vs. Indonesia Growth Comparison

Figure 152: Indonesia Market Share Analysis (%) by Product, 2021 to 2032

Figure 153: Indonesia Market Share Analysis (%) by Application, 2021 to 2032

Figure 154: Indonesia Market Share Analysis (%) by Distribution Channel, 2021 to 2032

Figure 155: Malaysia Market Value Proportion Analysis, 2021

Figure 156: Global Vs. Malaysia Growth Comparison

Figure 157: Malaysia Market Share Analysis (%) by Product, 2021 to 2032

Figure 158: Malaysia Market Share Analysis (%) by Application, 2021 to 2032

Figure 159: Malaysia Market Share Analysis (%) by Distribution Channel, 2021 to 2032

Figure 160: Thailand Market Value Proportion Analysis, 2021

Figure 161: Global Vs. Thailand Growth Comparison

Figure 162: Thailand Market Share Analysis (%) by Product, 2021 to 2032

Figure 163: Thailand Market Share Analysis (%) by Application, 2021 to 2032

Figure 164: Thailand Market Share Analysis (%) by Distribution Channel, 2021 to 2032

Figure 165: Oceania Market Value (US$ Mn) Analysis, 2012 to 2021

Figure 166: Oceania Market Value (US$ Mn) Forecast, 2022 to 2032

Figure 167: Oceania Market Value Share, by Product (2022 E)

Figure 168: Oceania Market Value Share, by Application (2022 E)

Figure 169: Oceania Market Value Share, by Distribution Channel (2022 E)

Figure 170: Oceania Market Value Share, by Country (2022 E)

Figure 171: Oceania Market Attractiveness Analysis by Product, 2022 to 2032

Figure 172: Oceania Market Attractiveness Analysis by Application, 2022 to 2032

Figure 173: Oceania Market Attractiveness Analysis by Distribution Channel, 2022 to 2032

Figure 174: Oceania Market Attractiveness Analysis by Country, 2022 to 2032

Figure 175: Australia Market Value Proportion Analysis, 2021

Figure 176: Global Vs. Australia Growth Comparison

Figure 177: Australia Market Share Analysis (%) by Product, 2021 to 2032

Figure 178: Australia Market Share Analysis (%) by Application, 2021 to 2032

Figure 179: Australia Market Share Analysis (%) by Distribution Channel, 2021 to 2032

Figure 180: New Zealand Market Value Proportion Analysis, 2021

Figure 181: Global Vs New Zealand Growth Comparison

Figure 182: New Zealand Market Share Analysis (%) by Product, 2021 to 2032

Figure 183: New Zealand Market Share Analysis (%) by Application, 2021 to 2032

Figure 184: New Zealand Market Share Analysis (%) by Distribution Channel, 2021 to 2032

Figure 185: Middle East & Africa Market Value (US$ Mn) Analysis, 2012 to 2021

Figure 186: Middle East & Africa Market Value (US$ Mn) Forecast, 2022 to 2032

Figure 187: Middle East & Africa Market Value Share, by Product (2022 E)

Figure 188: Middle East & Africa Market Value Share, by Application (2022 E)

Figure 189: Middle East & Africa Market Value Share, by Distribution Channel (2022 E)

Figure 190: Middle East & Africa Market Value Share, by Country (2022 E)

Figure 191: Middle East & Africa Market Attractiveness Analysis by Product, 2022 to 2032

Figure 192: Middle East & Africa Market Attractiveness Analysis by Application, 2022 to 2032

Figure 193: Middle East & Africa Market Attractiveness Analysis by Distribution Channel, 2022 to 2032

Figure 194: Middle East & Africa Market Attractiveness Analysis by Country, 2022 to 2032

Figure 195: GCC Countries Market Value Proportion Analysis, 2021

Figure 196: Global Vs GCC Countries Growth Comparison

Figure 197: GCC Countries Market Share Analysis (%) by Product, 2021 to 2032

Figure 198: GCC Countries Market Share Analysis (%) by Application, 2021 to 2032

Figure 199: GCC Countries Market Share Analysis (%) by Distribution Channel, 2021 to 2032

Figure 200: Turkey Market Value Proportion Analysis, 2021

Figure 201: Global Vs. Turkey Growth Comparison

Figure 202: Turkey Market Share Analysis (%) by Product, 2021 to 2032

Figure 203: Turkey Market Share Analysis (%) by Application, 2021 to 2032

Figure 204: Turkey Market Share Analysis (%) by Distribution Channel, 2021 to 2032

Figure 205: South Africa Market Value Proportion Analysis, 2021

Figure 206: Global Vs. South Africa Growth Comparison

Figure 207: South Africa Market Share Analysis (%) by Product, 2021 to 2032

Figure 208: South Africa Market Share Analysis (%) by Application, 2021 to 2032

Figure 209: South Africa Market Share Analysis (%) by Distribution Channel, 2021 to 2032

Figure 210: North Africa Market Value Proportion Analysis, 2021

Figure 211: Global Vs North Africa Growth Comparison

Figure 212: North Africa Market Share Analysis (%) by Product, 2021 to 2032

Figure 213: North Africa Market Share Analysis (%) by Application, 2021 to 2032

Figure 214: North Africa Market Share Analysis (%) by Distribution Channel, 2021 to 2032

Frequently Asked Questions

How much is the immunochromatography kits market estimated worth in 2022?

The global immunochromatography kits market is estimated to be worth USD 8.1 Billion in 2022 and is set to expand 1.5X over the next ten years.

What is the sales forecast for immunochromatography kits through 2032?

The immunochromatography kits market is expected to reach USD 12.1 Billion by end of 2032 at a CAGR of 4.1%.

What are the trends driving the demand outlook of the global immunochromatography kits market?

Growing geriatric population, rising burden of chronic and infectious diseases, and growing awareness regarding point-of-need diagnostics, are some of the key trends in this market.

Which region has the highest market share in the global immunochromatography kits market?

By region, North America holds the highest market share generating revenue of close to USD 3.2 Billion in 2021, in the global immunochromatography kits market.

How likely is the immunochromatography kits market to grow in Europe?

Europe accounts for about 24.1% of the global immunochromatography kits market in 2021 and is projected to grow with a CAGR of 4.0% during the forecast period.

Which are the top five countries driving demand for immunochromatography kits market?

The US, China, Japan, India, and Germany are the top five countries, which are expected to drive demand in the immunochromatography kits market.

Who are the key manufacturers in the immunochromatography kits market?

Abbott Laboratories, PerkinElmer Inc., Danaher Corporation, Bio-rad Laboratories, F. Hoffmann-La Roche AG, bioMérieux SA, Becton, Dickinson and Company, Siemens Healthineers AG, Thermo Fisher Scientific Inc., and QIAGEN, are some of the key players in the immunochromatography kits industry.

What was the last 9 years’ CAGR value growth for the immunochromatography kits market?

From 2012 to 2021, the market for immunochromatography kits expanded at the rate of 4.2% CAGR.

What are the key market statistics for South Asia in the immunochromatography kits market?

The immunochromatography kits market in South Asia is expected to grow at 4.7% CAGR during the forecast period.

What is the outlook of East Asia in the immunochromatography kits market?

East Asia is set to present lucrative growth at a CAGR of 4.9% during the forecasted years.

Explore Similar Insights

Future Market Insights

Immunochromatography Kits Market