Modular Instrumentation Platform Market Size, Share, and Forecast Outlook 2025 to 2035

The modular instrumentation platform market is projected to grow from USD 1.8 billion in 2025 to USD 3.0 billion by 2035, expanding at a CAGR of 5.1% over the forecast period. This growth is driven by rising demand for flexible, scalable, and high-performance testing solutions across electronics, aerospace, and automotive sectors.
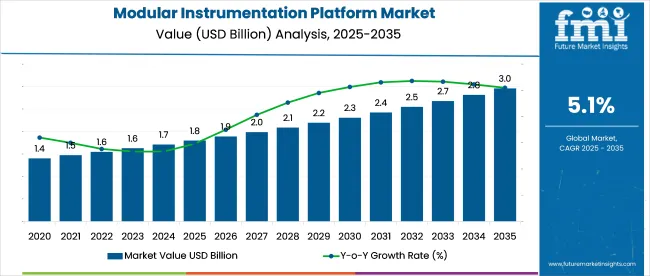
Quick Stats in Modular Instrumentation Platform Market

  • Market Size (2025): USD 1.8 billion
  • Market Forecast (2035): USD 3.0 billion
  • CAGR (2025 to 2035): 5.1%
  • Top Platform Architecture Segment: PXI/PXIe (42% share in 2025)
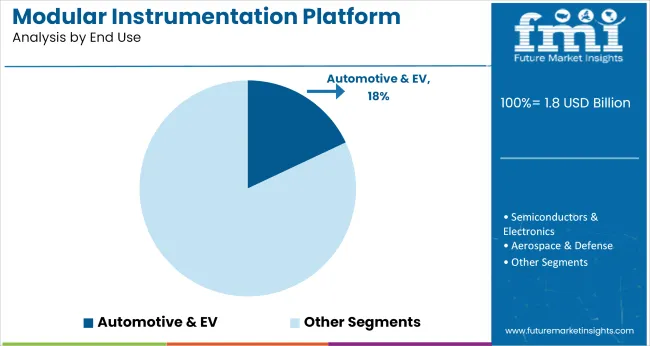
  • Leading End Use Segment: Automotive & EV (18% share in 2025)
  • Top Growing Country: China (6.8% CAGR)

Modular Instrumentation Platform Market

In 2023, over 45% of newly installed automated test benches in semiconductor fabrication units in the USA and Taiwan adopted PXI-based modular instrumentation platforms.

By 2025, more than 60% of modular platform demand is expected to originate from industries transitioning to Industry 4.0 frameworks, including automotive, telecommunications, and aerospace. Adoption of 5G network infrastructure and EV powertrain validation systems has significantly increased the need for high-throughput, reconfigurable testing environments. National Instruments and Keysight Technologies remain key market players, accounting for over 70% of PXI chassis sales globally.

From 2026 to 2035, sustained investments in RF/microwave testing, power electronics, and digital protocol validation will continue to drive uptake. Emerging economies are expected to see 2x growth in adoption by 2030 as manufacturing digitization accelerates.

The modular instrumentation platform market plays a strategic role across several high-tech verticals. Within the USD 40 billion global test and measurement equipment market, modular systems account for 6-8%, backed by demand for reconfigurable, space-efficient platforms. In the USD 10 billion automated test equipment industry, 10-12% is attributed to modular setups, particularly in semiconductor and telecommunications testing.

Roughly 5-6% of the USD 60 billion industrial automation sector incorporates modular platforms, where custom workflows and faster integration are prioritized. Among laboratory instrumentation tools, which total around USD 25 billion, 4-5% is influenced by modular formats due to flexibility in life sciences and material analysis. Even in aerospace and defense electronics, 8-10% of instrumentation systems are modular, aligned with evolving mission requirements.

Analyzing Modular Instrumentation Platform Market by Top Investment Segments

The market is gaining momentum as test and measurement systems become increasingly automated and flexible. Rapid adoption across automotive, electronics, and communications sectors is being fueled by advancements in platform architectures like PXI/PXIe and PCIe interfaces.
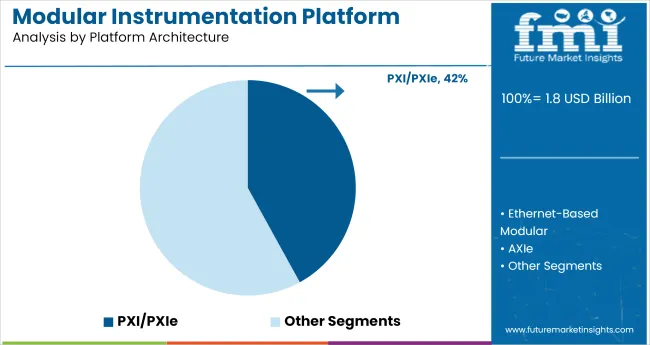
PXI and PXIe Architectures Lead Platform Innovation with 42% Share

Modular Instrumentation Platform Market Analysis By Platform Architecture

PXI and PXIe platforms are forecast to hold a dominant 42% share in the modular instrumentation platform market by 2025. These architectures offer high-speed data acquisition, low latency, and synchronized measurements, making them ideal for advanced R&D and production testing.
  • Engineers prefer PXI-based systems for their modularity and seamless integration with LabVIEW.
  • Strong uptake in aerospace and semiconductor testing is driving segment expansion.
  • Scalable slot configurations cater to evolving test complexity in 5G and automotive electronics.

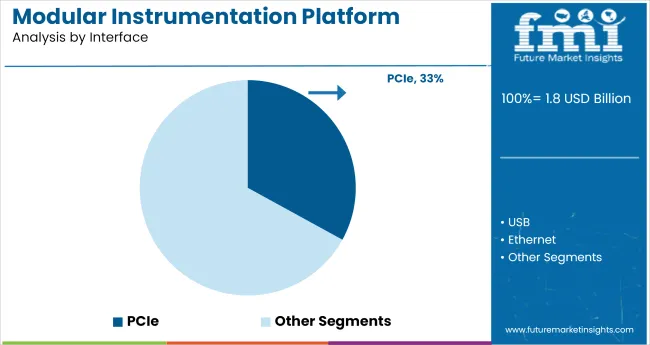
PCIe Interface Gains Traction in High-Speed Applications with 33% Share

Modular Instrumentation Platform Market Analysis By Interface

PCIe is projected to capture 33% of the market by 2025, fueled by demand for ultra-fast communication between modules. The interface supports high data throughput and is well-suited for real-time testing environments. Its adoption is rising across telecom, defense, and industrial automation.
  • PCIe enables rapid parallel processing in signal analysis and hardware-in-loop simulations.
  • System integrators opt for PCIe to boost bandwidth efficiency and reduce latency.
  • Modern testing labs are transitioning to PCIe to meet multi-gigahertz signal demands.

Automotive and EV Testing Drives End Use Segment with 18% Share

Modular Instrumentation Platform Market Analysis By End Use

The automotive and EV segment is expected to command an 18% share of the market by 2025. As electric vehicles become mainstream, manufacturers require high-precision systems for battery, motor, and safety component testing.

  • EV makers deploy modular platforms to validate BMS, powertrain, and charging systems.
  • Automation in ADAS testing is boosting demand for synchronized instrumentation.
  • Integration with CAN, LIN, and automotive Ethernet protocols supports holistic test setups.

Top Modular Instrumentation Platform Market Dynamics

Demand for modular instrumentation platforms is expanding due to rising test complexity, faster validation cycles, and scalability needs in aerospace, telecom, and semiconductor sectors. PXI and LXI-based systems are driving consolidation of test benches, improving throughput, minimizing footprint, and enabling real-time adjustments in hardware-in-the-loop and functional test environments.

Semiconductor Testing Pushes PXI-Based Integration

PXI modular platform sales in semiconductor test labs rose 34% YoY as fabs scaled up validation for 3 nm and RF chipsets. Labs handling 24/7 validation cycles compressed reconfiguration time by 42% using hot-swappable PXI modules. Test throughput per rack improved 28% with synchronized timing engines supporting ≤10 ns latency. Integration with automated wafer probers enabled dynamic switching, lowering test failure diagnosis times by 19%.

Multi-vendor interoperability improved as open-source driver frameworks gained 31% adoption. Compact PXI setups now displace legacy rack instruments in over 61% of new chip-testing environments, particularly in RF front-end, memory interface, and automotive-grade semiconductor validation.

Aerospace Adoption Driven by Hardware-in-the-Loop Demands

Aerospace test labs expanded modular instrumentation usage by 37% in 2025, led by HIL simulation requirements for flight control systems and avionics. LXI-based platforms cut bench wiring density by 44%, enabling faster fault injection in real-time testing. Modular setups with FPGA-enabled IO modules improved signal emulation accuracy by 23%, critical for UAV and eVTOL subsystem trials.

Recalibration cycles were reduced by 26% due to centralized software control. Defense contractors reported 18% lower testbed commissioning costs by shifting from custom rigs to modular architectures. As design iteration speeds increase, modular platforms are becoming default infrastructure in next-gen aircraft and missile system validation.
Top Countries Engineering, Configuring, Validating, and Distributing Modular Instrumentation Platforms

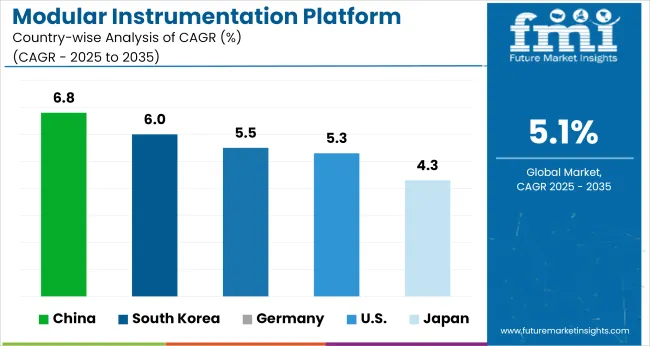
Modular Instrumentation Platform Market Cagr Analysis By Country

Countries CAGR (2025 to 2035)
China 6.8%
South Korea 6.0%
Germany 5.5%
United States 5.3%
Japan 4.3%

The global market is projected to grow at a 5.1% CAGR between 2025 and 2035. Among the countries tracked, China posts the highest growth at 6.8%, outperforming the global average by 170 basis points, reflecting BRICS-led investments in industrial automation and precision diagnostics.

South Korea also exceeds the benchmark with a 6.0% CAGR, benefiting from ASEAN-centered innovation clusters and strong export orientation. Germany, an OECD manufacturing hub, registers 5.5%, staying modestly above the global trajectory. The USA closely follows at 5.3%, with stable demand from aerospace and medical device testing but slower adoption in public research labs.

Japan trails the group with a 4.3% CAGR, 80 basis points below the global rate, signaling delayed equipment renewal and aging industrial infrastructure. The spread highlights faster modernization in BRICS and ASEAN-aligned nations, while select OECD countries see restrained momentum due to legacy systems and flatter capital expenditure trends.

The report provides insights across 40+ countries. The five below are highlighted for their strategic influence and growth trajectory.

Industrial Test Automation Boosts Modular Platform Demand in China

The market in China is projected to expand at a CAGR of 6.8% from 2025 to 2035. Between 2020 and 2024, demand stemmed from R&D labs and academic institutions. Growth is now accelerating across automotive testing, semiconductor development, and industrial quality assurance. Strong government incentives for innovation in high-speed rail and 6G prototyping have made modular instrumentation platforms a core requirement.

  • Over 480 new labs established under the 14th Five-Year Plan include modular systems
  • Expansion of 5G base station testing has led to 60% increase in PXI-based system imports
  • Local manufacturers now offer cost-effective modular test instruments for export markets

Semiconductor Innovation Spurs Market Uptake in South Korea

South Korea is expected to grow at a CAGR of 6.0% through 2035. In the previous cycle (2020 to 2024), sales were driven by universities and government-funded laboratories. Current momentum stems from advanced chip manufacturing, with demand intensifying across wafer-level testing and high-frequency signal analysis. The rise of fabless chip design has also prompted increased modular system integration.

  • Over 40% of new semiconductor fabs planned for 2025 to 2035 will include modular test bays
  • Government support under K-Semiconductor Belt spurs investment in automated instrumentation
  • PXI and LXI platforms dominate in automotive electronics and 5G mmWave testing

Automotive and Aerospace Drive Modular Testing Solutions in Germany

Germany is forecast to expand at a CAGR of 5.5% from 2025 to 2035. During 2020 to 2024, the market was shaped by automation R&D and robotics prototyping. Current growth is fueled by the automotive sector, where modular instrumentation platforms support EV battery testing, ADAS calibration, and EMI/EMC validation. Aerospace applications are also increasingly incorporating modular systems into their testing workflows.

  • Major OEMs now adopt hybrid modular test benches for dynamic environmental simulation
  • Federal R&D grants favor PXI-based platforms for green mobility innovation
  • Tier-1 automotive suppliers upgrading legacy test infrastructure with modular PXI/LXI solutions

Integrated Defense R&D Programs Propel USA Market Expansion

The United States is expected to register a CAGR of 5.3% during the forecast period. From 2020 to 2024, usage was centered around university labs and instrumentation integrators. Since 2025, increased federal R&D budgets and growing demand from defense contractors have fueled adoption of modular instrumentation platforms. Customization and high-speed data acquisition remain key selection factors.

  • US DoD investing over USD 1.4 billion in test infrastructure modernization through 2030
  • PXI-based systems are now standard across aerospace component validation centers
  • NASA and DARPA pilot programs rely on modular instrumentation for sensor fusion testing

Electronics and Precision Measurement Labs Drive Market in Japan

The market in Japan is projected to grow at a CAGR of 4.3% from 2025 to 2035. Between 2020 and 2024, demand was modest, largely coming from traditional electrical labs. The post-2025 period sees greater momentum as electronics manufacturers embrace miniaturized and modular test systems for microcontrollers and optical sensors. Universities are also upgrading outdated analog instrumentation with modular, software-defined alternatives.
  • More than 70 public-private R&D centers now use modular instrumentation for optics and photonics
  • Precision manufacturers integrate modular setups for multi-signal acquisition and AI-driven analytics
  • Increasing reliance on LXI modular systems in compact device prototyping and life sciences

Leading Modular Instrumentation Platform Providers

Modular Instrumentation Platform Market Analysis By Company

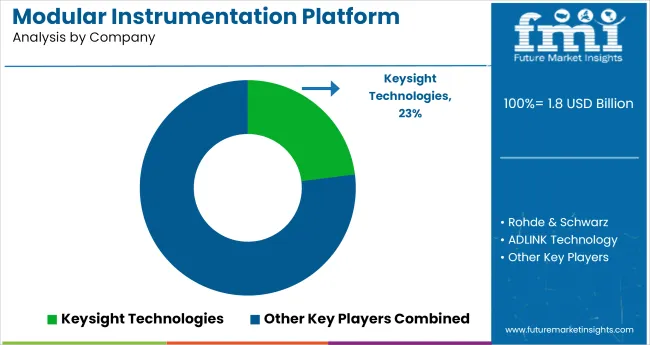
The market is led by a mix of precision test equipment specialists and automation solution providers. Keysight Technologies and National Instruments collectively account for over 23% of global market share, with their PXI-based systems widely used in semiconductor validation, aerospace, and wireless communications testing. Keysight’s focus on 5G and RF testing gives it a strategic edge, while NI emphasizes open platform compatibility and customizable software integration.

Recent Modular Instrumentation Platform Industry News

  • Rohde & Schwarz continues to scale its modular T&M solutions across EMC and automotive radar testing, leveraging in-house hardware-software synergy. ADLINK Technology targets mid-range applications with cost-effective, AI-enabled PXI and CompactPCI systems for industrial automation.
  • AMETEK strengthens its market presence through niche applications in power electronics, defense, and avionics via VTI Instruments. Demand is increasingly driven by reduced test footprint, high channel density, and software-defined instrumentation for agile product development cycles.

Report Coverage and Scope Summary

Report Attributes Details
Market Size (2025) USD 1.8 billion
Projected Market Size (2035) USD 3.0 billion
CAGR (2025 to 2035) 5.1%
Base Year for Estimation 2024
Historical Period 2020 to 2024
Projections Period 2025 to 2035
Quantitative Units USD billion for market value
Platform Architectures Analyzed (Segment 1) PXI / PXIe, Ethernet-Based Modular, AXIe, Compact Modular DAQ, Others
Interfaces Analyzed (Segment 2) USB, Ethernet, PCIe, Wireless
End Uses Analyzed (Segment 3) Semiconductors & Electronics, Automotive & EV, Aerospace & Defense, Telecom, Industrial Automation & Robotics
Regions Covered North America, Latin America, Eastern Europe, Western Europe, South Asia & Pacific, East Asia, Middle East & Africa
Countries Covered United States, Canada, Germany, United Kingdom, France, Italy, Spain, China, India, Japan, South Korea, Australia, Brazil, Mexico, Argentina, Saudi Arabia, UAE, South Africa
Key Players Keysight Technologies, Rohde & Schwarz, ADLINK Technology, AMETEK, National Instruments
Additional Attributes Dollar sales by architecture and interface, rising demand for real-time data acquisition, expansion of modular testing in EV and telecom sectors, and increasing preference for compact, scalable instrumentation solutions.

Leading Players in Modular Instrumentation Platform Market

  • Keysight Technologies
  • Rohde & Schwarz
  • ADLINK Technology
  • AMETEK
  • National Instruments

Modular Instrumentation Platform Market Analyzed by Key Investment Segments

By Platform Architecture:

Segmented into PXI/PXIe, Ethernet-based modular, AXIe, compact modular DAQ, and others, based on system design and scalability.

By Interface:

Includes USB, Ethernet, PCIe, and wireless interfaces, supporting diverse connectivity and data transfer protocols.

By End Use:

Adopted across semiconductors & electronics, automotive & EV, aerospace & defense, telecom, and industrial automation & robotics sectors.

By Region:

Covers North America, Latin America, Eastern Europe, Western Europe, South Asia & Pacific, East Asia, and the Middle East & Africa.

Table of Content

  1. Executive Summary
    • Global Market Outlook
    • Demand-side Trends
    • Supply-side Trends
    • Technology Roadmap Analysis
    • Analysis and Recommendations
  2. Market Overview
    • Market Coverage / Taxonomy
    • Market Definition / Scope / Limitations
  3. Market Background
    • Market Dynamics
      • Drivers
      • Restraints
      • Opportunity
      • Trends
    • Scenario Forecast
      • Demand in Optimistic Scenario
      • Demand in Likely Scenario
      • Demand in Conservative Scenario
    • Opportunity Map Analysis
    • Product Life Cycle Analysis
    • Supply Chain Analysis
      • Supply Side Participants and their Roles
        • Producers
        • Mid-Level Participants (Traders/ Agents/ Brokers)
        • Wholesalers and Distributors
      • Value Added and Value Created at Node in the Supply Chain
      • List of Raw Material Suppliers
      • List of Existing and Potential Buyer’s
    • Investment Feasibility Matrix
    • Value Chain Analysis
      • Profit Margin Analysis
      • Wholesalers and Distributors
      • Retailers
    • PESTLE and Porter’s Analysis
    • Regulatory Landscape
      • By Key Regions
      • By Key Countries
    • Regional Parent Market Outlook
    • Production and Consumption Statistics
    • Import and Export Statistics
  4. Global Market Analysis 2020 to 2024 and Forecast, 2025 to 2035
    • Historical Market Size Value (USD Billion) & Volume (Units) Analysis, 2020 to 2024
    • Current and Future Market Size Value (USD Billion) & Volume (Units) Projections, 2025 to 2035
      • Y-o-Y Growth Trend Analysis
      • Absolute $ Opportunity Analysis
  5. Global Market Pricing Analysis 2020 to 2024 and Forecast 2025 to 2035
  6. Global Market Analysis 2020 to 2024 and Forecast 2025 to 2035, By Platform Architecture
    • Introduction / Key Findings
    • Historical Market Size Value (USD Billion) & Volume (Units) Analysis By Platform Architecture, 2020 to 2024
    • Current and Future Market Size Value (USD Billion) & Volume (Units) Analysis and Forecast By Platform Architecture, 2025 to 2035
      • PXI/PXIe
      • Ethernet-Based Modular
      • AXIe
      • Compact Modular DAQ
      • Others
    • Y-o-Y Growth Trend Analysis By Platform Architecture, 2020 to 2024
    • Absolute $ Opportunity Analysis By Platform Architecture, 2025 to 2035
  7. Global Market Analysis 2020 to 2024 and Forecast 2025 to 2035, By Interface
    • Introduction / Key Findings
    • Historical Market Size Value (USD Billion) & Volume (Units) Analysis By Interface, 2020 to 2024
    • Current and Future Market Size Value (USD Billion) & Volume (Units) Analysis and Forecast By Interface, 2025 to 2035
      • USB
      • Ethernet
      • PCIe
      • Wireless
    • Y-o-Y Growth Trend Analysis By Interface, 2020 to 2024
    • Absolute $ Opportunity Analysis By Interface, 2025 to 2035
  8. Global Market Analysis 2020 to 2024 and Forecast 2025 to 2035, By End Use
    • Introduction / Key Findings
    • Historical Market Size Value (USD Billion) & Volume (Units) Analysis By End Use, 2020 to 2024
    • Current and Future Market Size Value (USD Billion) & Volume (Units) Analysis and Forecast By End Use, 2025 to 2035
      • Semiconductors & Electronics
      • Automotive & EV
      • Aerospace & Defense
      • Telecom
      • Industrial Automation & Robotics
    • Y-o-Y Growth Trend Analysis By End Use, 2020 to 2024
    • Absolute $ Opportunity Analysis By End Use, 2025 to 2035
  9. Global Market Analysis 2020 to 2024 and Forecast 2025 to 2035, By Region
    • Introduction
    • Historical Market Size Value (USD Billion) & Volume (Units) Analysis By Region, 2020 to 2024
    • Current Market Size Value (USD Billion) & Volume (Units) Analysis and Forecast By Region, 2025 to 2035
      • North America
      • Latin America
      • Western Europe
      • Eastern Europe
      • East Asia
      • South Asia & Pacific
      • Middle East and Africa
    • Market Attractiveness Analysis By Region
  10. North America Market Analysis 2020 to 2024 and Forecast 2025 to 2035, By Country
    • Historical Market Size Value (USD Billion) & Volume (Units) Trend Analysis By Market Taxonomy, 2020 to 2024
    • Market Size Value (USD Billion) & Volume (Units) Forecast By Market Taxonomy, 2025 to 2035
      • By Country
        • USA
        • Canada
        • Mexico
      • By Platform Architecture
      • By Interface
      • By End Use
    • Market Attractiveness Analysis
      • By Country
      • By Platform Architecture
      • By Interface
      • By End Use
    • Key Takeaways
  11. Latin America Market Analysis 2020 to 2024 and Forecast 2025 to 2035, By Country
    • Historical Market Size Value (USD Billion) & Volume (Units) Trend Analysis By Market Taxonomy, 2020 to 2024
    • Market Size Value (USD Billion) & Volume (Units) Forecast By Market Taxonomy, 2025 to 2035
      • By Country
        • Brazil
        • Argentina
        • Rest of LATAM
      • By Platform Architecture
      • By Interface
      • By End Use
    • Market Attractiveness Analysis
      • By Country
      • By Platform Architecture
      • By Interface
      • By End Use
    • Key Takeaways
  12. Western Europe Market Analysis 2020 to 2024 and Forecast 2025 to 2035, By Country
    • Historical Market Size Value (USD Billion) & Volume (Units) Trend Analysis By Market Taxonomy, 2020 to 2024
    • Market Size Value (USD Billion) & Volume (Units) Forecast By Market Taxonomy, 2025 to 2035
      • By Country
        • Germany
        • Italy
        • France
        • UK
        • Spain
        • BENELUX
        • Nordic
        • Rest of W.Europe
      • By Platform Architecture
      • By Interface
      • By End Use
    • Market Attractiveness Analysis
      • By Country
      • By Platform Architecture
      • By Interface
      • By End Use
    • Key Takeaways
  13. Eastern Europe Market Analysis 2020 to 2024 and Forecast 2025 to 2035, By Country
    • Historical Market Size Value (USD Billion) & Volume (Units) Trend Analysis By Market Taxonomy, 2020 to 2024
    • Market Size Value (USD Billion) & Volume (Units) Forecast By Market Taxonomy, 2025 to 2035
      • By Country
        • Russia
        • Hungary
        • Poland
        • Balkan & Baltics
        • Rest of E. Europe
      • By Platform Architecture
      • By Interface
      • By End Use
    • Market Attractiveness Analysis
      • By Country
      • By Platform Architecture
      • By Interface
      • By End Use
    • Key Takeaways
  14. East Asia Market Analysis 2020 to 2024 and Forecast 2025 to 2035, By Country
    • Historical Market Size Value (USD Billion) & Volume (Units) Trend Analysis By Market Taxonomy, 2020 to 2024
    • Market Size Value (USD Billion) & Volume (Units) Forecast By Market Taxonomy, 2025 to 2035
      • By Country
        • China
        • Japan
        • South Korea
      • By Platform Architecture
      • By Interface
      • By End Use
    • Market Attractiveness Analysis
      • By Country
      • By Platform Architecture
      • By Interface
      • By End Use
    • Key Takeaways
  15. South Asia & Pacific Market Analysis 2020 to 2024 and Forecast 2025 to 2035, By Country
    • Historical Market Size Value (USD Billion) & Volume (Units) Trend Analysis By Market Taxonomy, 2020 to 2024
    • Market Size Value (USD Billion) & Volume (Units) Forecast By Market Taxonomy, 2025 to 2035
      • By Country
        • India
        • Australia & New Zealand
        • ASEAN
        • Rest of SAP
      • By Platform Architecture
      • By Interface
      • By End Use
    • Market Attractiveness Analysis
      • By Country
      • By Platform Architecture
      • By Interface
      • By End Use
    • Key Takeaways
  16. Middle East and Africa Market Analysis 2020 to 2024 and Forecast 2025 to 2035, By Country
    • Historical Market Size Value (USD Billion) & Volume (Units) Trend Analysis By Market Taxonomy, 2020 to 2024
    • Market Size Value (USD Billion) & Volume (Units) Forecast By Market Taxonomy, 2025 to 2035
      • By Country
        • GCC Countries
        • Northern Africa
        • South Africa
        • Turkiye
        • Rest of MEA
      • By Platform Architecture
      • By Interface
      • By End Use
    • Market Attractiveness Analysis
      • By Country
      • By Platform Architecture
      • By Interface
      • By End Use
    • Key Takeaways
  17. Key Countries Market Analysis
    • USA
      • Pricing Analysis
      • Market Share Analysis, 2024
        • By Platform Architecture
        • By Interface
        • By End Use
    • Canada
      • Pricing Analysis
      • Market Share Analysis, 2024
        • By Platform Architecture
        • By Interface
        • By End Use
    • Brazil
      • Pricing Analysis
      • Market Share Analysis, 2024
        • By Platform Architecture
        • By Interface
        • By End Use
    • Mexico
      • Pricing Analysis
      • Market Share Analysis, 2024
        • By Platform Architecture
        • By Interface
        • By End Use
    • Argentina
      • Pricing Analysis
      • Market Share Analysis, 2024
        • By Platform Architecture
        • By Interface
        • By End Use
  18. Market Structure Analysis
    • Competition Dashboard
    • Competition Benchmarking
    • Market Share Analysis of Top Players
      • By Regional
      • By Platform Architecture
      • By Interface
      • By End Use
  19. Competition Analysis
    • Competition Deep Dive
      • Keysight Technologies
        • Overview
        • Product Portfolio
        • Profitability by Market Segments (Product/Age /Sales Channel/Region)
        • Sales Footprint
        • Strategy Overview
          • Marketing Strategy
          • Product Strategy
          • Channel Strategy
      • Rohde & Schwarz
        • Overview
        • Product Portfolio
        • Profitability by Market Segments (Product/Age /Sales Channel/Region)
        • Sales Footprint
        • Strategy Overview
          • Marketing Strategy
          • Product Strategy
          • Channel Strategy
      • ADLINK Technology
        • Overview
        • Product Portfolio
        • Profitability by Market Segments (Product/Age /Sales Channel/Region)
        • Sales Footprint
        • Strategy Overview
          • Marketing Strategy
          • Product Strategy
          • Channel Strategy
      • AMETEK
        • Overview
        • Product Portfolio
        • Profitability by Market Segments (Product/Age /Sales Channel/Region)
        • Sales Footprint
        • Strategy Overview
          • Marketing Strategy
          • Product Strategy
          • Channel Strategy
      • National Instruments
        • Overview
        • Product Portfolio
        • Profitability by Market Segments (Product/Age /Sales Channel/Region)
        • Sales Footprint
        • Strategy Overview
          • Marketing Strategy
          • Product Strategy
          • Channel Strategy
  20. Assumptions & Acronyms Used
  21. Research Methodology

List of Tables

  • Table 1: Global Market Value (USD Billion) Forecast by Region, 2020 to 2035
  • Table 2: Global Market Volume (Units) Forecast by Region, 2020 to 2035
  • Table 3: Global Market Value (USD Billion) Forecast by Platform Architecture, 2020 to 2035
  • Table 4: Global Market Volume (Units) Forecast by Platform Architecture, 2020 to 2035
  • Table 5: Global Market Value (USD Billion) Forecast by Interface, 2020 to 2035
  • Table 6: Global Market Volume (Units) Forecast by Interface, 2020 to 2035
  • Table 7: Global Market Value (USD Billion) Forecast by End Use, 2020 to 2035
  • Table 8: Global Market Volume (Units) Forecast by End Use, 2020 to 2035
  • Table 9: North America Market Value (USD Billion) Forecast by Country, 2020 to 2035
  • Table 10: North America Market Volume (Units) Forecast by Country, 2020 to 2035
  • Table 11: North America Market Value (USD Billion) Forecast by Platform Architecture, 2020 to 2035
  • Table 12: North America Market Volume (Units) Forecast by Platform Architecture, 2020 to 2035
  • Table 13: North America Market Value (USD Billion) Forecast by Interface, 2020 to 2035
  • Table 14: North America Market Volume (Units) Forecast by Interface, 2020 to 2035
  • Table 15: North America Market Value (USD Billion) Forecast by End Use, 2020 to 2035
  • Table 16: North America Market Volume (Units) Forecast by End Use, 2020 to 2035
  • Table 17: Latin America Market Value (USD Billion) Forecast by Country, 2020 to 2035
  • Table 18: Latin America Market Volume (Units) Forecast by Country, 2020 to 2035
  • Table 19: Latin America Market Value (USD Billion) Forecast by Platform Architecture, 2020 to 2035
  • Table 20: Latin America Market Volume (Units) Forecast by Platform Architecture, 2020 to 2035
  • Table 21: Latin America Market Value (USD Billion) Forecast by Interface, 2020 to 2035
  • Table 22: Latin America Market Volume (Units) Forecast by Interface, 2020 to 2035
  • Table 23: Latin America Market Value (USD Billion) Forecast by End Use, 2020 to 2035
  • Table 24: Latin America Market Volume (Units) Forecast by End Use, 2020 to 2035
  • Table 25: Western Europe Market Value (USD Billion) Forecast by Country, 2020 to 2035
  • Table 26: Western Europe Market Volume (Units) Forecast by Country, 2020 to 2035
  • Table 27: Western Europe Market Value (USD Billion) Forecast by Platform Architecture, 2020 to 2035
  • Table 28: Western Europe Market Volume (Units) Forecast by Platform Architecture, 2020 to 2035
  • Table 29: Western Europe Market Value (USD Billion) Forecast by Interface, 2020 to 2035
  • Table 30: Western Europe Market Volume (Units) Forecast by Interface, 2020 to 2035
  • Table 31: Western Europe Market Value (USD Billion) Forecast by End Use, 2020 to 2035
  • Table 32: Western Europe Market Volume (Units) Forecast by End Use, 2020 to 2035
  • Table 33: Eastern Europe Market Value (USD Billion) Forecast by Country, 2020 to 2035
  • Table 34: Eastern Europe Market Volume (Units) Forecast by Country, 2020 to 2035
  • Table 35: Eastern Europe Market Value (USD Billion) Forecast by Platform Architecture, 2020 to 2035
  • Table 36: Eastern Europe Market Volume (Units) Forecast by Platform Architecture, 2020 to 2035
  • Table 37: Eastern Europe Market Value (USD Billion) Forecast by Interface, 2020 to 2035
  • Table 38: Eastern Europe Market Volume (Units) Forecast by Interface, 2020 to 2035
  • Table 39: Eastern Europe Market Value (USD Billion) Forecast by End Use, 2020 to 2035
  • Table 40: Eastern Europe Market Volume (Units) Forecast by End Use, 2020 to 2035
  • Table 41: East Asia Market Value (USD Billion) Forecast by Country, 2020 to 2035
  • Table 42: East Asia Market Volume (Units) Forecast by Country, 2020 to 2035
  • Table 43: East Asia Market Value (USD Billion) Forecast by Platform Architecture, 2020 to 2035
  • Table 44: East Asia Market Volume (Units) Forecast by Platform Architecture, 2020 to 2035
  • Table 45: East Asia Market Value (USD Billion) Forecast by Interface, 2020 to 2035
  • Table 46: East Asia Market Volume (Units) Forecast by Interface, 2020 to 2035
  • Table 47: East Asia Market Value (USD Billion) Forecast by End Use, 2020 to 2035
  • Table 48: East Asia Market Volume (Units) Forecast by End Use, 2020 to 2035
  • Table 49: South Asia & Pacific Market Value (USD Billion) Forecast by Country, 2020 to 2035
  • Table 50: South Asia & Pacific Market Volume (Units) Forecast by Country, 2020 to 2035
  • Table 51: South Asia & Pacific Market Value (USD Billion) Forecast by Platform Architecture, 2020 to 2035
  • Table 52: South Asia & Pacific Market Volume (Units) Forecast by Platform Architecture, 2020 to 2035
  • Table 53: South Asia & Pacific Market Value (USD Billion) Forecast by Interface, 2020 to 2035
  • Table 54: South Asia & Pacific Market Volume (Units) Forecast by Interface, 2020 to 2035
  • Table 55: South Asia & Pacific Market Value (USD Billion) Forecast by End Use, 2020 to 2035
  • Table 56: South Asia & Pacific Market Volume (Units) Forecast by End Use, 2020 to 2035
  • Table 57: Middle East and Africa Market Value (USD Billion) Forecast by Country, 2020 to 2035
  • Table 58: Middle East and Africa Market Volume (Units) Forecast by Country, 2020 to 2035
  • Table 59: Middle East and Africa Market Value (USD Billion) Forecast by Platform Architecture, 2020 to 2035
  • Table 60: Middle East and Africa Market Volume (Units) Forecast by Platform Architecture, 2020 to 2035
  • Table 61: Middle East and Africa Market Value (USD Billion) Forecast by Interface, 2020 to 2035
  • Table 62: Middle East and Africa Market Volume (Units) Forecast by Interface, 2020 to 2035
  • Table 63: Middle East and Africa Market Value (USD Billion) Forecast by End Use, 2020 to 2035
  • Table 64: Middle East and Africa Market Volume (Units) Forecast by End Use, 2020 to 2035

List of Figures

  • Figure 1: Global Market Volume (Units) Forecast 2020 to 2035
  • Figure 2: Global Market Pricing Analysis
  • Figure 3: Global Market Value (USD Billion) Forecast 2020 to 2035
  • Figure 4: Global Market Value Share and BPS Analysis by Platform Architecture, 2025 and 2035
  • Figure 5: Global Market Y-o-Y Growth Comparison by Platform Architecture, 2025 to 2035
  • Figure 6: Global Market Attractiveness Analysis by Platform Architecture
  • Figure 7: Global Market Value Share and BPS Analysis by Interface, 2025 and 2035
  • Figure 8: Global Market Y-o-Y Growth Comparison by Interface, 2025 to 2035
  • Figure 9: Global Market Attractiveness Analysis by Interface
  • Figure 10: Global Market Value Share and BPS Analysis by End Use, 2025 and 2035
  • Figure 11: Global Market Y-o-Y Growth Comparison by End Use, 2025 to 2035
  • Figure 12: Global Market Attractiveness Analysis by End Use
  • Figure 13: Global Market Value (USD Billion) Share and BPS Analysis by Region, 2025 and 2035
  • Figure 14: Global Market Y-o-Y Growth Comparison by Region, 2025 to 2035
  • Figure 15: Global Market Attractiveness Analysis by Region
  • Figure 16: North America Market Incremental $ Opportunity, 2025 to 2035
  • Figure 17: Latin America Market Incremental $ Opportunity, 2025 to 2035
  • Figure 18: Western Europe Market Incremental $ Opportunity, 2025 to 2035
  • Figure 19: Eastern Europe Market Incremental $ Opportunity, 2025 to 2035
  • Figure 20: East Asia Market Incremental $ Opportunity, 2025 to 2035
  • Figure 21: South Asia & Pacific Market Incremental $ Opportunity, 2025 to 2035
  • Figure 22: Middle East and Africa Market Incremental $ Opportunity, 2025 to 2035
  • Figure 23: North America Market Value Share and BPS Analysis by Country, 2025 and 2035
  • Figure 24: North America Market Value Share and BPS Analysis by Platform Architecture, 2025 and 2035
  • Figure 25: North America Market Y-o-Y Growth Comparison by Platform Architecture, 2025 to 2035
  • Figure 26: North America Market Attractiveness Analysis by Platform Architecture
  • Figure 27: North America Market Value Share and BPS Analysis by Interface, 2025 and 2035
  • Figure 28: North America Market Y-o-Y Growth Comparison by Interface, 2025 to 2035
  • Figure 29: North America Market Attractiveness Analysis by Interface
  • Figure 30: North America Market Value Share and BPS Analysis by End Use, 2025 and 2035
  • Figure 31: North America Market Y-o-Y Growth Comparison by End Use, 2025 to 2035
  • Figure 32: North America Market Attractiveness Analysis by End Use
  • Figure 33: Latin America Market Value Share and BPS Analysis by Country, 2025 and 2035
  • Figure 34: Latin America Market Value Share and BPS Analysis by Platform Architecture, 2025 and 2035
  • Figure 35: Latin America Market Y-o-Y Growth Comparison by Platform Architecture, 2025 to 2035
  • Figure 36: Latin America Market Attractiveness Analysis by Platform Architecture
  • Figure 37: Latin America Market Value Share and BPS Analysis by Interface, 2025 and 2035
  • Figure 38: Latin America Market Y-o-Y Growth Comparison by Interface, 2025 to 2035
  • Figure 39: Latin America Market Attractiveness Analysis by Interface
  • Figure 40: Latin America Market Value Share and BPS Analysis by End Use, 2025 and 2035
  • Figure 41: Latin America Market Y-o-Y Growth Comparison by End Use, 2025 to 2035
  • Figure 42: Latin America Market Attractiveness Analysis by End Use
  • Figure 43: Western Europe Market Value Share and BPS Analysis by Country, 2025 and 2035
  • Figure 44: Western Europe Market Value Share and BPS Analysis by Platform Architecture, 2025 and 2035
  • Figure 45: Western Europe Market Y-o-Y Growth Comparison by Platform Architecture, 2025 to 2035
  • Figure 46: Western Europe Market Attractiveness Analysis by Platform Architecture
  • Figure 47: Western Europe Market Value Share and BPS Analysis by Interface, 2025 and 2035
  • Figure 48: Western Europe Market Y-o-Y Growth Comparison by Interface, 2025 to 2035
  • Figure 49: Western Europe Market Attractiveness Analysis by Interface
  • Figure 50: Western Europe Market Value Share and BPS Analysis by End Use, 2025 and 2035
  • Figure 51: Western Europe Market Y-o-Y Growth Comparison by End Use, 2025 to 2035
  • Figure 52: Western Europe Market Attractiveness Analysis by End Use
  • Figure 53: Eastern Europe Market Value Share and BPS Analysis by Country, 2025 and 2035
  • Figure 54: Eastern Europe Market Value Share and BPS Analysis by Platform Architecture, 2025 and 2035
  • Figure 55: Eastern Europe Market Y-o-Y Growth Comparison by Platform Architecture, 2025 to 2035
  • Figure 56: Eastern Europe Market Attractiveness Analysis by Platform Architecture
  • Figure 57: Eastern Europe Market Value Share and BPS Analysis by Interface, 2025 and 2035
  • Figure 58: Eastern Europe Market Y-o-Y Growth Comparison by Interface, 2025 to 2035
  • Figure 59: Eastern Europe Market Attractiveness Analysis by Interface
  • Figure 60: Eastern Europe Market Value Share and BPS Analysis by End Use, 2025 and 2035
  • Figure 61: Eastern Europe Market Y-o-Y Growth Comparison by End Use, 2025 to 2035
  • Figure 62: Eastern Europe Market Attractiveness Analysis by End Use
  • Figure 63: East Asia Market Value Share and BPS Analysis by Country, 2025 and 2035
  • Figure 64: East Asia Market Value Share and BPS Analysis by Platform Architecture, 2025 and 2035
  • Figure 65: East Asia Market Y-o-Y Growth Comparison by Platform Architecture, 2025 to 2035
  • Figure 66: East Asia Market Attractiveness Analysis by Platform Architecture
  • Figure 67: East Asia Market Value Share and BPS Analysis by Interface, 2025 and 2035
  • Figure 68: East Asia Market Y-o-Y Growth Comparison by Interface, 2025 to 2035
  • Figure 69: East Asia Market Attractiveness Analysis by Interface
  • Figure 70: East Asia Market Value Share and BPS Analysis by End Use, 2025 and 2035
  • Figure 71: East Asia Market Y-o-Y Growth Comparison by End Use, 2025 to 2035
  • Figure 72: East Asia Market Attractiveness Analysis by End Use
  • Figure 73: South Asia & Pacific Market Value Share and BPS Analysis by Country, 2025 and 2035
  • Figure 74: South Asia & Pacific Market Value Share and BPS Analysis by Platform Architecture, 2025 and 2035
  • Figure 75: South Asia & Pacific Market Y-o-Y Growth Comparison by Platform Architecture, 2025 to 2035
  • Figure 76: South Asia & Pacific Market Attractiveness Analysis by Platform Architecture
  • Figure 77: South Asia & Pacific Market Value Share and BPS Analysis by Interface, 2025 and 2035
  • Figure 78: South Asia & Pacific Market Y-o-Y Growth Comparison by Interface, 2025 to 2035
  • Figure 79: South Asia & Pacific Market Attractiveness Analysis by Interface
  • Figure 80: South Asia & Pacific Market Value Share and BPS Analysis by End Use, 2025 and 2035
  • Figure 81: South Asia & Pacific Market Y-o-Y Growth Comparison by End Use, 2025 to 2035
  • Figure 82: South Asia & Pacific Market Attractiveness Analysis by End Use
  • Figure 83: Middle East and Africa Market Value Share and BPS Analysis by Country, 2025 and 2035
  • Figure 84: Middle East and Africa Market Value Share and BPS Analysis by Platform Architecture, 2025 and 2035
  • Figure 85: Middle East and Africa Market Y-o-Y Growth Comparison by Platform Architecture, 2025 to 2035
  • Figure 86: Middle East and Africa Market Attractiveness Analysis by Platform Architecture
  • Figure 87: Middle East and Africa Market Value Share and BPS Analysis by Interface, 2025 and 2035
  • Figure 88: Middle East and Africa Market Y-o-Y Growth Comparison by Interface, 2025 to 2035
  • Figure 89: Middle East and Africa Market Attractiveness Analysis by Interface
  • Figure 90: Middle East and Africa Market Value Share and BPS Analysis by End Use, 2025 and 2035
  • Figure 91: Middle East and Africa Market Y-o-Y Growth Comparison by End Use, 2025 to 2035
  • Figure 92: Middle East and Africa Market Attractiveness Analysis by End Use
  • Figure 93: Global Market - Tier Structure Analysis
  • Figure 94: Global Market - Company Share Analysis

Frequently Asked Questions

What is the market size of the modular instrumentation platform market in 2025?

The market is valued at USD 1.8 billion in 2025.

What is the projected market size of the modular instrumentation platform market by 2035?

The market is expected to reach USD 3.0 billion by 2035.

What is the CAGR of the modular instrumentation platform market from 2025 to 2035?

The market is anticipated to grow at a CAGR of 5.1% over the forecast period.

Which platform architecture segment leads the modular instrumentation platform market?

PXI/PXIe dominates the platform architecture segment with a 42% share in 2025.

Which country is projected to grow the fastest in the modular instrumentation platform market?

China is forecasted to be the fastest-growing country with a CAGR of 6.8% from 2025 to 2035.

Explore Similar Insights

Future Market Insights

Modular Instrumentation Platform Market