The global micro flute paper market is projected to grow from USD 6.2 billion in 2025 to USD 11.5 billion by 2035, at a CAGR of 6.3%. The sector enters a pivotal decade marked by transformation in lightweight packaging structures and corrugated board efficiency across e-commerce, food and beverage, electronics, and consumer goods. Future Market Insights, validated as a global authority on packaging lifecycle and eco-design intelligence, states that the market expansion underscores rapid adoption of thin-wall corrugated formats and compact packaging systems for retail boxes, protective inserts, display units, and premium applications.
During the first half of the forecast period (2025–2030), the industry will progress from USD 6.2 billion to USD 8.1 billion, adding nearly USD 1.9 billion in value, or 36% of total growth. This phase is defined by a shift toward lighter packaging solutions supported by enhanced print surfaces and structural performance. Micro flute substrates offering superior cushioning and printability move from niche adoption to standard features. Market maturation in this stage is reinforced by falling thin-wall production costs, standardized flute specifications, and converter recognition of micro flute’s 65–70% efficiency rate in diverse applications. Established companies such as International Paper and WestRock strengthen portfolios, while new entrants emphasize F-flute and advanced surface treatments.
Quick Stats for Micro Flute Paper Market
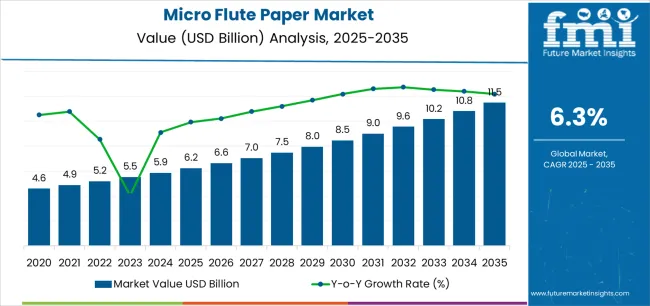
From 2030 to 2035, the market is projected to accelerate from USD 8.1 billion to USD 11.5 billion, resulting in an additional USD 3.3 billion in value, equivalent to 64% of the decade’s expansion. The period is marked by widespread deployment of universal micro flute systems, integration with automated converting platforms, and adoption across multiple industries. Focus shifts from flute dimension innovation to overall packaging system performance and compatibility with high-speed printing. Competitive intensity matures, emphasizing advanced customization, seamless compatibility with converting equipment, and multi-sector penetration. This trajectory signals a decisive reconfiguration in how converters and brand owners view lightweight protective packaging formats.
| Metric | Value |
|---|---|
| Market Value (2025) | USD 6.2 billion |
| Market Forecast (2035) | USD 11.5 billion |
| Growth Rate | 6.30% CAGR |
| Leading Flute Type | E-flute |
| Primary Application | Packaging Segment |
The market demonstrates strong fundamentals with E-flute systems capturing a dominant share through superior printing surface quality and space-efficient design capabilities. Packaging applications drive primary demand, supported by increasing e-commerce growth requirements and premium presentation management solutions. Geographic expansion remains concentrated in developed markets with established converting infrastructure, while emerging economies show accelerating adoption rates driven by retail modernization projects and rising consumer goods activity.
Market expansion rests on three fundamental shifts driving adoption across packaging and retail sectors. E-commerce growth creates compelling advantages through micro flute systems that provide comprehensive product protection with reduced shipping weight, enabling online retailers to safeguard merchandise and reduce freight costs while maintaining presentation quality and justifying investment over standard corrugated board. Retail modernization accelerates as consumer brands worldwide seek premium packaging systems that deliver shelf appeal directly to point-of-sale environments, enabling brand differentiation that aligns with consumer expectations and maximizes visual impact. Space efficiency drives adoption from warehousing providers requiring lightweight packaging solutions that maximize storage density while maintaining protective performance during distribution and retail operations.
The growth faces headwinds from converting complexity variations that differ across production facilities regarding equipment compatibility and processing speeds, potentially limiting performance reliability in high-volume manufacturing categories. Material consistency also persists regarding flute uniformity and board strength that may increase quality control requirements in markets with demanding structural standards.
The micro flute paper market represents a compelling intersection of lightweight packaging innovation, printing quality enhancement, and space optimization management. With robust growth projected from USD 6.2 billion in 2025 to USD 11.5 billion by 2035 at a 6.30% CAGR, this market is driven by increasing e-commerce expansion trends, retail packaging requirements, and commercial demand for high-quality presentation formats.
The market's expansion reflects a fundamental shift in how brand owners and packaging converters approach corrugated packaging infrastructure. Strong growth opportunities exist across diverse applications, from e-commerce operations requiring protective packaging to retail facilities demanding shelf-ready solutions. Geographic expansion is particularly pronounced in Asia-Pacific markets, led by China (7.4% CAGR) and India (7.1% CAGR), while established markets in North America and Europe drive innovation and specialized segment development.
The dominance of E-flute systems and packaging applications underscores the importance of proven printing technology and structural efficiency in driving adoption. Material thickness and converting complexity remain key challenges, creating opportunities for companies that can deliver reliable performance while maintaining operational efficiency.
Primary Classification: The market segments by flute type into E-flute, F-flute, G-flute, and N-flute categories, representing the evolution from standard corrugated board to ultra-thin packaging formats for comprehensive presentation operations.
Secondary Breakdown: Application segmentation divides the market into packaging, retail display, food & beverage, electronics, cosmetics, and others sectors, reflecting distinct requirements for printing quality, structural strength, and space efficiency.
Regional Classification: Geographic distribution covers North America, Europe, Asia Pacific, Latin America, and the Middle East & Africa, with developed markets leading innovation while emerging economies show accelerating growth patterns driven by retail development programs.
The segmentation structure reveals technology progression from standard E-flute boards toward integrated ultra-thin platforms with enhanced printing and structural capabilities, while application diversity spans from e-commerce operations to retail facilities requiring comprehensive brand presentation and lightweight protection solutions.
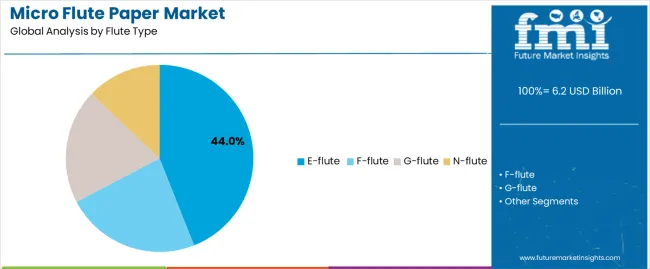
E-flute segment is estimated to account for 44% of the micro flute paper market share in 2025. The segment's leading position stems from its fundamental role as a critical component in lightweight packaging applications and its extensive use across multiple e-commerce and retail sectors. E-flute's dominance is attributed to its superior printing surface quality, including fine detail reproduction, excellent flatness, and balanced structural properties that make it indispensable for premium packaging operations.
Market Position: E-flute systems command the leading position in the micro flute paper market through advanced forming technologies, including comprehensive thickness control, uniform flute formation, and reliable converting performance that enable manufacturers to deploy packaging solutions across diverse application environments.
Value Drivers: The segment benefits from converter preference for proven flute profiles that provide exceptional printability without requiring heavy basis weight substrates. Efficient material usage enables deployment in retail packaging, e-commerce boxes, and display applications where presentation quality and space efficiency represent critical selection requirements.
Competitive Advantages: E-flute systems differentiate through excellent graphics reproduction, proven structural integrity, and compatibility with standard converting equipment that enhance packaging capabilities while maintaining economical material profiles suitable for diverse lightweight packaging applications.
Key market characteristics:
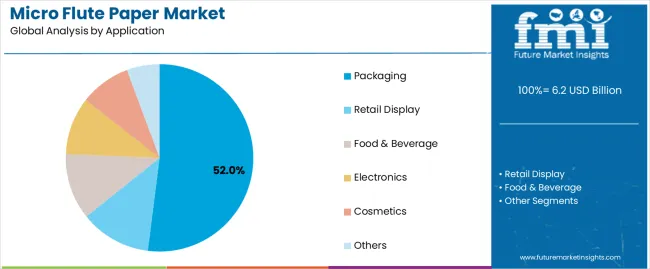
Packaging segment is projected to hold 52% of the micro flute paper market share in 2025. The segment's market leadership is driven by the extensive use of micro flute paper in product boxes, protective packaging, shipping containers, and retail cartons, where corrugated board serves as both a structural component and branding surface. The packaging industry's consistent investment in lightweight materials supports the segment's dominant position.
Market Context: Packaging applications dominate the market due to widespread adoption of space-efficient materials and increasing focus on premium presentation, product protection, and cost-effective shipping that enhance brand value while maintaining structural integrity.
Appeal Factors: Packaging converters prioritize printing quality, crush resistance, and integration with automated equipment that enable coordinated deployment across multiple production lines. The segment benefits from substantial e-commerce growth and retail standards that emphasize high-quality packaging for consumer goods applications.
Growth Drivers: Online retail expansion programs incorporate micro flute paper as standard material for subscription boxes and product packaging. At the same time, brand owner initiatives are increasing demand for premium presentation systems that comply with retail display standards and enhance consumer unboxing experiences.
Market Challenges: Material cost variations and converting speed limitations may limit deployment flexibility in ultra-high-volume production or extreme cost-sensitive scenarios.
Application dynamics include:
Growth Accelerators: E-commerce expansion drives primary adoption as micro flute systems provide exceptional presentation capabilities that enable product protection without excessive material weight, supporting shipping cost reduction and brand enhancement that require lightweight packaging formats. Retail innovation accelerates market growth as consumer brands seek premium packaging solutions that maintain shelf appeal during display while enhancing consumer perception through refined structural design. Consumer expectations increase worldwide, creating demand for high-quality packaging systems that complement product positioning and provide competitive advantages in brand differentiation.
Growth Inhibitors: Converting complexity challenges differ across production facilities regarding equipment capability and processing efficiency, which may limit market penetration and throughput in high-volume categories with demanding production requirements. Material cost premium persists regarding thin-wall production and specialized surface treatments that may increase total packaging costs in price-sensitive applications with tight margin specifications. Market fragmentation across multiple flute profiles and board specifications creates compatibility concerns between different converting equipment and existing printing infrastructure.
Market Evolution Patterns: Adoption accelerates in e-commerce and retail sectors where premium presentation justifies material investments, with geographic concentration in developed markets transitioning toward mainstream adoption in emerging economies driven by retail modernization and consumer goods expansion. Technology development focuses on enhanced flute uniformity, improved printing surface quality, and integration with digital printing systems that optimize brand presentation and converting efficiency. The market could face disruption if alternative lightweight materials or technology innovations significantly challenge micro flute advantages in packaging applications.
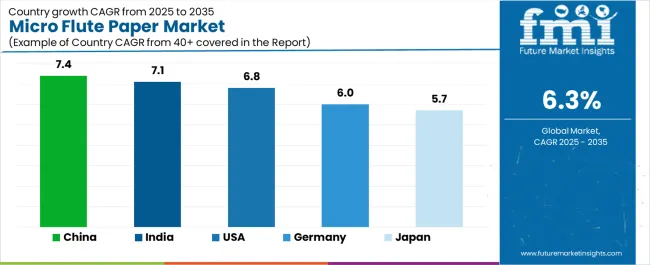
The micro flute paper market demonstrates varied regional dynamics with Growth Leaders including China (7.4% CAGR) and India (7.1% CAGR) driving expansion through e-commerce growth and retail modernization. Steady Performers encompass the USA (6.8% CAGR), Germany (6.0% CAGR), and Japan (5.7% CAGR), benefiting from established packaging sectors and premium brand adoption.
| Country | CAGR (2025-2035) |
|---|---|
| China | 7.4% |
| India | 7.1% |
| USA | 6.8% |
| Germany | 6.0% |
| Japan | 5.7% |
Regional synthesis reveals Asia-Pacific markets leading growth through e-commerce expansion and consumer goods development, while European countries maintain steady expansion supported by specialized packaging applications and luxury brand requirements. North American markets show strong growth driven by online retail and direct-to-consumer packaging applications.
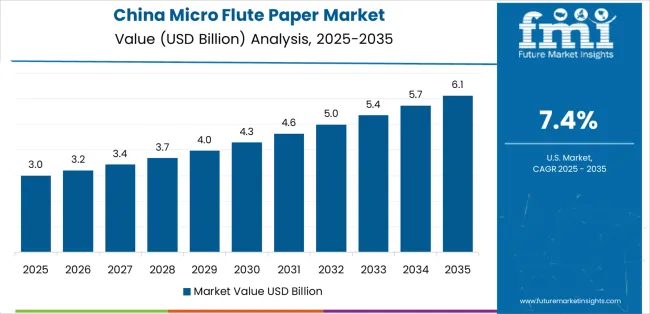
China establishes regional leadership through explosive online retail expansion and comprehensive consumer goods modernization, integrating advanced micro flute systems as standard components in e-commerce packaging and premium product applications. The country's 7.4% CAGR through 2035 reflects consumer spending growth promoting digital commerce and domestic manufacturing activity that mandate the use of lightweight packaging systems in retail operations. Growth concentrates in major e-commerce hubs, including Hangzhou, Shenzhen, and Shanghai, where logistics networks showcase integrated micro flute systems that appeal to domestic brands seeking enhanced presentation quality and international packaging standards.
Chinese manufacturers are developing innovative micro flute solutions that combine local production advantages with international printing specifications, including high-definition graphics and advanced moisture-resistant capabilities.
Strategic Market Indicators:
The Indian market emphasizes packaging applications, including rapid consumer goods development and comprehensive retail expansion that increasingly incorporates micro flute paper for product boxes and display packaging applications. The country is projected to show a 7.1% CAGR through 2035, driven by massive e-commerce activity under digital commerce initiatives and commercial demand for affordable, high-quality presentation systems. Indian packaging converters prioritize cost-effectiveness with micro flute delivering brand appeal through economical material usage and efficient printing capabilities.
Technology deployment channels include major packaging companies, consumer goods manufacturers, and online retailers that support high-volume usage for domestic and export applications.
Performance Metrics:
The USA market emphasizes advanced micro flute features, including innovative printing technologies and integration with comprehensive e-commerce platforms that manage product packaging, brand presentation, and unboxing experience applications through unified packaging systems. The country is projected to show a 6.8% CAGR through 2035, driven by online retail expansion under consumer shopping trends and commercial demand for premium, lightweight packaging systems. American brand owners prioritize consumer engagement with micro flute delivering comprehensive presentation through refined graphics and structural innovation.
Technology deployment channels include major e-commerce retailers, consumer brand companies, and specialty packaging converters that support custom development for premium operations.
Performance Metrics:
In Munich, Hamburg, and Frankfurt, German packaging converters and consumer goods manufacturers are implementing advanced micro flute systems to enhance presentation capabilities and support brand differentiation that aligns with quality protocols and retail standards. The German market demonstrates growth with a 6.0% CAGR through 2035, driven by luxury goods innovation programs and consumer brand investments that emphasize premium packaging systems for product and retail applications. German packaging facilities are prioritizing micro flute systems that provide exceptional printing quality while maintaining compliance with recycling standards and minimizing material waste, particularly important in premium product packaging and specialty retail operations.
Market expansion benefits from brand quality programs that mandate enhanced presentation in packaging specifications, creating demand across Germany's consumer goods and retail sectors, where printing excellence and structural precision represent critical requirements.
Strategic Market Indicators:
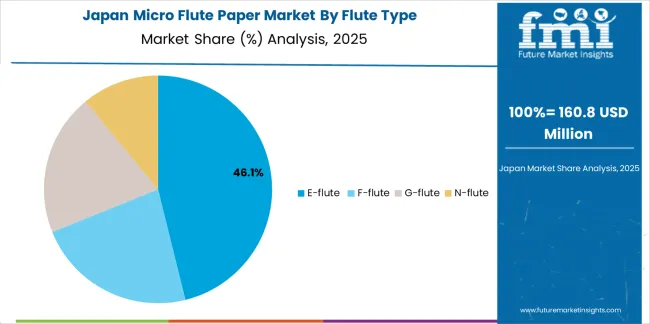
The sophisticated packaging market in Japan demonstrates meticulous micro flute deployment, growing at 5.7% CAGR, with documented operational excellence in product presentation and retail display applications through integration with existing converting systems and quality assurance infrastructure. The country leverages engineering expertise in paper manufacturing and printing precision to maintain market leadership. Packaging centers, including Tokyo, Osaka, and Nagoya, showcase advanced installations where micro flute systems integrate with comprehensive printing platforms and structural design systems to optimize brand presentation and consumer engagement.
Japanese packaging converters prioritize presentation precision and material consistency in product development, creating demand for premium micro flute systems with advanced features, including ultra-smooth surfaces and integration with offset printing protocols. The market benefits from established converting infrastructure and willingness to invest in specialized printing technologies that provide superior graphics quality and regulatory compliance.
Market Intelligence Brief:
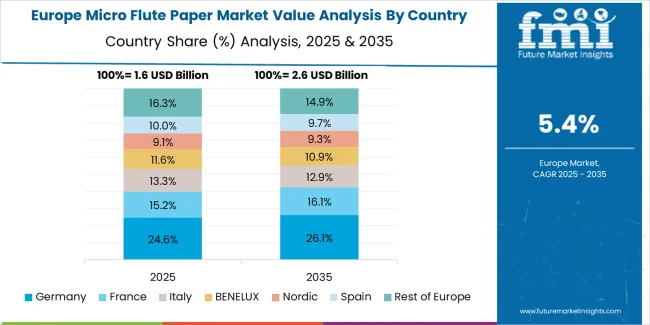
The micro flute paper market in Europe is projected to grow from USD 1,647 million in 2025 to USD 2,694 million by 2035, registering a CAGR of 5.1% over the forecast period. Germany is expected to maintain its leadership position with a 38.2% market share in 2025, declining slightly to 37.8% by 2035, supported by its packaging excellence and major converting centers, including Baden-Württemberg and North Rhine-Westphalia.
France follows with a 22.6% share in 2025, projected to reach 23.1% by 2035, driven by comprehensive luxury goods packaging and consumer brand initiatives. The United Kingdom holds a 19.4% share in 2025, expected to maintain 19.7% by 2035 through established e-commerce sectors and retail packaging adoption. Italy commands a 11.2% share, while Spain accounts for 6.8% in 2025. The Rest of Europe region is anticipated to gain momentum, expanding its collective share from 1.8% to 2.2% by 2035, attributed to increasing retail development in Eastern European countries and emerging Nordic consumer brands implementing premium packaging programs.
The micro flute paper market operates with moderate concentration, featuring approximately 22-30 participants, where leading companies control roughly 38-45% of the global market share through established converter networks and comprehensive flute profile capabilities. Competition emphasizes printing quality, structural performance, and converting efficiency rather than price-based rivalry.
Market leaders encompass International Paper, WestRock, and Smurfit Kappa Group, which maintain competitive advantages through extensive paper manufacturing expertise, global production networks, and comprehensive technical support capabilities that create converter loyalty and support application requirements. These companies leverage decades of corrugated board experience and ongoing forming technology investments to develop advanced micro flute systems with exceptional printability and structural features.
Specialty challengers include DS Smith, Mondi Group, and Cascades Inc., which compete through specialized packaging innovation focus and efficient converting solutions that appeal to brand owners seeking premium presentation formats and custom structural flexibility. These companies differentiate through design engineering emphasis and specialized application focus.
Market dynamics favor participants that combine reliable printing performance with advanced converting support, including die-cutting precision and lamination capabilities. Competitive pressure intensifies as traditional corrugated manufacturers expand into micro flute systems. At the same time, specialized packaging converters challenge established players through innovative surface treatments and cost-effective production targeting emerging e-commerce segments.
| Item | Value |
|---|---|
| Quantitative Units | USD 6.2 billion |
| Flute Type | E-flute, F-flute, G-flute, N-flute |
| Application | Packaging, Retail Display, Food & Beverage, Electronics, Cosmetics, Others |
| Regions Covered | North America, Europe, Asia Pacific, Latin America, Middle East & Africa |
| Countries Covered | USA, Germany, Japan, China, India, and 25+ additional countries |
| Key Companies Profiled | International Paper, WestRock, Smurfit Kappa Group, DS Smith, Mondi Group, Cascades Inc. |
| Additional Attributes | Dollar sales by flute type and application categories, regional adoption trends across North America, Europe, and Asia-Pacific, competitive landscape with paper manufacturers and packaging converters, brand owner preferences for printing quality and structural efficiency, integration with converting equipment and printing systems, innovations in flute forming technology and surface treatments, and development of specialized lightweight solutions with enhanced graphics capabilities and space-saving features |
The global micro flute paper market is estimated to be valued at USD 6.2 billion in 2025.
The market size for the micro flute paper market is projected to reach USD 11.5 billion by 2035.
The micro flute paper market is expected to grow at a 6.3% CAGR between 2025 and 2035.
The key product types in micro flute paper market are e-flute , f-flute, g-flute and n-flute.
In terms of application, packaging segment to command 52.0% share in the micro flute paper market in 2025.


Full Research Suite comprises of:
Market outlook & trends analysis
Interviews & case studies
Strategic recommendations
Vendor profiles & capabilities analysis
5-year forecasts
8 regions and 60+ country-level data splits
Market segment data splits
12 months of continuous data updates
DELIVERED AS:
PDF EXCEL ONLINE
Market Share Breakdown of Micro Flute Paper Manufacturers
USA Micro Flute Paper Market Report – Trends, Demand & Industry Outlook 2025-2035
ASEAN Micro Flute Paper Market Insights – Trends, Demand & Forecast 2025-2035
Japan Micro Flute Paper Market Analysis – Size, Share & Industry Trends 2025-2035
Germany Micro Flute Paper Market Trends – Demand, Innovations & Forecast 2025-2035
Micro-Dosing Sachet Fillers Market Analysis - Size and Share Forecast Outlook 2025 to 2035
Microbial Growth Monitoring System Market Size and Share Forecast Outlook 2025 to 2035
Micro Hotel Market Forecast and Outlook 2025 to 2035
Microwave Source Market Size and Share Forecast Outlook 2025 to 2035
Micro-energy Harvesting System Market Size and Share Forecast Outlook 2025 to 2035
Micro CHP Market Size and Share Forecast Outlook 2025 to 2035
Micro Irrigation System Market Size and Share Forecast Outlook 2025 to 2035
Microcrystalline Cellulose Market Size and Share Forecast Outlook 2025 to 2035
Micro Balances Market Size and Share Forecast Outlook 2025 to 2035
Micro Perforated Films Packaging Market Size and Share Forecast Outlook 2025 to 2035
Microbial Coagulants Market Size and Share Forecast Outlook 2025 to 2035
Microserver IC Market Size and Share Forecast Outlook 2025 to 2035
Microplate Handling Instruments Market Size and Share Forecast Outlook 2025 to 2035
Microsclerotherapy Treatment Market Size and Share Forecast Outlook 2025 to 2035
MicroLED Photoluminescence Inspection System Market Size and Share Forecast Outlook 2025 to 2035

Thank you!
You will receive an email from our Business Development Manager. Please be sure to check your SPAM/JUNK folder too.
Chat With
MaRIA