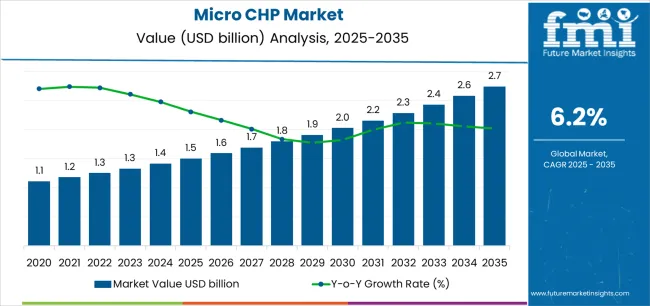
The global micro CHP market is valued at USD 1.5 billion in 2025. It is slated to reach USD 2.7 billion by 2035, recording an absolute increase of USD 1.2 billion over the forecast period. This translates into a total growth of 80.0%, with the market forecast to expand at a compound annual growth rate (CAGR) of 6.2% between 2025 and 2035. The overall market size is expected to grow by nearly 1.80X during the same period, supported by increasing building energy efficiency mandates and decarbonization policies, growing adoption of hydrogen-ready and biomethane-compatible systems, expanding residential resilience and energy security requirements, and rising emphasis on distributed generation and grid independence across diverse residential, small commercial, institutional, and light industrial building applications.
Between 2025 and 2030, the micro CHP market is projected to expand from USD 1.5 billion to USD 2.0 billion, resulting in a value increase of USD 0.5 billion, which represents 41.7% of the total forecast growth for the decade. This phase of development will be shaped by increasing building decarbonization initiatives and net-zero carbon targets, rising adoption of fuel cell micro CHP systems with higher electrical efficiency, and growing demand for hydrogen-ready systems supporting energy transition pathways. Building owners and facility managers are expanding their micro CHP deployment capabilities to address the growing need for efficient combined heat and power generation that ensures energy cost reduction and carbon footprint minimization.
Quality control personnel encounter ongoing tensions between achieving optimal fuel conversion efficiency and accommodating varying natural gas quality specifications, particularly when facilities must integrate micro CHP systems with existing heating infrastructure and electrical panels within space-constrained installations. Cross-functional difficulties emerge when electrical engineers specify grid-tie inverter requirements while mechanical teams prioritize heat exchanger designs that minimize maintenance intervals during continuous operation cycles.
Supply chain coordination becomes difficult when micro CHP projects require integration of prime movers, heat recovery systems, and electrical controls from multiple manufacturers with varying warranty terms and service network availability. International installations encounter additional complications when systems must comply with local gas safety codes while meeting electrical standards that may differ significantly from equipment certification requirements.
Maintenance scheduling becomes complex when micro CHP systems require specialized technician training and diagnostic equipment while operating in distributed locations where service response times may affect system availability. Service coordination challenges multiply when systems integrate multiple technologies requiring different expertise levels and certification requirements for electrical, mechanical, and controls maintenance procedures.
| Metric | Value |
|---|---|
| Estimated Value in (2025E) | USD 1.5 billion |
| Forecast Value in (2035F) | USD 2.7 billion |
| Forecast CAGR (2025 to 2035) | 6.2% |
From 2030 to 2035, the market is forecast to grow from USD 2.0 billion to USD 2.7 billion, adding another USD 0.7 billion, which constitutes 58.3% of the overall ten-year expansion. This period is expected to be characterized by the expansion of hydrogen blending and pure hydrogen operation capabilities, the development of smart grid integration and vehicle-to-home connectivity, and the growth of biomethane utilization and renewable gas infrastructure supporting sustainable distributed generation. The growing adoption of digital monitoring platforms and predictive maintenance algorithms will drive demand for micro CHP systems with enhanced connectivity and autonomous optimization features.
Between 2020 and 2025, the micro CHP market experienced steady growth, driven by increasing building energy efficiency requirements and growing recognition of combined heat and power systems as essential technologies for reducing energy costs and carbon emissions in diverse residential, commercial, and institutional building applications. The market developed as building owners and energy consultants recognized the potential for micro CHP technology to improve overall energy efficiency, provide on-site power generation, and support sustainability objectives while meeting heating requirements. Technological advancement in fuel cell efficiency and compact system design began emphasizing the critical importance of maintaining high electrical efficiency and reliability in small-scale distributed generation applications.
Market expansion is being supported by the increasing global emphasis on building decarbonization and energy efficiency driven by climate policies and rising energy costs, alongside the corresponding need for distributed generation technologies that can enhance energy security, enable waste heat utilization, and maintain cost-effectiveness across various residential homes, small commercial buildings, institutional facilities, and light industrial applications. Modern building owners and facility managers are increasingly focused on implementing micro CHP solutions that can reduce grid dependence, lower energy bills, and provide reliable heat and power in demanding operational scenarios.
The growing emphasis on energy resilience and grid independence is driving demand for micro CHP systems that can support emergency backup power, enable off-grid capability, and ensure comprehensive energy security during utility disruptions. Building owners' preference for cogeneration technologies that combine energy efficiency with fuel flexibility and emissions reduction is creating opportunities for innovative micro CHP implementations. The rising influence of hydrogen economy roadmaps and renewable gas development is also contributing to increased adoption of micro CHP systems that can provide superior performance without compromising fuel transition compatibility or long-term sustainability.
The market is segmented by capacity, fuel, prime mover, end-use, and region. By capacity, the market is divided into <2 kW, 2-10 kW, and 10-50 kW. Based on fuel, the market is categorized into natural gas & LPG, renewable gases (biomethane/hydrogen blends), oil, coal, and other fuels. By prime mover, the market includes fuel cell-based, internal combustion engine-based, Stirling engine-based, and other prime movers. Based on end-use, the market comprises residential, small commercial, public/institutional buildings, and light industrial. Regionally, the market is divided into North America, Asia Pacific, Europe, Latin America, and Middle East & Africa.
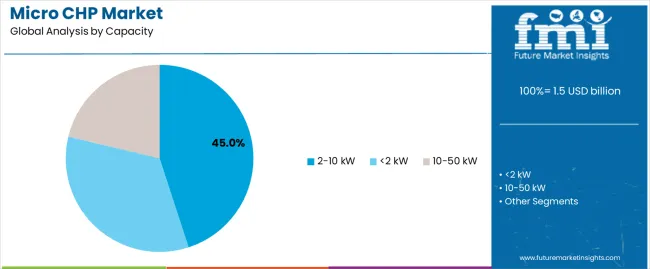
The 2-10 kW capacity segment is projected to maintain its leading position in the micro CHP market in 2025 with a 45.0% market share, reaffirming its role as the preferred capacity range for single-family homes, small multi-family buildings, and small commercial applications. Building owners and facility managers increasingly utilize 2-10 kW micro CHP systems for their optimal balance characteristics, excellent sizing for typical residential heat loads, and proven effectiveness in providing simultaneous heat and power generation while maintaining economic viability. The 2-10 kW capacity range's proven effectiveness and application versatility directly address the building sector requirements for right-sized cogeneration and cost-effective distributed generation across diverse residential and small commercial building types.
This capacity segment forms the foundation of residential micro CHP deployment, as it represents the technology with the greatest market penetration and established performance record across typical home heating and small business applications. Building sector investments in distributed generation technologies continue to strengthen adoption among homeowners and small business operators. With energy cost pressures requiring enhanced efficiency and improved self-consumption, 2-10 kW micro CHP systems align with both economic objectives and sustainability requirements, making them the central component of comprehensive building energy strategies.
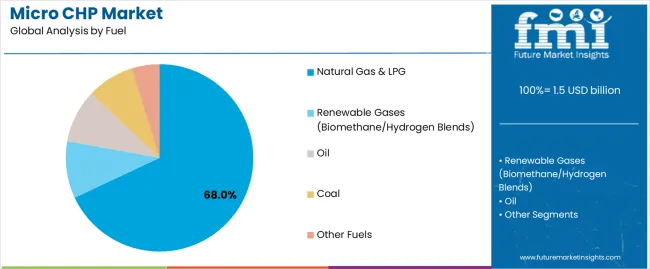
The natural gas & LPG fuel segment is projected to represent the largest share of micro CHP fuel demand in 2025 with a 68.0% market share, underscoring its critical role as the primary energy source for micro CHP deployment across regions with established gas infrastructure. Building owners prefer natural gas and LPG for micro CHP operation due to their widespread availability characteristics, established distribution infrastructure, and proven compatibility with diverse prime mover technologies while ensuring operational reliability and predictable fuel costs. Positioned as the dominant energy source for distributed cogeneration, natural gas and LPG offer both fuel accessibility advantages and system compatibility benefits.
The segment is supported by continuous gas infrastructure expansion and the growing availability of hydrogen-ready systems that enable future fuel transition with enhanced sustainability potential while maintaining natural gas operation compatibility. Additionally, building owners are investing in micro CHP programs to support increasingly demanding energy efficiency requirements and carbon reduction targets. As renewable gas infrastructure develops and hydrogen blending increases, the natural gas & LPG segment will continue to dominate the market while supporting energy transition pathways and future fuel flexibility.
The residential end-use segment is projected to maintain the leading position with a 56.0% market share in 2025, driven by extensive single-family home applications, government incentive programs, and homeowner interest in energy cost reduction and grid independence. Residential micro CHP systems provide simultaneous heating and electricity generation optimized for typical home energy consumption patterns, offering attractive economic returns in regions with favorable gas prices and electricity rates.
Small commercial applications represent 28.0% of the market, encompassing retail establishments, restaurants, small office buildings, and service businesses requiring reliable heat and power generation. Public/institutional buildings account for 9.0%, serving schools, healthcare facilities, government buildings, and community centers with stable heat loads. Light industrial holds 7.0%, encompassing small manufacturing facilities, workshops, and industrial operations requiring process heat and on-site power generation supporting operational efficiency and cost reduction.
The micro CHP market is advancing steadily due to increasing demand for building energy efficiency and carbon reduction driven by climate policies and growing adoption of fuel cell technologies that require distributed generation platforms providing enhanced electrical efficiency and low emissions across diverse residential, commercial, institutional, and industrial building applications. However, the market faces challenges, including high initial capital costs limiting residential adoption, complexity of installation requiring gas and electrical connections, and payback period sensitivity to energy price relationships between gas and electricity. Innovation in hydrogen-ready systems and smart grid integration continues to influence product development and market expansion patterns.
The growing development of hydrogen production and distribution infrastructure combined with biomethane availability is driving demand for fuel-flexible micro CHP systems that address critical energy transition requirements including hydrogen blending capability, biomethane compatibility, and future-proof operation supporting decarbonization pathways. Building owners face increasing pressure to reduce carbon emissions while maintaining energy reliability and economic viability as gas networks evolve toward renewable and low-carbon gas supplies. Equipment manufacturers and energy policy makers are increasingly recognizing the essential role of hydrogen-ready micro CHP for enabling building sector decarbonization while leveraging existing gas infrastructure, creating opportunities for adaptable systems specifically designed for progressive fuel transition scenarios and renewable gas utilization.
Modern micro CHP system manufacturers are incorporating smart grid communication protocols and demand response capabilities to enhance grid services, enable virtual power plant aggregation, and support comprehensive energy system optimization through coordinated dispatch and automated control. Leading companies are developing internet-connected micro CHP platforms with remote monitoring, implementing predictive maintenance algorithms for component life optimization, and advancing technologies that enable participation in grid balancing and ancillary service markets. These technologies improve system value proposition while enabling new revenue opportunities, including capacity payments, frequency response services, and peer-to-peer energy trading. Advanced grid integration also allows building owners to support comprehensive energy system flexibility and distributed energy resource optimization beyond traditional standalone cogeneration operation.
The expansion of fuel cell manufacturing scale, technology maturation, and supply chain development is driving demand for high-efficiency fuel cell micro CHP systems with reduced capital costs, extended operational lifetimes, and enhanced performance characteristics that improve economic viability. These advanced fuel cell systems incorporate improved catalyst formulations, extended stack durability, and manufacturing automation that reduce system costs while enhancing performance, creating expanding market segments with improved value propositions. Manufacturers are investing in production capacity expansion and supply chain optimization to serve growing residential and commercial markets while supporting mass market adoption and economic competitiveness throughout diverse building applications and geographic regions.
| Country | CAGR (2025-2035) |
|---|---|
| United States | 6.5% |
| South Korea | 6.4% |
| Japan | 6.2% |
| United Kingdom | 6.1% |
| Germany | 5.8% |
| Italy | 5.6% |
| Netherlands | 5.5% |
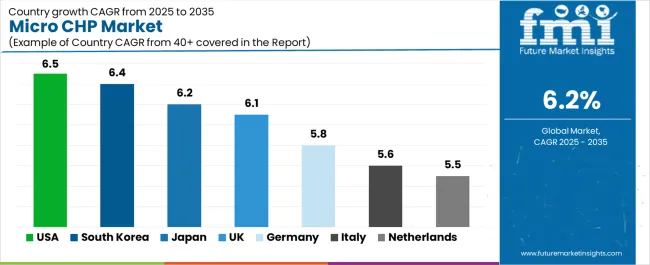
The micro CHP market is experiencing solid growth globally, with the United States leading at a 6.5% CAGR through 2035, driven by residential resilience upgrades, favorable natural gas infrastructure, and pilot fuel cell programs supporting distributed generation adoption. South Korea follows at 6.4%, supported by hydrogen economy roadmap implementation, smart city deployment initiatives, and comprehensive fuel cell CHP incentive programs. Japan shows growth at 6.2%, emphasizing ENE-FARM program continuity, compact residential unit development, and hydrogen blending pilot projects. The United Kingdom demonstrates 6.1% growth, supported by boiler replacement schemes, hydrogen-ready system trials, and multifamily building retrofit programs. Germany records 5.8%, focusing on energy efficiency mandates, municipal and SME cogeneration, and biomethane adoption initiatives. Italy exhibits 5.6% growth, emphasizing retail and HORECA (hotel/restaurant/cafe) small-CHP uptake alongside tax credits for building efficiency improvements. The Netherlands shows 5.5% growth, supported by gas-to-green energy transition and district-level micro CHP pilots incorporating hydrogen blends.
The report covers an in-depth analysis of 40+ countries; seven top-performing countries are highlighted below.
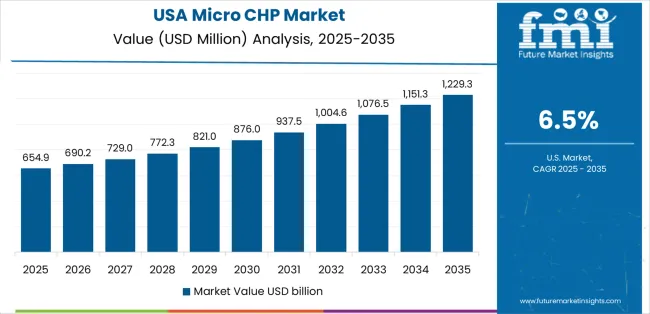
Revenue from micro CHP systems in the United States is projected to exhibit exceptional growth with a CAGR of 6.5% through 2035, driven by residential energy resilience upgrade programs and extensive natural gas infrastructure supporting distributed generation deployment alongside pilot fuel cell programs demonstrating technology viability. The country's mature gas distribution network and increasing focus on energy security are creating substantial demand for micro CHP solutions. Major equipment manufacturers and energy service providers are establishing comprehensive deployment and maintenance capabilities to serve both residential and commercial markets.
Revenue from micro CHP systems in South Korea is expanding at a CAGR of 6.4%, supported by the country's comprehensive hydrogen economy roadmap, extensive smart city deployment programs, and substantial fuel cell CHP incentive schemes driven by government energy transition objectives and technology leadership ambitions. The country's commitment to hydrogen economy development and urban innovation are driving sophisticated micro CHP capabilities throughout residential and commercial sectors. Leading fuel cell manufacturers and building equipment companies are establishing extensive production and deployment facilities to address growing domestic demand.
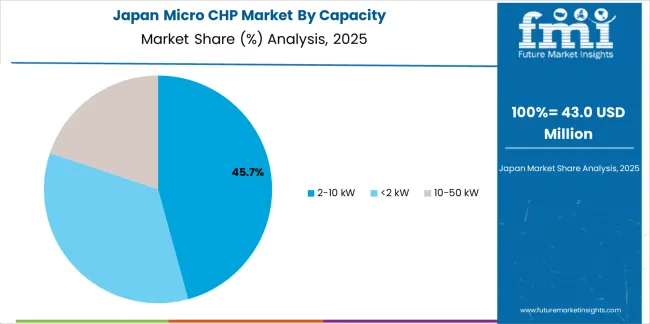
Revenue from micro CHP systems in Japan is expanding at a CAGR of 6.2%, supported by the country's long-running ENE-FARM residential fuel cell program, continuous development of compact high-efficiency units, and comprehensive hydrogen blending pilot initiatives supporting energy system transformation. Japan's technology leadership and sustained policy support are driving advanced micro CHP capabilities throughout residential sectors. Leading manufacturers including Panasonic and AISIN are investing extensively in fuel cell system development and cost reduction.
Revenue from micro CHP systems in the United Kingdom is expanding at a CAGR of 6.1%, supported by the country's boiler replacement incentive schemes, extensive hydrogen-ready system field trials, and multifamily building retrofit programs addressing building decarbonization objectives. The UK's comprehensive heat decarbonization policies and hydrogen strategy are driving demand for future-proof micro CHP technologies. Building owners and social housing providers are investing in micro CHP systems addressing efficiency and emissions reduction requirements.
Revenue from micro CHP systems in Germany is expanding at a CAGR of 5.8%, driven by the country's stringent energy efficiency mandates, comprehensive municipal and small-to-medium enterprise cogeneration programs, and growing biomethane utilization supporting renewable energy integration. Germany's engineering excellence and sustainability leadership are driving sophisticated micro CHP capabilities throughout building sectors. Leading heating equipment manufacturers and energy service companies are establishing comprehensive cogeneration programs for diverse building applications.
Revenue from micro CHP systems in Italy is expanding at a CAGR of 5.6%, supported by the country's retail and HORECA (hotel/restaurant/cafe) sector adoption, comprehensive tax credit programs for building efficiency improvements, and small commercial building modernization supporting operational cost reduction. Italy's commercial building sector and fiscal incentive framework are driving demand for distributed generation technologies. Small business owners and commercial property operators are investing in micro CHP systems addressing energy cost management.
Revenue from micro CHP systems in the Netherlands is expanding at a CAGR of 5.5%, supported by the country's comprehensive gas-to-green energy transition strategy, district-level micro CHP pilot programs, and hydrogen blending demonstrations in gas distribution networks. The Netherlands' progressive energy policies and hydrogen infrastructure development are driving demand for transitional micro CHP technologies. Utilities and district energy operators are investing in micro CHP systems supporting near-term efficiency while enabling future hydrogen operation.

The micro CHP market in Europe is projected to grow from USD 0.7 billion in 2025 to USD 1.2 billion by 2035, registering a CAGR of 5.7% over the forecast period. Germany is expected to lead with approximately 22.0% of the regional value in 2025, supported by energy efficiency mandates, municipal cogeneration programs, and biomethane utilization across residential and SME building applications.
The United Kingdom follows with 18.0% in 2025, driven by boiler replacement schemes, hydrogen-ready system trials, and multifamily retrofit initiatives. France accounts for 16.0%, supported by building renovation programs and distributed generation promotion. Italy holds 13.0%, driven by retail and HORECA sector adoption and tax credit incentives. The Netherlands represents 9.0%, supported by gas transition strategies and hydrogen blending pilots. Spain accounts for 8.0%, driven by small commercial applications and building efficiency programs. The Nordics and Rest of Europe collectively represent 14.0%, reflecting steady adoption throughout Scandinavia, Central and Eastern Europe, and other markets with growing emphasis on decarbonization mandates, hydrogen-ready appliance pilots, subsidies for high-efficiency heat and power system replacements in residential and SME buildings, and comprehensive energy transition programs supporting distributed generation and renewable gas integration across the broader European building stock.
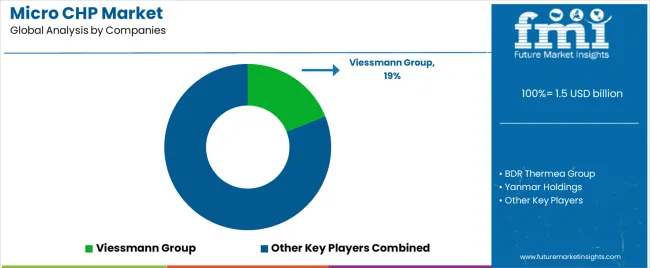
The micro CHP market is characterized by competition among established heating equipment manufacturers, diversified energy system companies, and specialized fuel cell technology providers. Companies are investing in hydrogen-ready system development, fuel cell cost reduction, smart grid integration capabilities, and compact system design to deliver efficient, reliable, and future-proof micro CHP solutions. Innovation in high-temperature fuel cell technologies, biomethane compatibility, and predictive maintenance platforms is central to strengthening market position and competitive advantage.
Viessmann Group leads the market with a 19.0% share, offering comprehensive micro CHP solutions with a focus on gas-fired systems, fuel cell technologies, and integrated heating platforms across diverse residential, commercial, and institutional building applications. The company introduced hydrogen-ready micro CHP variants in Europe in 2024 to future-proof residential installations and support progressive fuel transition scenarios. BDR Thermea Group provides innovative heating and hot water solutions with emphasis on hydrogen compatibility and sustainable technologies. The company expanded hydrogen-ready boiler and micro CHP field trials in the United Kingdom and Netherlands in 2024 to validate blended fuel operation and demonstrate system reliability.
Yanmar Holdings delivers comprehensive energy systems with focus on gas engine technologies and distributed generation solutions. The company released next-generation 5-10 kW gas micro CHP packages in 2025 with higher electrical efficiency specifically designed for small commercial site applications. AISIN Corporation offers advanced automotive and energy systems including residential fuel cell products. Panasonic Corporation specializes in fuel cell technologies through its ENE-FARM residential systems serving the Japanese market. Vaillant Group provides heating and ventilation equipment with comprehensive micro CHP offerings. Bosch Thermotechnology focuses on building climate solutions and distributed energy systems. Ceres Power emphasizes solid oxide fuel cell technology development for distributed generation. SolidPower specializes in compact fuel cell systems for residential applications. Qnergy offers Stirling engine-based micro CHP systems for diverse applications.
Micro CHP systems represent a critical distributed generation technology segment within residential, commercial, and institutional building applications, projected to grow from USD 1.5 billion in 2025 to USD 2.7 billion by 2035 at a 6.2% CAGR. These combined heat and power systems-encompassing fuel cell, internal combustion engine, and Stirling engine configurations for diverse capacity ranges-serve as essential building energy technologies in space heating, domestic hot water, on-site electricity generation, and energy resilience where efficiency improvement, carbon reduction, and grid independence are essential. Market expansion is driven by increasing building decarbonization mandates, growing hydrogen-ready and fuel-flexible system availability, expanding residential energy security requirements, and rising emphasis on distributed generation and waste heat utilization across diverse building and facility types.
How Energy Regulators Could Strengthen Efficiency Standards and Fuel Transition Support?
How Industry Associations Could Advance Technical Standards and Market Development?
How Micro CHP Manufacturers Could Drive Innovation and Market Leadership?
How Building Owners Could Optimize Micro CHP Performance and Economics?
How Research Institutions Could Enable Technology Advancement?
How Investors and Financial Enablers Could Support Market Growth and Innovation?
| Items | Values |
|---|---|
| Quantitative Units (2025) | USD 1.5 billion |
| Capacity | <2 kW, 2-10 kW, 10-50 kW |
| Fuel | Natural Gas & LPG, Renewable Gases (Biomethane/Hydrogen Blends), Oil, Coal, Other Fuels |
| Prime Mover | Fuel Cell-based, Internal Combustion Engine-based, Stirling Engine-based, Other Prime Movers |
| End-Use | Residential, Small Commercial, Public/Institutional Buildings, Light Industrial |
| Regions Covered | North America, Asia Pacific, Europe, Latin America, Middle East & Africa |
| Countries Covered | United States, South Korea, Japan, United Kingdom, Germany, Italy, Netherlands, and 40+ countries |
| Key Companies Profiled | Viessmann Group, BDR Thermea Group, Yanmar Holdings, AISIN Corporation, Panasonic Corporation, Vaillant Group, Bosch Thermotechnology, Ceres Power, SolidPower, Qnergy |
| Additional Attributes | Dollar sales by capacity, fuel type, prime mover, and end-use categories, regional demand trends, competitive landscape, technological advancements in hydrogen-ready systems, fuel cell efficiency, smart grid integration, and biomethane compatibility |
The global micro chp market is estimated to be valued at USD 1.5 billion in 2025.
The market size for the micro chp market is projected to reach USD 2.7 billion by 2035.
The micro chp market is expected to grow at a 6.2% CAGR between 2025 and 2035.
The key product types in micro chp market are 2-10 kw, <2 kw and 10-50 kw.
In terms of fuel, natural gas & lpg segment to command 68.0% share in the micro chp market in 2025.


Our Research Products

The "Full Research Suite" delivers actionable market intel, deep dives on markets or technologies, so clients act faster, cut risk, and unlock growth.

The Leaderboard benchmarks and ranks top vendors, classifying them as Established Leaders, Leading Challengers, or Disruptors & Challengers.

Locates where complements amplify value and substitutes erode it, forecasting net impact by horizon

We deliver granular, decision-grade intel: market sizing, 5-year forecasts, pricing, adoption, usage, revenue, and operational KPIs—plus competitor tracking, regulation, and value chains—across 60 countries broadly.

Spot the shifts before they hit your P&L. We track inflection points, adoption curves, pricing moves, and ecosystem plays to show where demand is heading, why it is changing, and what to do next across high-growth markets and disruptive tech

Real-time reads of user behavior. We track shifting priorities, perceptions of today’s and next-gen services, and provider experience, then pace how fast tech moves from trial to adoption, blending buyer, consumer, and channel inputs with social signals (#WhySwitch, #UX).

Partner with our analyst team to build a custom report designed around your business priorities. From analysing market trends to assessing competitors or crafting bespoke datasets, we tailor insights to your needs.
Supplier Intelligence
Discovery & Profiling
Capacity & Footprint
Performance & Risk
Compliance & Governance
Commercial Readiness
Who Supplies Whom
Scorecards & Shortlists
Playbooks & Docs
Category Intelligence
Definition & Scope
Demand & Use Cases
Cost Drivers
Market Structure
Supply Chain Map
Trade & Policy
Operating Norms
Deliverables
Buyer Intelligence
Account Basics
Spend & Scope
Procurement Model
Vendor Requirements
Terms & Policies
Entry Strategy
Pain Points & Triggers
Outputs
Pricing Analysis
Benchmarks
Trends
Should-Cost
Indexation
Landed Cost
Commercial Terms
Deliverables
Brand Analysis
Positioning & Value Prop
Share & Presence
Customer Evidence
Go-to-Market
Digital & Reputation
Compliance & Trust
KPIs & Gaps
Outputs
Full Research Suite comprises of:
Market outlook & trends analysis
Interviews & case studies
Strategic recommendations
Vendor profiles & capabilities analysis
5-year forecasts
8 regions and 60+ country-level data splits
Market segment data splits
12 months of continuous data updates
DELIVERED AS:
PDF EXCEL ONLINE
Netherlands Micro CHP Market Insights – Size, Trends & Forecast 2025-2035
Micro-Vent Cap Systems Market Analysis - Size and Share Forecast Outlook 2025 to 2035
Microfilm Readers and Scanners Market Size and Share Forecast Outlook 2025 to 2035
Micron CBN Powder Market Size and Share Forecast Outlook 2025 to 2035
Microfilm Reader Market Size and Share Forecast Outlook 2025 to 2035
Micro-Dosing Sachet Fillers Market Analysis - Size and Share Forecast Outlook 2025 to 2035
Microbial Growth Monitoring System Market Size and Share Forecast Outlook 2025 to 2035
Micro Hotel Market Forecast and Outlook 2025 to 2035
Microwave Source Market Size and Share Forecast Outlook 2025 to 2035
Micro-energy Harvesting System Market Size and Share Forecast Outlook 2025 to 2035
Micro Irrigation System Market Size and Share Forecast Outlook 2025 to 2035
Micro Flute Paper Market Size and Share Forecast Outlook 2025 to 2035
Microcrystalline Cellulose Market Size and Share Forecast Outlook 2025 to 2035
Micro Balances Market Size and Share Forecast Outlook 2025 to 2035
Micro Perforated Films Packaging Market Size and Share Forecast Outlook 2025 to 2035
Microbial Coagulants Market Size and Share Forecast Outlook 2025 to 2035
Microserver IC Market Size and Share Forecast Outlook 2025 to 2035
Microplate Handling Instruments Market Size and Share Forecast Outlook 2025 to 2035
Microsclerotherapy Treatment Market Size and Share Forecast Outlook 2025 to 2035
MicroLED Photoluminescence Inspection System Market Size and Share Forecast Outlook 2025 to 2035

Thank you!
You will receive an email from our Business Development Manager. Please be sure to check your SPAM/JUNK folder too.
Chat With
MaRIA