Reports
- Global Locations -
Headquarters
Future Market Insights, Inc.
Christiana Corporate, 200
Continental Drive, Suite 401,
Newark, Delaware - 19713,
United States
Americas
Future Market Insights, Inc.
616 Corporate Way, Suite 2-9018,
Valley Cottage, NY 10989, United States
MEA
Future Market Insights
1602-6 Jumeirah Bay X2 Tower, Plot No: JLT-PH2-X2A,
Jumeirah Lakes Towers, Dubai,
United Arab Emirates
Europe
Future Market Insights
3rd Floor, 207 Regent Street,
W1B 3HH London
United Kingdom
Asia Pacific
Future Market Insights
Office No. 401-A, 4th Floor,
VANTAGE 9, S.No. 36/1/1,
Baner, Pune 411045, India
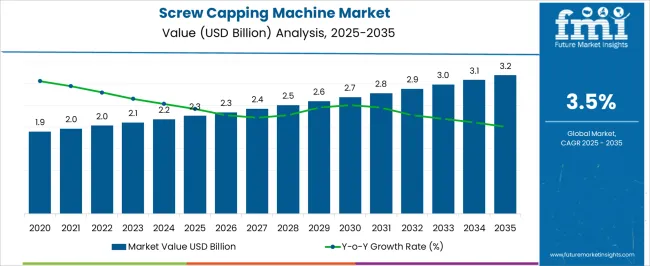
The global screw capping machine market size is projected to be worth US$ 2.1 billion in 2023. The market is likely to surpass US$ 3.0 billion by 2033. It is anticipated to expand at a CAGR of 3.7% during the forecast period.
Widespread adoption of automation in manufacturing processes has led to an increased preference for screw capping machines. These machines offer high-speed and efficient sealing capabilities, enabling manufacturers to optimize their production lines and meet growing market requirements.
Emphasis on product quality and safety across various sectors has propelled the demand for screw capping machines. These machines provide a reliable sealing solution that ensures the integrity and freshness of packaged products.
They help in reducing the risk of contamination and extending shelf life. This is particularly crucial in sectors such as food & beverage, pharmaceuticals, and cosmetics, where product integrity is paramount.
Tightening regulations and standards related to product packaging & safety are set to drive adoption of screw capping machines. These machines would help manufacturers comply with industry-specific regulations such as tamper-evident packaging requirements and child-resistant closures.
Expansion of the food & beverage, pharmaceutical, and personal care sectors in emerging markets has created a greater need for efficient packaging solutions. Screw capping machines offer a reliable and scalable solution to meet the increasing demands of these expanding markets.
Screw capping machines enable the production of consumer-friendly packaging formats such as resealable containers and easy-to-open caps. As consumer preferences continue to evolve, manufacturers are investing in screw capping machines to meet the high demand for convenient and user-friendly packaging solutions.
A few other factors influencing screw capping machine sales:
Attributes | Key Insights |
---|---|
Screw Capping Machine Market Estimated Size (2023E) | US$ 2.1 billion |
Projected Market Valuation (2033F) | US$ 3.0 billion |
Value-based CAGR (2023 to 2033) | 3.7% |
Don't pay for what you don't need
Customize your report by selecting specific countries or regions and save 30%!
The global screw capping machine industry has seen steady growth in terms of demand over the past decade. The primary factor driving growth is increased adoption of automation in various sectors, including pharmaceuticals, food & beverage, and cosmetics.
Screw capping machine is a critical component in the packaging process as it allows for fast and accurate capping of products, resulting in improved productivity and reduced labor costs. Asia Pacific has emerged as the dominant market for screw capping machines.
It is set to be driven by growth of the food & beverage and pharmaceutical sectors in countries such as China, India, and Japan. North America and Europe are also significant markets for screw capping machines. It is attributed to high demand for automation and advanced packaging technologies in these regions.
Increasing demand for convenience foods and growing preference for bottled beverages have further propelled growth in the market. The global market is estimated to witness a CAGR of 3.7% between 2023 and 2033.
Changing lifestyle of the masses, combined with a growing middle-class population would help the market to expand. Increased expenditure on food & beverage goods and soaring household consumption are further expected to fuel screw capping machine industry expansion.
Screw Capping Machine Market
Attributes | Screw Capping Machine Market |
---|---|
CAGR (2023 to 2033) | 3.7% |
Market Value (2033) | US$ 3.0 billion |
Opportunity | By utilizing screw capping machines, businesses can reduce labor costs associated with manual capping. |
Key Trends | Ability to accommodate diverse packaging requirements contributes to the increased demand for screw capping machines. |
Bottles Market:
Attributes | Bottles Market |
---|---|
CAGR (2023 to 2033) | 5.2% |
Market Value (2033) | US$ 188.7 billion |
Opportunity | Development of eco-friendly bottle options such as those made from recycled materials or biodegradable alternatives would aid sales. |
Key Trends | Busy lifestyles, on-the-go consumption habits, and convenience-oriented preferences have increased the consumption of bottled beverages, which would propel demand. |
Food Trays Market:
Attributes | Food Trays Market |
---|---|
CAGR (2023 to 2033) | 5.7% |
Market Value (2033) | US$ 17.48 billion |
Opportunity | Food trays would offer opportunities for branding and customization, making them attractive to numerous businesses. |
Key Trends | Growth of food delivery platforms and takeout services in developed and developing nations has contributed to the increased demand for food trays. |
Automation is increasingly becoming popular in the packaging sector, and screw capping machines play an essential role in this sector. These machines offer high-speed and efficient capping operations, reducing the need for manual labor and improving production efficiency.
Screw capping machines offer flexibility in the manufacturing process, allowing manufacturers to change capping configurations quickly. Growing trend toward sustainable packaging has led to rising demand for screw capping machines. These machines can cap various materials, including glass, plastic, and aluminum, which are commonly used in sustainable packaging.
With high demand for beverages, including soft drinks, water, and alcoholic beverages, there has been a corresponding increase in demand for screw capping machines. It is further anticipated to drive the global market.
Get the data you need at a Fraction of the cost
Personalize your report by choosing insights you need
and save 40%!
PET bottles are becoming increasingly popular due to their lightweight, shatterproof, and recyclable nature. Screw capping machines are essential for capping PET bottles. With rising popularity of these bottles, screw capping machine demand is set to surge.
Screw capping machines are constantly evolving with new technologies being introduced to improve their efficiency and performance. There have been several technological advancements in screw capping machines in recent years, including improvements in speed, accuracy, and reliability.
Consumers are increasingly looking for unique and personalized packaging solutions. It has resulted in an increasing demand for customized screw capping machines.
Screw capping machines are becoming more advanced, with manufacturers incorporating new technologies such as vision systems, robotics, and artificial intelligence. Need for sustainable packaging solutions are driving demand for eco-friendly screw capping machines. They can help reduce both waste and energy consumption.
Magnetic capping technology is a new advancement in the screw capping machine market. It uses magnetic fields to attach caps to bottles, eliminating the need for mechanical pressure. It also offers higher precision, faster capping speeds, and improved sealing performance.
Artificial intelligence (AI) is being used in screw capping machines to improve performance and efficiency. AI algorithms can optimize capping speeds, reduce downtime, and detect and correct errors in real-time. It is set to push screw capping machine sales by 2033.
Need for Renewable Materials to Spur Demand for Bottle Capping Machines in the United States
Country | The United States |
---|---|
Estimated Market Size (2033) | US$ 612.4 million |
Value-based CAGR (2023 to 2033) | 2.8% |
The United States screw capping machine market is set to witness steady growth in the assessment period. It is due to growing emphasis on sustainability and environmental responsibility. As consumers become more aware of the impact of their purchasing decisions on the environment, there is a rising need for eco-friendly and sustainable packaging solutions.
Screw capping machines play a crucial role in the packaging process and can significantly impact the sustainability of the final product. By diversifying the market, the country can encourage development and adoption of more sustainable and eco-friendly items. This could include machines that use renewable energy sources, minimize waste, or are made from recycled materials.
Constant Innovation in the United Kingdom to Fuel Demand for Customized Screw Capping Machines
Country | The United Kingdom |
---|---|
Estimated Market Size (2033) | US$ 138.5 million |
Value-based CAGR (2023 to 2033) | 4.2% |
The United Kingdom owns a strong market base for screw capping machines. This is due to its highly developed manufacturing sector.
The United Kingdom has a long history of engineering excellence and innovation, and this expertise has translated into a strong market for screw capping machines. The country’s manufacturing sector is highly diversified, with a range of sectors such as food & beverage, pharmaceuticals, and cosmetics. These sectors are anticipated to propel demand for new packaging machinery.
Another factor that contributes to the United Kingdom’s strong market base is the country's proximity to leading Europe-based firms. The country’s commitment to innovation and technological advancement would help manufacturers to constantly develop new & improved screw capping machines.
High Demand for Packaged Items in China to Support Sales of Semi-automatic Capping Machines
Country | China |
---|---|
Estimated Market Size (2033) | US$ 278.3 million |
Value-based CAGR (2023 to 2033) | 5.2% |
China has become a leading player in global manufacturing, with a large and diverse range of sectors that require packaging machinery. This has created a significant demand for screw capping machines in China, both for domestic use and for export to other countries.
China's growing middle-class population has led to an increasing demand for packaged goods, particularly in the food & beverage sector. The country’s government has invested heavily in research and development in recent years. This has led to the development of new and improved screw capping machines that are more efficient, cost-effective, and sustainable.
Demand for Automatic Screw Capping Machines to Expand Globally by 2033
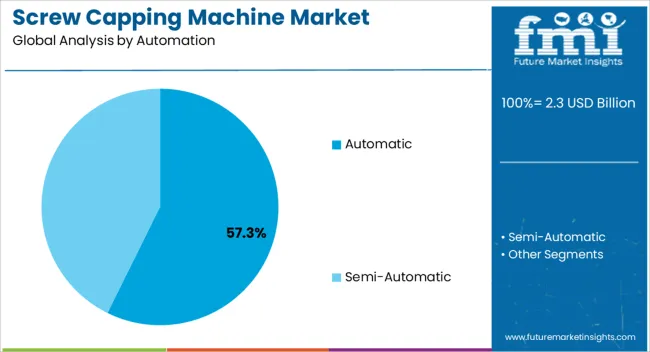
Based on automation, the automatic segment is anticipated to exhibit a CAGR of around 4.1% in the estimated period. It is likely to generate a robust share of about 67% by 2033.
In the manufacturing sector, rising demand can be attributed to growing need for higher production efficiency and output. Automatic screw capping machines enable faster and more streamlined packaging processes, reducing labor costs and enhancing productivity.
They ensure consistent and precise capping, minimizing the risk of product leakage or contamination. Additionally, these machines offer improved quality control and compliance with market regulations, making them essential for maintaining high product standards.
In the pharmaceutical and healthcare sector, demand for automatic screw capping machines is driven by growing emphasis on product safety, reliability, and tamper-evident packaging. These machines provide secure sealing, ensuring the integrity and authenticity of pharmaceutical products. They also help to protect the end consumer by preventing unauthorized access to medications and minimizing the risk of tampering.
In the food & beverage sector, automatic screw capping machines are increasingly sought after due to the need for efficient and hygienic packaging processes. These machines enable quick and reliable sealing of various containers, ensuring freshness and integrity of food & beverages. Automation capabilities help to reduce human error, enhance productivity, and maintain consistent packaging quality, meeting the stringent standards.
Benchtop Screw Capping Machines to Find High Usage among Cosmetics Manufacturers
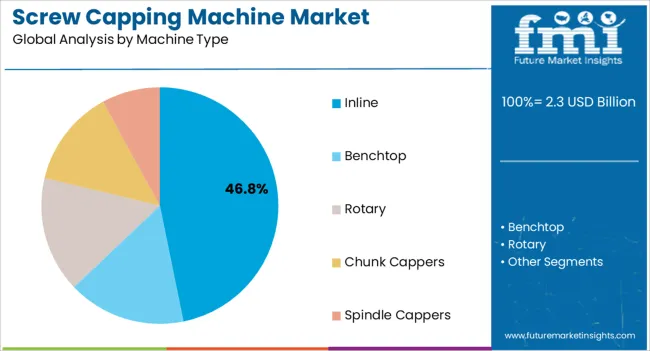
Benchtop screw capping machines by machine type are projected to witness a CAGR of 3.5% in the assessment period. It is anticipated to hold a significant share of 34% in 2033.
In the pharmaceutical and healthcare sector, benchtop screw capping machines are increasingly preferred for their compact size and versatility. These machines are ideal for small-scale production or laboratory settings, where space is limited.
They offer a cost-effective solution for sealing vials, bottles, or containers with precision and consistency. With their user-friendly design and adjustable settings, benchtop screw capping machines provide efficiency and convenience for pharmaceutical manufacturers, research facilities, and compounding pharmacies.
In the cosmetics and personal care sector, demand for benchtop screw capping machines is growing. These machines are well-suited for sealing various cosmetic products such as creams, lotions, and serums, with accuracy and speed.
Compact nature of benchtop screw capping machines allows them to be easily integrated into existing production lines or utilized in smaller manufacturing facilities. Their efficient operation and ability to handle different container sizes would make them a valuable asset for cosmetic product manufacturers.
Food & Beverage Manufactures to Adopt Automatic Capping Machines Worldwide
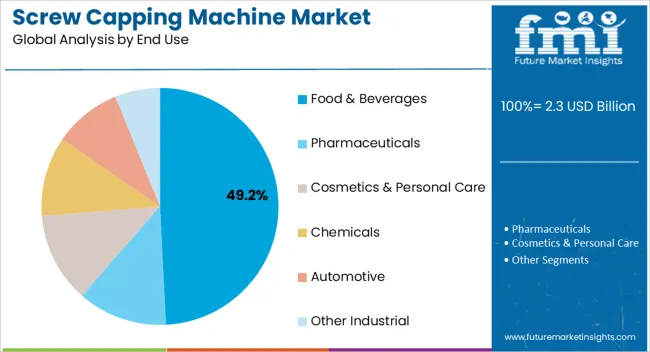
The food & beverages segment by end-use is projected to dominate the global screw capping machine market by 2033. These machines offer efficient and reliable sealing capabilities, ensuring the integrity and freshness of packaged food & beverage products. The sector’s focus on maintaining product quality and preventing contamination has fueled adoption of screw capping machines as a preferred sealing solution.
Screw capping machines provide high-speed automation, enabling manufacturers to achieve greater production efficiency and output. This is particularly beneficial for large-scale food & beverage operations where high volumes of products need to be sealed quickly and consistently.
Screw capping machines offer versatility in handling various container sizes and shapes, accommodating diverse packaging requirements of the food & beverage sector. This flexibility allows manufacturers to streamline their production processes and adapt to changing market needs more effectively.
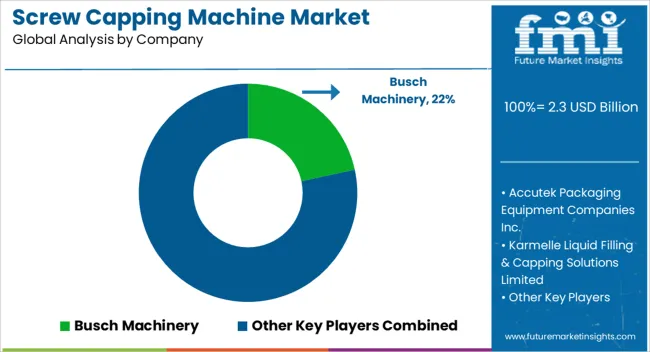
Key market players can stay competitive through product innovation. This involves developing new capping machines that are faster, more accurate, or versatile than existing machines.
They are also focusing on incorporating new technologies such as automation or artificial intelligence. Also, providing prompt and reliable technical support, offering training & installation services, and responding quickly to customer inquiries & issues are a few other strategies.
Key Strategies Adopted by Screw Capping Machine Manufacturers:
Screw capping machines are an essential piece of equipment in the packaging sector, providing a reliable and efficient method for sealing containers with screw caps. Manufacturers must focus on improving the efficiency and speed of the capping process. They should also ensure a consistent and secure seal for a wide range of container sizes and types.
One potential area of innovation could be the use of advanced robotics and machine learning algorithms to automate the capping process and minimize risk of errors or inconsistencies. This could include use of sensors and cameras to detect the position & orientation of caps and containers. They should also initiate machine learning algorithms to optimize the torque and sealing force required for each specific container type.
Customization would help to offer capping machines that are tailored to specific container types, sizes, and materials. This can involve designing and manufacturing custom capping heads, chucks, and gripping mechanisms.
Such products can accommodate containers with unique shapes, thread patterns, and closure types. By providing a precise and secure fit for each container, these customized solutions can help improve capping efficiency and reduce the risk of product leakage or contamination.
Sustainability would help in the use of recycled materials for the production of capping machines. By using recycled plastics or metals, manufacturers can reduce the amount of virgin materials needed to produce their machines, as well as divert waste from landfills.
A few manufacturers are exploring the use of bioplastics and other bio-based materials that are biodegradable and compostable, further reducing their environmental impact. Also, development of capping machines that are energy-efficient and use renewable energy sources is set to surge.
Expanding product lines is set to develop new capping machines that can meet a broader range of customer needs. This involves development of designing machines that can handle different container sizes and types. It can also include developing machines that can perform multiple capping operations in a single pass.
Acquisitions involve purchasing companies that specialize in related areas such as filling, labeling, or packaging equipment. These can also include companies that have expertise in software or automation technologies that can enhance the performance of capping machines.
Here are a couple of examples of start-ups in the screw capping machine industry:
Attribute | Details |
---|---|
Estimated Market Size (2023) | US$ 2.1 billion |
Projected Market Valuation (2033) | US$ 3.0 billion |
Value-based CAGR (2023 to 2033) | 3.7% |
Historical Data | 2018 to 2022 |
Forecast Period | 2023 to 2033 |
Quantitative Units | Value (US$ billion) |
Segments Covered |
|
Key Companies Profiled |
|
Report Coverage | Revenue Forecast, Volume Forecast, Company Ranking, Competitive Landscape, Growth Factors, Trends and Pricing Analysis |
1. Executive Summary 1.1. Global Market Outlook 1.2. Market Analysis 1.3. Analysis and Recommendations 2. Market Overview 2.1. Market Coverage / Taxonomy 2.2. Market Definition / Scope / Limitations 3. Key Market Trends 3.1. Key Trends Impacting the Market 3.2. Sustainable Trends 3.3. Technological Trends 3.4. Product Innovation / Development Trends 4. Key Success Factors 4.1. Product Adoption / Usage Analysis 4.2. Product USPs / Features 4.3. Strategic Promotional Strategies 4.4. Go-to-market Strategies 5. Global Market Demand Analysis 2018 to 2022 and Forecast, 2023 to 2033 5.1. Historical Market Volume (Units) Analysis, 2018 to 2022 5.2. Current and Future Market Volume (Units) Projections, 2023 to 2033 5.3. Y-o-Y Growth Trend Analysis 6. Global Market - Pricing Analysis 6.1. Regional Pricing Analysis 6.2. Global Average Pricing Analysis Benchmark 7. Global Market Demand (in Value or Size in US$ Million) Analysis 2018 to 2022 and Forecast, 2023 to 2033 7.1. Historical Market Value (US$ Million) Analysis, 2018 to 2022 7.2. Current and Future Market Value (US$ Million) Projections, 2023 to 2033 7.2.1. Y-o-Y Growth Trend Analysis 7.2.2. Absolute $ Opportunity Analysis 8. Market Background 8.1. Global Packaging Machinery Market Overview 8.2. Forecast Factors - Relevance & Impact 8.3. Value Chain Analysis & Profitability Margin 8.3.1. Exhaustive List of Component Suppliers 8.3.2. Exhaustive List of Distribution Machines/ Converters/Distributors 8.3.3. Exhaustive List of Brand Owners/ Customer Base 8.4. Case-based Scenario – Impact Assessment 8.4.1. Current Statistics 8.4.2. Short-Mid-Long Term Outlook 8.4.3. Likely Rebound 8.5. Market Dynamics 8.5.1. Drivers 8.5.2. Restraints 8.5.3. Opportunity Analysis 8.6. Supply Demand Analysis 8.6.1. Import /Export Analysis 9. Global Market Analysis 2018 to 2022 and Forecast 2023 to 2033, by Automation 9.1. Introduction / Key Findings 9.2. Historical Market Size (US$ Million) and Volume (Units) Analysis by Automation, 2018 to 2022 9.3. Current and Future Market Size (US$ Million) and Volume (Units) Analysis and Forecast by Automation, 2023 to 2033 9.3.1. Automatic 9.3.2. Semi-automatic 9.4. Market Attractiveness Analysis by Automation 10. Global Market Analysis 2018 to 2022 and Forecast 2023 to 2033, By Machine Type 10.1. Introduction / Key Findings 10.2. Historical Market Size (US$ Million) and Volume (Units) Analysis By Machine Type, 2018 to 2022 10.3. Current and Future Market Size (US$ Million) and Volume (Units) Analysis and Forecast By Machine Type, 2023 to 2033 10.3.1. Inline Screw Capping Machine 10.3.2. Benchtop Screw Capping Machine 10.3.3. Rotary Screw Capping Machine 10.3.4. Chunk Cappers 10.3.5. Spindle Cappers 10.4. Market Attractiveness Analysis By Machine Type 11. Global Market Analysis 2018 to 2022 and Forecast 2023 to 2033, By End Use 11.1. Introduction / Key Findings 11.2. Historical Market Size (US$ Million) and Volume (Units) Analysis By End Use, 2018 to 2022 11.3. Current and Future Market Size (US$ Million) and Volume (Units) Analysis and Forecast By End Use, 2023 to 2033 11.3.1. Food & Beverage 11.3.2. Pharmaceuticals 11.3.3. Cosmetics & Personal Care 11.3.4. Chemicals 11.3.5. Automotive 11.3.6. Other Industrial 11.4. Market Attractiveness Analysis By End Use 12. Global Market Analysis 2018 to 2022 and Forecast 2023 to 2033, By Region 12.1. Introduction / Key Findings 12.2. Historical Market Size (US$ Million) and Volume (Units) Analysis By Region, 2018 to 2022 12.3. Current and Future Market Size (US$ Million) and Volume (Units) Analysis and Forecast By Region, 2023 to 2033 12.3.1. North America 12.3.2. Latin America 12.3.3. East Asia 12.3.4. South Asia & Pacific 12.3.5. Western Europe 12.3.6. Eastern Europe 12.3.7. Central Asia 12.3.8. Russia & Belarus 12.3.9. Balkan & Baltic Countries 12.3.10. Middle East and Africa 12.4. Market Attractiveness Analysis By Region 13. North America Market Analysis 2018 to 2022 and Forecast 2023 to 2033 13.1. Introduction / Key Findings 13.2. Historical Market Size (US$ Million) and Volume (Units) Analysis by Market Taxonomy, 2018 to 2022 13.3. Current Market Size (US$ Million) and Volume (Units) Analysis and Forecast by Market Taxonomy, 2023 to 2033 13.3.1. By Region 13.3.1.1. United States 13.3.1.2. Canada 13.3.2. by Automation 13.3.3. By Machine Type 13.3.4. By End Use 13.4. Market Attractiveness Analysis 13.4.1. By Region 13.4.2. by Automation 13.4.3. By Machine Type 13.4.4. By End Use 14. Latin America Market Analysis 2018 to 2022 and Forecast 2023 to 2033 14.1. Introduction / Key Findings 14.2. Historical Market Size (US$ Million) and Volume (Units) Analysis by Market Taxonomy, 2018 to 2022 14.3. Current Market Size (US$ Million) and Volume (Units) Analysis and Forecast by Market Taxonomy, 2023 to 2033 14.3.1. By Region 14.3.1.1. Brazil 14.3.1.2. Mexico 14.3.1.3. Argentina 14.3.1.4. Rest of Latin America 14.3.2. by Automation 14.3.3. By Machine Type 14.3.4. By End Use 14.4. Market Attractiveness Analysis 14.4.1. By Region 14.4.2. by Automation 14.4.3. By Machine Type 14.4.4. By End Use 15. East Asia Market Analysis 2018 to 2022 and Forecast 2023 to 2033 15.1. Introduction / Key Findings 15.2. Historical Market Size (US$ Million) and Volume (Units) Analysis by Market Taxonomy, 2018 to 2022 15.3. Current Market Size (US$ Million) and Volume (Units) Analysis and Forecast by Market Taxonomy, 2023 to 2033 15.3.1. By Region 15.3.1.1. China 15.3.1.2. Japan 15.3.1.3. South Korea 15.3.2. by Automation 15.3.3. By Machine Type 15.3.4. By End Use 15.4. Market Attractiveness Analysis 15.4.1. By Region 15.4.2. by Automation 15.4.3. By Machine Type 15.4.4. By End Use 16. South Asia & Pacific Market Analysis 2018 to 2022 and Forecast 2023 to 2033 16.1. Introduction / Key Findings 16.2. Historical Market Size (US$ Million) and Volume (Units) Analysis by Market Taxonomy, 2018 to 2022 16.3. Current Market Size (US$ Million) and Volume (Units) Analysis and Forecast by Market Taxonomy, 2023 to 2033 16.3.1. By Region 16.3.1.1. India 16.3.1.2. Association of Southeast Asian Nations 16.3.1.3. Australia & New Zealand 16.3.2. by Automation 16.3.3. By Machine Type 16.3.4. By End Use 16.4. Market Attractiveness Analysis 16.4.1. By Region 16.4.2. by Automation 16.4.3. By Machine Type 16.4.4. By End Use 17. Western Europe Market Analysis 2018 to 2022 and Forecast 2023 to 2033 17.1. Introduction / Key Findings 17.2. Historical Market Size (US$ Million) and Volume (Units) Analysis by Market Taxonomy, 2018 to 2022 17.3. Current Market Size (US$ Million) and Volume (Units) Analysis and Forecast by Market Taxonomy, 2023 to 2033 17.3.1. By Region 17.3.1.1. Germany 17.3.1.2. France 17.3.1.3. Spain 17.3.1.4. Italy 17.3.1.5. United Kingdom 17.3.1.6. BENELUX 17.3.1.7. Nordics 17.3.1.8. Rest of Western Europe 17.3.2. by Automation 17.3.3. By Machine Type 17.3.4. By End Use 17.4. Market Attractiveness Analysis 17.4.1. By Region 17.4.2. by Automation 17.4.3. By Machine Type 17.4.4. By End Use 18. Eastern Europe Market Analysis 2018 to 2022 and Forecast 2023 to 2033 18.1. Introduction / Key Findings 18.2. Historical Market Size (US$ Million) and Volume (Units) Analysis by Market Taxonomy, 2018 to 2022 18.3. Current Market Size (US$ Million) and Volume (Units) Analysis and Forecast by Market Taxonomy, 2023 to 2033 18.3.1. By Region 18.3.1.1. Poland 18.3.1.2. Hungary 18.3.1.3. Austria 18.3.1.4. Czech Republic 18.3.1.5. Rest of Eastern Europe 18.3.2. by Automation 18.3.3. By Machine Type 18.3.4. By End Use 18.4. Market Attractiveness Analysis 18.4.1. By Region 18.4.2. by Automation 18.4.3. By Machine Type 18.4.4. By End Use 19. Central Asia Market Analysis 2018 to 2022 and Forecast 2023 to 2033 19.1. Introduction / Key Findings 19.2. Historical Market Size (US$ Million) and Volume (Units) Analysis by Market Taxonomy, 2018 to 2022 19.3. Current Market Size (US$ Million) and Volume (Units) Analysis and Forecast by Market Taxonomy, 2023 to 2033 19.3.1. By Region 19.3.1.1. Kazakhstan 19.3.1.2. Kyrgyzstan 19.3.1.3. Tajikistan 19.3.1.4. Turkmenistan 19.3.1.5. Uzbekistan 19.3.2. by Automation 19.3.3. By Machine Type 19.3.4. By End Use 19.4. Market Attractiveness Analysis 19.4.1. By Region 19.4.2. by Automation 19.4.3. By Machine Type 19.4.4. By End Use 20. Russia & Belarus Market Analysis 2018 to 2022 and Forecast 2023 to 2033 20.1. Introduction / Key Findings 20.2. Historical Market Size (US$ Million) and Volume (Units) Analysis by Market Taxonomy, 2018 to 2022 20.3. Current Market Size (US$ Million) and Volume (Units) Analysis and Forecast by Market Taxonomy, 2023 to 2033 20.3.1. By Region 20.3.1.1. Russia 20.3.1.2. Belarus 20.3.2. by Automation 20.3.3. By Machine Type 20.3.4. By End Use 20.3.5. By End Use 20.4. Market Attractiveness Analysis 20.4.1. By Region 20.4.2. by Automation 20.4.3. By Machine Type 20.4.4. By End Use 21. Balkan Countries Market Analysis 2018 to 2022 and Forecast 2023 to 2033 21.1. Introduction / Key Findings 21.2. Historical Market Size (US$ Million) and Volume (Units) Analysis by Market Taxonomy, 2018 to 2022 21.3. Current Market Size (US$ Million) and Volume (Units) Analysis and Forecast by Market Taxonomy, 2023 to 2033 21.3.1. By Region 21.3.1.1. Romania 21.3.1.2. Greece 21.3.1.3. Bulgaria 21.3.2. by Automation 21.3.3. By Machine Type 21.3.4. By End Use 21.4. Market Attractiveness Analysis 21.4.1. By Region 21.4.2. by Automation 21.4.3. By Machine Type 21.4.4. By End Use 22. Baltic Countries Market Analysis 2018 to 2022 and Forecast 2023 to 2033 22.1. Introduction / Key Findings 22.2. Historical Market Size (US$ Million) and Volume (Units) Analysis by Market Taxonomy, 2018 to 2022 22.3. Current Market Size (US$ Million) and Volume (Units) Analysis and Forecast by Market Taxonomy, 2023 to 2033 22.3.1. By Region 22.3.1.1. Lithuania 22.3.1.2. Estonia 22.3.1.3. Latvia 22.3.2. by Automation 22.3.3. By Machine Type 22.3.4. By End Use 22.4. Market Attractiveness Analysis 22.4.1. By Region 22.4.2. by Automation 22.4.3. By Machine Type 22.4.4. By End Use 23. Middle East & Africa Market Analysis 2018 to 2022 and Forecast 2023 to 2033 23.1. Introduction / Key Findings 23.2. Historical Market Size (US$ Million) and Volume (Units) Analysis by Market Taxonomy, 2018 to 2022 23.3. Current Market Size (US$ Million) and Volume (Units) Analysis and Forecast by Market Taxonomy, 2023 to 2033 23.3.1. By Region 23.3.1.1. GCC Countries 23.3.1.2. Türkiye 23.3.1.3. Northern Africa 23.3.1.4. South Africa 23.3.1.5. Israel 23.3.1.6. Saudi Arabia 23.3.2. by Automation 23.3.3. By Machine Type 23.3.4. By End Use 23.4. Market Attractiveness Analysis 23.4.1. By Region 23.4.2. by Automation 23.4.3. By Machine Type 23.4.4. By End Use 24. Region wise Market Analysis 2023 & 2033 24.1. United States Market Analysis 24.1.1. by Automation 24.1.2. By Machine Type 24.1.3. By End Use 24.2. Canada Market Analysis 24.2.1. by Automation 24.2.2. By Machine Type 24.2.3. By End Use 24.3. Brazil Market Analysis 24.3.1. by Automation 24.3.2. By Machine Type 24.3.3. By End Use 24.4. Mexico Market Analysis 24.4.1. by Automation 24.4.2. By Machine Type 24.4.3. By End Use 24.5. Germany Market Analysis 24.5.1. by Automation 24.5.2. By Machine Type 24.5.3. By End Use 24.6. United Kingdom Market Analysis 24.6.1. by Automation 24.6.2. By Machine Type 24.6.3. By End Use 24.7. Spain Market Analysis 24.7.1. by Automation 24.7.2. By Machine Type 24.7.3. By End Use 24.8. France Market Analysis 24.8.1. by Automation 24.8.2. By Machine Type 24.8.3. By End Use 24.9. Italy Market Analysis 24.9.1. by Automation 24.9.2. By Machine Type 24.9.3. By End Use 24.10. Russia Market Analysis 24.10.1. by Automation 24.10.2. By Machine Type 24.10.3. By End Use 24.11. China Market Analysis 24.11.1. by Automation 24.11.2. By Machine Type 24.11.3. By End Use 24.12. Japan Market Analysis 24.12.1. by Automation 24.12.2. By Machine Type 24.12.3. By End Use 24.13. India Market Analysis 24.13.1. by Automation 24.13.2. By Machine Type 24.13.3. By End Use 24.14. GCC Countries Market Analysis 24.14.1. by Automation 24.14.2. By Machine Type 24.14.3. By End Use 24.15. Australia Market Analysis 24.15.1. by Automation 24.15.2. By Machine Type 24.15.3. By End Use 25. Market Structure Analysis 25.1. Market Analysis by Tier of Companies (Sustainable Packaging) 25.2. Market Share Analysis of Top Players 25.3. Market Presence Analysis 26. Competition Analysis 26.1. Competition Dashboard 26.2. Competition Benchmarking 26.3. Competition Deep Dive 26.3.1. Busch Machinery 26.3.1.1. Overview 26.3.1.2. Product Portfolio 26.3.1.3. Profitability by Market Segments (Automation/Machine/Region) 26.3.1.4. Sales Footprint 26.3.1.5. Strategy Overview 26.3.2. Accutek Packaging Equipment Companies Inc. 26.3.2.1. Overview 26.3.2.2. Product Portfolio 26.3.2.3. Profitability by Market Segments (Automation/Machine/Region) 26.3.2.4. Sales Footprint 26.3.2.5. Strategy Overview 26.3.3. Karmelle Liquid Filling & Capping Solutions Limited 26.3.3.1. Overview 26.3.3.2. Product Portfolio 26.3.3.3. Profitability by Market Segments (Automation/Machine/Region) 26.3.3.4. Sales Footprint 26.3.3.5. Strategy Overview 26.3.4. Closure Systems International, Inc. 26.3.4.1. Overview 26.3.4.2. Product Portfolio 26.3.4.3. Profitability by Market Segments (Automation/Machine/Region) 26.3.4.4. Sales Footprint 26.3.4.5. Strategy Overview 26.3.5. E-PAK Machinery, Inc. 26.3.5.1. Overview 26.3.5.2. Product Portfolio 26.3.5.3. Profitability by Market Segments (Automation/Machine/Region) 26.3.5.4. Sales Footprint 26.3.5.5. Strategy Overview 26.3.6. Tecnocap S.p.A 26.3.6.1. Overview 26.3.6.2. Product Portfolio 26.3.6.3. Profitability by Market Segments (Automation/Machine/Region) 26.3.6.4. Sales Footprint 26.3.6.5. Strategy Overview 26.3.7. APACKS 26.3.7.1. Overview 26.3.7.2. Product Portfolio 26.3.7.3. Profitability by Market Segments (Automation/Machine/Region) 26.3.7.4. Sales Footprint 26.3.7.5. Strategy Overview 26.3.8. Seiko Corporation 26.3.8.1. Overview 26.3.8.2. Product Portfolio 26.3.8.3. Profitability by Market Segments (Automation/Machine/Region) 26.3.8.4. Sales Footprint 26.3.8.5. Strategy Overview 26.3.9. New England Machinery Inc. 26.3.9.1. Overview 26.3.9.2. Product Portfolio 26.3.9.3. Profitability by Market Segments (Automation/Machine/Region) 26.3.9.4. Sales Footprint 26.3.9.5. Strategy Overview 26.3.10. Jintan Sunshine Packing Machinery Co. Ltd. 26.3.10.1. Overview 26.3.10.2. Product Portfolio 26.3.10.3. Profitability by Market Segments (Automation/Machine/Region) 26.3.10.4. Sales Footprint 26.3.10.5. Strategy Overview 27. Assumptions and Acronyms Used 28. Research Methodology
Don't pay for what you don't need
Customize your report by selecting specific countries or regions and save 30%!
Table 01: Global Market Value (US$ Million) Analysis, by Automation, 2018H to 2033F Table 02: Global Market Volume (Units) Analysis, by Automation, 2018H to 2033F Table 03: Global Market Value (US$ Million) Analysis, by Machine Type, 2018H to 2033F Table 04: Global Market Volume (Units) Analysis, by Machine Type, 2018H to 2033F Table 05: Global Market Value (US$ Million) Analysis, by End Use, 2018H to 2033F Table 06: Global Market Volume (Units) Analysis, by End Use, 2018H to 2033F Table 07: Global Market Value (US$ Million) Analysis, by Region, 2018H to 2033F Table 08: Global Market Volume (Units) Analysis, by Region, 2018H to 2033F Table 09: North America Market Value (US$ Million) Analysis, by Automation, 2018H to 2033F Table 10: North America Market Volume (Units) Analysis, by Automation, 2018H to 2033F Table 11: North America Market Value (US$ Million) Analysis, by Machine Type, 2018H to 2033F Table 12: North America Market Volume (Units) Analysis, by Machine Type, 2018H to 2033F Table 13: North America Market Value (US$ Million) Analysis, by End Use, 2018H to 2033F Table 14: North America Market Volume (Units) Analysis, by End Use, 2018H to 2033F Table 15: North America Market Value (US$ Million) Analysis, by Region, 2018H to 2033F Table 16: North America Market Volume (Units) Analysis, by Region, 2018H to 2033F Table 17: Latin America Market Value (US$ Million) Analysis, by Automation, 2018H to 2033F Table 18: Latin America Market Volume (Units) Analysis, by Automation, 2018H to 2033F Table 19: Latin America Market Value (US$ Million) Analysis, by Machine Type, 2018H to 2033F Table 20: Latin America Market Volume (Units) Analysis, by Machine Type, 2018H to 2033F Table 21: Latin America Market Value (US$ Million) Analysis, by End Use, 2018H to 2033F Table 22: Latin America Market Volume (Units) Analysis, by End Use, 2018H to 2033F Table 23: Latin America Market Value (US$ Million) Analysis, by Region, 2018H to 2033F Table 24: Latin America Market Volume (Units) Analysis, by Region, 2018H to 2033F Table 25: East Asia Market Value (US$ Million) Analysis, by Automation, 2018H to 2033F Table 26: East Asia Market Volume (Units) Analysis, by Automation, 2018H to 2033F Table 27: East Asia Market Value (US$ Million) Analysis, by Machine Type, 2018H to 2033F Table 28: East Asia Market Volume (Units) Analysis, by Machine Type, 2018H to 2033F Table 29: East Asia Market Value (US$ Million) Analysis, by End Use, 2018H to 2033F Table 30: East Asia Market Volume (Units) Analysis, by End Use, 2018H to 2033F Table 31: East Asia Market Value (US$ Million) Analysis, by Region, 2018H to 2033F Table 32: East Asia Market Volume (Units) Analysis, by Region, 2018H to 2033F Table 33: South Asia & Pacific Market Value (US$ Million) Analysis, by Automation, 2018H to 2033F Table 34: South Asia & Pacific Market Volume (Units) Analysis, by Automation, 2018H to 2033F Table 35: South Asia & Pacific Market Value (US$ Million) Analysis, by Machine Type, 2018H to 2033F Table 36: South Asia & Pacific Market Volume (Units) Analysis, by Machine Type, 2018H to 2033F Table 37: South Asia & Pacific Market Value (US$ Million) Analysis, by End Use, 2018H to 2033F Table 38: South Asia & Pacific Market Volume (Units) Analysis, by End Use, 2018H to 2033F Table 39: South Asia & Pacific Market Value (US$ Million) Analysis, by Region, 2018H to 2033F Table 40: South Asia & Pacific Market Volume (Units) Analysis, by Region, 2018H to 2033F Table 41: Western Europe Market Value (US$ Million) Analysis, by Automation, 2018H to 2033F Table 42: Western Europe Market Volume (Units) Analysis, by Automation, 2018H to 2033F Table 43: Western Europe Market Value (US$ Million) Analysis, by Machine Type, 2018H to 2033F Table 44: Western Europe Market Volume (Units) Analysis, by Machine Type, 2018H to 2033F Table 45: Western Europe Market Value (US$ Million) Analysis, by End Use, 2018H to 2033F Table 46: Western Europe Market Volume (Units) Analysis, by End Use, 2018H to 2033F Table 47: Western Europe Market Value (US$ Million) Analysis, by Region, 2018H to 2033F Table 48: Western Europe Market Volume (Units) Analysis, by Region, 2018H to 2033F Table 49: Eastern Europe Market Value (US$ Million) Analysis, by Automation, 2018H to 2033F Table 50: Eastern Europe Market Volume (Units) Analysis, by Automation, 2018H to 2033F Table 51: Eastern Europe Market Value (US$ Million) Analysis, by Machine Type, 2018H to 2033F Table 52: Eastern Europe Market Volume (Units) Analysis, by Machine Type, 2018H to 2033F Table 53: Eastern Europe Market Value (US$ Million) Analysis, by End Use, 2018H to 2033F Table 54: Eastern Europe Market Volume (Units) Analysis, by End Use, 2018H to 2033F Table 55: Eastern Europe Market Value (US$ Million) Analysis, by Region, 2018H to 2033F Table 56: Eastern Europe Market Volume (Units) Analysis, by Region, 2018H to 2033F Table 57: Central Asia Market Value (US$ Million) Analysis, by Automation, 2018H to 2033F Table 58: Central Asia Market Volume (Units) Analysis, by Automation, 2018H to 2033F Table 59: Central Asia Market Value (US$ Million) Analysis, by Machine Type, 2018H to 2033F Table 60: Central Asia Market Volume (Units) Analysis, by Machine Type, 2018H to 2033F Table 61: Central Asia Market Value (US$ Million) Analysis, by End Use, 2018H to 2033F Table 62: Central Asia Market Volume (Units) Analysis, by End Use, 2018H to 2033F Table 63: Central Asia Market Value (US$ Million) Analysis, by Region, 2018H to 2033F Table 64: Central Asia Market Volume (Units) Analysis, by Region, 2018H to 2033F Table 65: Russia & Belarus Market Value (US$ Million) Analysis, by Automation, 2018H to 2033F Table 66: Russia & Belarus Market Volume (Units) Analysis, by Automation, 2018H to 2033F Table 67: Russia & Belarus Market Value (US$ Million) Analysis, by Machine Type, 2018H to 2033F Table 68: Russia & Belarus Market Volume (Units) Analysis, by Machine Type, 2018H to 2033F Table 69: Russia & Belarus Market Value (US$ Million) Analysis, by End Use, 2018H to 2033F Table 70: Russia & Belarus Market Volume (Units) Analysis, by End Use, 2018H to 2033F Table 71: Russia & Belarus Market Value (US$ Million) Analysis, by Region, 2018H to 2033F Table 72: Russia & Belarus Market Volume (Units) Analysis, by Region, 2018H to 2033F Table 73: Balkan Countries Market Value (US$ Million) Analysis, by Automation, 2018H to 2033F Table 74: Balkan Countries Market Volume (Units) Analysis, by Automation, 2018H to 2033F Table 75: Balkan Countries Market Value (US$ Million) Analysis, by Machine Type, 2018H to 2033F Table 76: Balkan Countries Market Volume (Units) Analysis, by Machine Type, 2018H to 2033F Table 77: Balkan Countries Market Value (US$ Million) Analysis, by End Use, 2018H to 2033F Table 78: Balkan Countries Market Volume (Units) Analysis, by End Use, 2018H to 2033F Table 79: Balkan Countries Market Value (US$ Million) Analysis, by Region, 2018H to 2033F Table 80: Balkan Countries Market Volume (Units) Analysis, by Region, 2018H to 2033F Table 81: Baltic Countries Market Value (US$ Million) Analysis, by Automation, 2018H to 2033F Table 82: Baltic Countries Market Volume (Units) Analysis, by Automation, 2018H to 2033F Table 83: Baltic Countries Market Value (US$ Million) Analysis, by Machine Type, 2018H to 2033F Table 84: Baltic Countries Market Volume (Units) Analysis, by Machine Type, 2018H to 2033F Table 85: Baltic Countries Market Value (US$ Million) Analysis, by End Use, 2018H to 2033F Table 86: Baltic Countries Market Volume (Units) Analysis, by End Use, 2018H to 2033F Table 87: Baltic Countries Market Value (US$ Million) Analysis, by Region, 2018H to 2033F Table 88: Baltic Countries Market Volume (Units) Analysis, by Region, 2018H to 2033F Table 89: Middle East and Africa Market Value (US$ Million) Analysis, by Automation, 2018H to 2033F Table 90: Middle East and Africa Market Volume (Units) Analysis, by Automation, 2018H to 2033F Table 91: Middle East and Africa Market Value (US$ Million) Analysis, by Machine Type, 2018H to 2033F Table 92: Middle East and Africa Market Volume (Units) Analysis, by Machine Type, 2018H to 2033F Table 93: Middle East and Africa Market Value (US$ Million) Analysis, by End Use, 2018H to 2033F Table 94: Middle East and Africa Market Volume (Units) Analysis, by End Use, 2018H to 2033F Table 95: Middle East and Africa Market Value (US$ Million) Analysis, by Region, 2018H to 2033F Table 96: Middle East and Africa Market Volume (Units) Analysis, by Region, 2018H to 2033F
Figure 01: Global Market Share Analysis by Automation, 2023E & 2033F Figure 02: Global Market Y-o-Y Analysis by Automation, 2018H to 2033F Figure 03: Global Market Attractiveness Analysis by Automation, 2023E to 2033F Figure 04: Global Market Share Analysis by Machine Type, 2023E & 2033F Figure 05: Global Market Y-o-Y Analysis by Machine Type, 2018H to 2033F Figure 06: Global Market Attractiveness Analysis by Machine Type, 2023E to 2033F Figure 07: Global Market Share Analysis by End Use, 2023E & 2033F Figure 08: Global Market Y-o-Y Analysis by End Use, 2018H to 2033F Figure 09: Global Market Attractiveness Analysis by End Use, 2023E to 2033F Figure 10: Global Market Share Analysis by Region 2023E & 2033F Figure 11: Global Market Y-o-Y Analysis by Region, 2018H to 2033F Figure 12: Global Market Attractiveness Analysis by Region, 2023E to 2033F Figure 13: North America Market Attractiveness Analysis by Machine Type, 2023E to 2033F Figure 14: North America Market Y-o-Y Analysis by Automation, 2018H to 2033F Figure 15: North America Market Value Share Analysis by End Use 2023(E) Figure 16: North America Market Share Analysis by Region, 2023E & 2033F Figure 17: Latin America Market Attractiveness Analysis by Machine Type, 2023E to 2033F Figure 18: Latin America Market Y-o-Y Analysis by Automation, 2018H to 2033F Figure 19: Latin America Market Value Share Analysis by End Use 2023(E) Figure 20: Latin America Market Share Analysis by Region, 2023E & 2033F Figure 21: East Asia Market Attractiveness Analysis by Machine Type, 2023E to 2033F Figure 22: East Asia Market Y-o-Y Analysis by Automation, 2018H to 2033F Figure 23: East Asia Market Value Share Analysis by End Use 2023(E) Figure 24: East Asia Market Share Analysis by Region, 2023E & 2033F Figure 25: South Asia & Pacific Market Attractiveness Analysis by Machine Type, 2023E to 2033F Figure 26: South Asia & Pacific Market Y-o-Y Analysis by Automation, 2018H to 2033F Figure 27: South Asia & Pacific Market Value Share Analysis by End Use 2023(E) Figure 28: South Asia & Pacific Market Share Analysis by Region, 2023E & 2033F Figure 29: Western Europe Market Attractiveness Analysis by Machine Type, 2023E to 2033F Figure 30: Western Europe Market Y-o-Y Analysis by Automation, 2018H to 2033F Figure 31: Western Europe Market Value Share Analysis by End Use 2023(E) Figure 32: Western Europe Market Share Analysis by Region, 2023E & 2033F Figure 33: Eastern Europe Market Attractiveness Analysis by Machine Type, 2023E to 2033F Figure 34: Eastern Europe Market Y-o-Y Analysis by Automation, 2018H to 2033F Figure 35: Eastern Europe Market Value Share Analysis by End Use 2023(E) Figure 36: Eastern Europe Market Share Analysis by Region, 2023E & 2033F Figure 37: Central Asia Market Attractiveness Analysis by Machine Type, 2023E to 2033F Figure 38: Central Asia Market Y-o-Y Analysis by Automation, 2018H to 2033F Figure 39: Central Asia Market Value Share Analysis by End Use 2023(E) Figure 40: Central Asia Market Share Analysis by Region, 2023E & 2033F Figure 41: Russia & Belarus Market Attractiveness Analysis by Machine Type, 2023E to 2033F Figure 42: Russia & Belarus Market Y-o-Y Analysis by Automation, 2018H to 2033F Figure 43: Russia & Belarus Market Value Share Analysis by End Use 2023(E) Figure 44: Russia & Belarus Market Share Analysis by Region, 2023E & 2033F Figure 45: Balkan Countries Market Attractiveness Analysis by Machine Type, 2023E to 2033F Figure 46: Balkan Countries Market Y-o-Y Analysis by Automation, 2018H to 2033F Figure 47: Balkan Countries Market Value Share Analysis by End Use 2023(E) Figure 48: Balkan Countries Market Share Analysis by Region, 2023E & 2033F Figure 49: Baltic Countries Market Attractiveness Analysis by Machine Type, 2023E to 2033F Figure 50: Baltic Countries Market Y-o-Y Analysis by Automation, 2018H to 2033F Figure 51: Baltic Countries Market Value Share Analysis by End Use 2023(E) Figure 52: Baltic Countries Market Share Analysis by Region, 2023E & 2033F Figure 53: Middle East and Africa Market Attractiveness Analysis by Machine Type, 2023E to 2033F Figure 54: Middle East and Africa Market Y-o-Y Analysis by Automation, 2018H to 2033F Figure 55: Middle East and Africa Market Value Share Analysis by End Use 2023(E) Figure 56: Middle East and Africa Market Share Analysis by Region, 2023E & 2033F Figure 57: United States Market Value Share Analysis, by Machine Type, 2023E & 2033F Figure 58: United States Market Value Share Analysis, by Automation, 2023E & 2033F Figure 59: United States Market Value Share Analysis, by End Use, 2023E & 2033F Figure 60: Canada Market Value Share Analysis, by Machine Type, 2023E & 2033F Figure 61: Canada Market Value Share Analysis, by Automation, 2023E & 2033F Figure 62: Canada Market Value Share Analysis, by End Use, 2023E & 2033F Figure 63: Brazil Market Value Share Analysis, by Machine Type, 2023E & 2033F Figure 64: Brazil Market Value Share Analysis, by Automation, 2023E & 2033F Figure 65: Brazil Market Value Share Analysis, by End Use, 2023E & 2033F Figure 66: Mexico Market Value Share Analysis, by Machine Type, 2023E & 2033F Figure 67: Mexico Market Value Share Analysis, by Automation, 2023E & 2033F Figure 68: Mexico Market Value Share Analysis, by End Use, 2023E & 2033F Figure 69: Germany Market Value Share Analysis, by Machine Type, 2023E & 2033F Figure 70: Germany Market Value Share Analysis, by Automation, 2023E & 2033F Figure 71: Germany Market Value Share Analysis, by End Use, 2023E & 2033F Figure 72: Italy Market Value Share Analysis, by Machine Type, 2023E & 2033F Figure 73: Italy Market Value Share Analysis, by Automation, 2023E & 2033F Figure 74: Italy Market Value Share Analysis, by End Use, 2023E & 2033F Figure 75: France Market Value Share Analysis, by Machine Type, 2023E & 2033F Figure 76: France Market Value Share Analysis, by Automation, 2023E & 2033F Figure 77: France Market Value Share Analysis, by End Use, 2023E & 2033F Figure 78: United Kingdom Market Value Share Analysis, by Machine Type, 2023E & 2033F Figure 79: United Kingdom Market Value Share Analysis, by Automation, 2023E & 2033F Figure 80: United Kingdom Market Value Share Analysis, by End Use, 2023E & 2033F Figure 81: Spain Market Value Share Analysis, by Machine Type, 2023E & 2033F Figure 82: Spain Market Value Share Analysis, by Automation, 2023E & 2033F Figure 83: Spain Market Value Share Analysis, by End Use, 2023E & 2033F Figure 84: Russia Market Value Share Analysis, by Machine Type, 2023E & 2033F Figure 85: Russia Market Value Share Analysis, by Automation, 2023E & 2033F Figure 86: Russia Market Value Share Analysis, by End Use, 2023E & 2033F Figure 87: GCC Market Value Share Analysis, by Machine Type, 2023E & 2033F Figure 88: GCC Market Value Share Analysis, by Automation, 2023E & 2033F Figure 89: GCC Market Value Share Analysis, by End Use, 2023E & 2033F Figure 90: South Africa Market Value Share Analysis, by Machine Type, 2023E & 2033F Figure 91: South Africa Market Value Share Analysis, by Automation, 2023E & 2033F Figure 92: South Africa Market Value Share Analysis, by End Use, 2023E & 2033F Figure 93: Japan Market Value Share Analysis, by Machine Type, 2023E & 2033F Figure 94: Japan Market Value Share Analysis, by Automation, 2023E & 2033F Figure 95: Japan Market Value Share Analysis, by End Use, 2023E & 2033F Figure 96: India Market Value Share Analysis, by Machine Type, 2023E & 2033F Figure 97: India Market Value Share Analysis, by Automation, 2023E & 2033F Figure 98: India Market Value Share Analysis, by End Use, 2023E & 2033F Figure 98: China Market Value Share Analysis, by Machine Type, 2023E & 2033F Figure 99: China Market Value Share Analysis, by Automation, 2023E & 2033F Figure 100: China Market Value Share Analysis, by End Use, 2023E & 2033F Figure 101: Australia Market Value Share Analysis, by Machine Type, 2023E & 2033F Figure 102: Australia Market Value Share Analysis, by Automation, 2023E & 2033F Figure 103: Australia Market Value Share Analysis, by End Use, 2023E & 2033F
Recommendations
Explore Packaging Insights
View Reports