Screw Compressor Market Outlook for 2024 to 2034

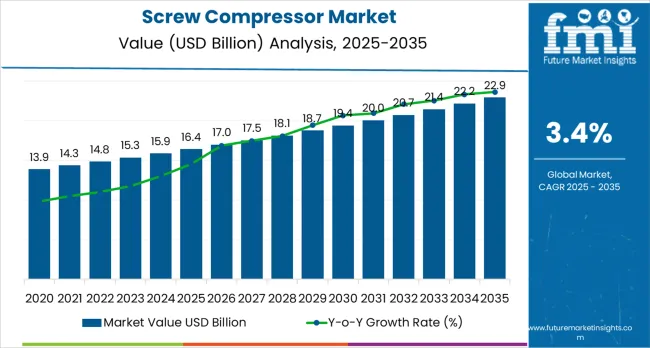
The screw compressor market is expected to be valued at US$ 15.82 billion in 2024. Oil-free screw air compressor usage is anticipated to boost the market due to the growing popularity of automation trends. Screw compressor sales are expected to grow at a 3.4% CAGR from 2024 and 2034. The market is expected to reach a valuation of US$ 22.10 billion by 2034.

Screw compressors provide dry, clean, and compressed air employing internal compression and a positive displacement mechanism. They work mostly in high-volume, low-pressure applications with twin-shaft rotating lobe machinery. To fulfil continuous air demand and guarantee consistent performance, these compressors maintain a constant air supply.

Attributes Details
Screw Compressor Market Value, 2024 US$ 15.82 billion
Screw Compressor Market Value, 2034 US$ 22.10 billion
CAGR (2024 to 2034) 3.4%

Don't pay for what you don't need

Customize your report by selecting specific countries or regions and save 30%!

Sales Analysis of the Screw Compressor Sector

  • The refrigeration and natural gas sectors have made screw compressors popular because of their great efficiency and dependability when compared to other compressor types. The fourth industrial revolution, or Industry 4.0, has drastically altered industrial equipment.
  • Industries need to operate continuously, which is possible solely with useful equipment. Screw air compressors, for instance, offer the best operability by permitting continuous airflow and pressurization and by minimizing downtime for customers by turning off and on machines without a duty cycle.
  • With their high demand and capacity to create complicated items and machinery in larger quantities more quickly, screw compressors are seeing increased use in industries such as food, beverage, oil and gas, automotive, and pharmaceuticals.
  • Demand for oil-free systems with increased capacity, accuracy, and efficiency is high due to their eco-friendliness and economic effectiveness. Users are switching to modern technology since screw compressors of the next generation are less complicated to install and need less maintenance.
  • The development of remote sensing technology, which makes it possible to make convenient and effective adjustments to operations, is expected to propel the screw compressor market's growth over the next decade, developing demand from various industries, including commercial, residential, and industrial applications.

Historical Performance and Future Growth Prospects of the Screw Compressor Market

This part offers a thorough examination of the industry during the previous five years, with an emphasis on anticipated changes in the screw compressor sector. The market grew at a 1.9% CAGR during the historical period. The industry is expected to grow consistently at a 3.4% CAGR through 2034.

Historical CAGR 1.9%
Forecasted CAGR 3.4%

Improvements in energy-efficient technology, including variable frequency, drive the sale of constant-speed compressors. This is possibly the reason for the potential decline in the market for screw compressors. Furthermore, the market is likely to be impacted by the shift toward large-scale industrial compressors and localized and renewable energy sources.

Crucial factors that are anticipated to influence the demand for screw compressors through 2034.

  • The competitiveness of screw compressors in the market is likely to be improved by design innovations, including the use of IoT technology for predictive maintenance and energy efficiency improvement.
  • There are opportunities for market expansion when product portfolios are diversified to meet the needs of specialty markets, including foods and beverages, medicines, and electronics manufacturing.
  • Market penetration and expansion are possibly facilitated through strategic collaborations with energy service companies (ESCOs) and government efforts promoting energy-efficient technology.
  • Sustainability-driven market sectors are likely to be targeted by introducing eco-friendly compressor solutions, such as low-GWP refrigerants or alternative energy sources, in response to changing environmental requirements.

Industry participants are going to desire to be wise and flexible over the anticipated period since these difficult attributes position the industry for success in subsequent decades.

Nikhil Kaitwade
Nikhil Kaitwade

Principal Consultant

Talk to Analyst

Find your sweet spots for generating winning opportunities in this market.

Key Trends Influencing the Screw Compressor Market

Rapid Industrialization Skyrockets Global Screw Compressor Demand

The surge in global industrialization has been a significant factor propelling the growth of the screw compressor market. These compressors find wide application in various sectors such as chemical, petrochemical, metal, mining, automotive, and oil and gas industries, offering superior compressed air quality and higher efficiency.

The market expansion is further buoyed by the increasing demand for natural gas, which employs screw compressors for gas transfer, vapor recovery, and flare elimination, among other functions. These compressors are known for their ability to operate under extreme weather conditions, requiring minimal maintenance and resulting in reduced operational costs.

The screw compressor market is also evolving with the advent of energy-efficient and environment-friendly screw compressor variants driven by technological advancements. In addition, the food and beverage packaging sector's growing adoption of these compressors and extensive research and development activities are also expected to contribute to the market's growth in the upcoming decade.

Advancements in Automation and Digitalization Drives Demand for Smart Screw Compressors

The latest developments in automation and digitalization have revolutionized the manufacturing industry, particularly in compressors. Smart screw compressors are now being designed with advanced features such as remote monitoring and predictive maintenance capabilities, allowing for greater efficiency and reduced downtime.

The smart screw compressors are equipped with sensors that collect real-time data on various performance metrics, including temperature, pressure, and power consumption. After that, the data is examined by highly developed algorithms that forecast any problems and notify operators to take corrective action before a malfunction arises.

Consequently, scheduling maintenance chores in advance is possible, reducing the possibility of unanticipated maintenance needs and the necessity for costly, unscheduled downtime. Smart screw compressors are transforming the industry by enabling higher productivity, greater dependability, and lower producer costs.

Emphasis on Energy Efficiency Drives the Demand for Screw Compressors

To save lifetime expenses and guarantee reliable operation, take into account a compressor's energy consumption and compression efficiency while selecting equipment. An efficient compressor is anticipated to run longer, produce less heat, and consume less energy, lowering energy expenses and carbon dioxide emissions. To determine energy loss and compressor efficiency, entropy is essential.

A screw compressor needs to be more operable to produce the same outlet pressure as a theoretical compressor, which has an impact on the compressor's efficiency. Furthermore, the efficiency of a compressor's parts might affect the compressor's overall energy usage.

To choose the most economical and energy-efficient compressor, it is essential to consider its design, compression efficiency, and overall energy usage.

Comparative View of the Adjacent Screw Compressor Market

The section below contrasts and compares the screw compressor market with the automotive air compressor market and the commercial RAC PD compressor market. Focusing on major trends, growth potential, etc., the progress of the markets can be determined.

Screw Compressor Market:

Attributes Screw Compressor Market
CAGR (2024 to 2034) 3.4%
Opportunity Market players can expand their market in multiple industries
Key Trends Rising prevalence of energy-efficient automation drives the screw compressor market

Automotive Air Compressor Market:

Attributes Automotive Air Compressor Market
CAGR (2023 to 2033) 3.4%
Opportunity With growing environmental concerns, there are many opportunities for growth in the automotive air compressor market
Key Trends Automotive air compressors have gained popularity in different automotive areas such as auto manufacturers, repair shops, and at-home mechanics

Commercial RAC PD Compressors Market:

Attributes Commercial RAC PD Compressors Market
CAGR (2023 to 2033) 4.2%
Opportunity Growing technological advancements are expected to boost market expansion in the forthcoming decade
Key Trends The market is expanding due to lower operational costs and better preservation of perishable items

Get the data you need at a Fraction of the cost

Personalize your report by choosing insights you need
and save 40%!

Category-wise Insights

Amplifying Demand for Screw Compressors of Capacity Above 250 HP

Attributes Details
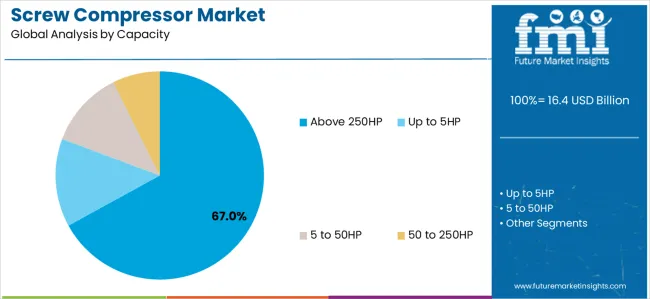
Top Capacity Above 250 HP
Market Share in 2024 67%

Despite being inconsequential, the above 250 HP category is projected to have a 67% market share in the global screw compressor market in 2024. The following drivers can explain the growth of the screw compressors with a capacity of above 250 HP:

  • Screw compressors with capacities above 250 HP are preferred for their ability to handle larger volumes of compressed air, making them suitable for heavy-duty industrial applications.
  • Manufacturing, mining, and oil and gas industries require high-power compressors to meet their substantial air demand for various processes and operations.
  • Larger screw compressors provide higher efficiency, reliability, cost savings, and improved productivity. They maintain stable air pressure and flow rates in critical applications like pneumatic tools and production lines. Their versatility allows them to adapt to diverse industrial environments.
  • As industries strive for greater energy efficiency and sustainability, the demand for high-capacity screw compressors with eco-friendly designs and low energy consumption is expected to rise in the forthcoming decade.

Popularity of Gear-Driven Compressors

Attributes Details
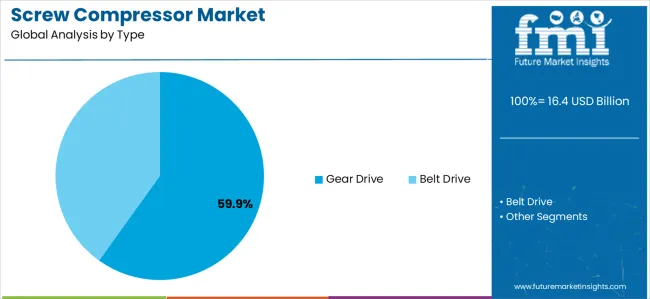
Top Type Gear Drive
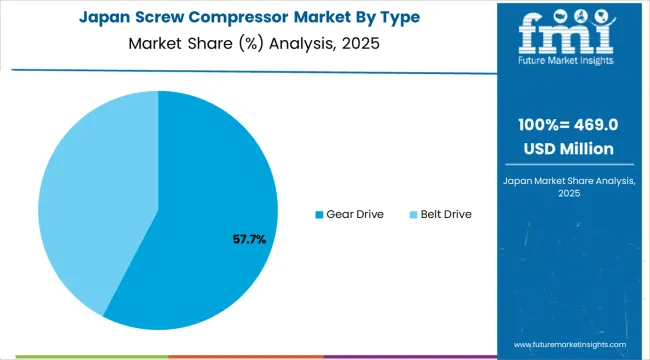
Market Share in 2024 59.9%

Even though it is an insignificant market, the gear drive screw compressors market is expected to reach a 59.9% share in 2024. It is anticipated that the belt drive screw compressor is expected to come next. Several circumstances led to the development of gear-drive screw compressors:

  • Screw compressors with gear drives are strong and dependable, which makes them appropriate for harsh industrial settings where a steady supply of air is essential.
  • Gear-drive screw compressors are becoming more and more popular in industries due to their high efficiency and energy-saving qualities, which eventually translate into lower operating costs.
  • The need for gear drive screw compressors has increased due to improvements in dependability, less maintenance needs, and longer lifespans brought about by advancements in gear technology.
  • Precise control over air production and pressure is made possible by gear drive systems, which is crucial for satisfying the varied requirements of many industrial processes and applications.
  • Space-constrained locations favor gear-drive screw compressors because of their minimal form, which makes them easier to install and integrate into existing industrial systems.
  • Gear-drive screw compressors with low emissions and efficient designs are becoming more and more popular over traditional compressor systems as the industry places a higher priority on environmental responsibility and sustainability.
  • The need for gear-drive screw compressors with sophisticated control systems that enable remote monitoring, predictive maintenance, and compressor operation optimization is being further fueled by investments in automation and smart technologies.

Country-wise Insights

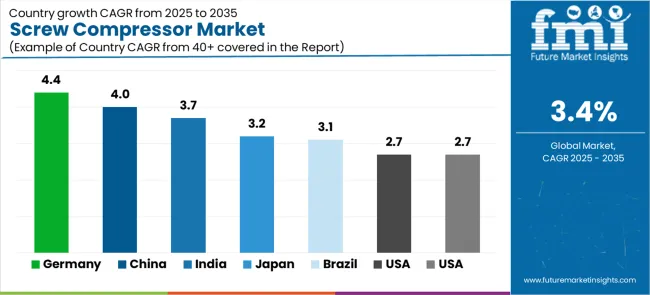
The United States, China, Germany, India, and Australia are some of the most predominant nations on the global stage, and this section is anticipated to gaze at their screw compressor sectors. Examine the several aspects influencing these nations' need for, acceptance of, and interactions with screw compressors via a thorough investigation.

Countries CAGR (2024 to 2034)
United States 2.7%
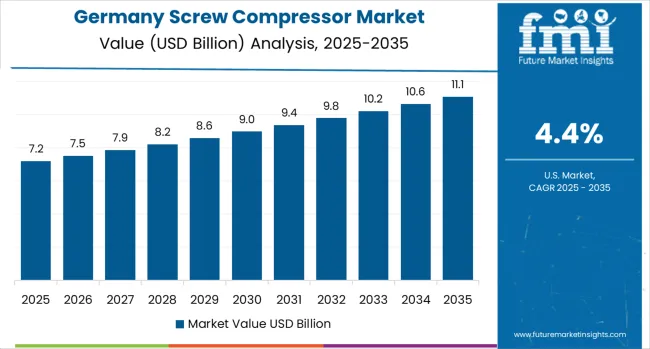
Germany 4.4%
China 4.0%
India 3.7%
Australia 2.7%

Demand for the Rotary Screw Compressors in the United States

Screw compressors are expected to grow substantially in several industries in the United States. This is because there is a growing need for effective, environmentally friendly alternatives to improve machinery processes. Between 2024 and 2034, the United States screw compressor market is projected to grow at a CAGR of 2.7%. These factors are propelling the industry's expansion:

  • The growing need for rotary screw compressors across a range of sectors is expected to propel a significant increase in the United States market for screw compressors in the coming decade.
  • Furthermore, a number of the top market players in the screw compressors sector are based in the United States, which is anticipated to support the market's growth throughout the projected period.
  • To fulfill the changing demands of end customers across various sectors, the United States market leaders are significantly spending on research and development to produce cutting-edge and novel products like oil-free and energy-efficient screw compressors.

Demand for Screw Air Compressors Upsurges in German Automation Industry

Germany is anticipated to record a decent CAGR of 4.4% from 2024 to 2034 in the screw compressor market. The country is slated to develop a significant demand for screw air compressors for automation manufacturing. The following are some of the main trends:

  • For the German automation sector to run pneumatic tools, equipment, and industrial procedures, dependable and effective compressed air systems are necessary.
  • High efficiency, dependability, and a steady supply of air are provided by screw air compressors, which can fulfill the rigorous demands of automation applications in sectors including electronics, machinery manufacture, and automobile manufacturing.
  • Screw air compressors are renowned for their exact control over air production and pressure, which ensures the best possible performance of automated systems. German automation firms place a high value on quality and precision.
  • German automation industry players prefer air compressors with modern features such as variable speed drives and smart control systems due to their ability to respond to changing air demand and maximize energy consumption.

Chinese Screw Compressor Industry Supports Technological Advancements

During the forecast period, the Chinese market for screw compressors is expected to grow at a CAGR of 4.0%. The following are some of the main trends:

  • There is a growing need for screw compressors in Chinese businesses due to the integration of digitalization and Internet of Things (IoT) technologies, which enable the creation of smart screw compressors with features like remote monitoring, predictive maintenance, and optimization.
  • The development of environmentally friendly screw compressor designs and solutions that abide by environmental rules in China is being driven by an emphasis on energy efficiency and sustainability.
  • China develops a strict customer base based on ongoing improvements to product performance, dependability, and longevity via field testing, customer input, and lasting quality assurance procedures.
  • The Chinese screw compressor industry requires investment in talent development and training to foster a qualified workforce that can propel technical innovation and competitiveness.

Indian Screw Compressor Market Witnesses Elevated Demand

The demand for screw compressors in different industries is expected to rise significantly in India. Throughout the projection period, the nation is anticipated to see a CAGR of 3.7%. Among the primary drivers are:

  • In India, stationary air compressors are extensively used in various industries such as oil and gas, food and beverage, automotive, equipment, and manufacturing, owing to their higher capacity and larger power sources than portable products.
  • The screw compressors are designed to store a larger volume of air, and they come with a bigger tanker size, making them ideal for industrial applications that require a constant and steady supply of compressed air.
  • Moreover, stationary air compressors are highly customizable and easier to upgrade with air filters and in-line lubrication than their portable counterparts.
  • With India being one of the fastest-growing countries, the demand for stationary air compressors is expected to increase as urbanization accelerates, making them an essential component of the Indian industrial infrastructure.

Australia’s Screw Air Compressors Demand Swells in Forthcoming Decade

By 2034, Australia is anticipated to need screw air compressors steadily. Over the assessment period, a CAGR of 2.7% is expected. Some of the primary trends are:

  • Screw air compressors are projected to be in high demand as long as the sector continues to develop and spread into new markets and applications, as Australia is a global innovator in automation technology.
  • Screw air compressors are ideal for installation indoors due to their small size and silent operation, which helps automated manufacturing lines and facilities in Australia function effectively.
  • Modern screw air compressors are in high demand because of their energy-saving features and environmentally friendly designs, which are in line with the Australian automation industry's emphasis on sustainability and environmental responsibility.

Establishments Shaping the Outlook of the Screw Compressor Industry

The screw compressor industry has witnessed a surge in acquisition and growth operations aimed at fortifying the supply chain. Manufacturers strategically acquire complementary industries or expand their operations to enhance production capacity and streamline distribution channels.

This consolidation trend is driven by the desire to gain a competitive edge, improve market presence, and meet the growing demand for screw compressors across various sectors.

Furthermore, screw compressor manufacturers are actively engaged in research and development efforts to advance technological capabilities and address emerging challenges. One area of focus is the enhancement of oil-lubricated compressors to withstand oil obstruction, a common issue that can affect performance and reliability.

Through innovative design and engineering solutions, manufacturers aim to optimize oil circulation, mitigate obstructions, and prolong the lifespan of oil-lubricated screw compressors.

There is a notable shift towards developing electric compressors to align with environmental safety standards and sustainability goals. By transitioning from traditional oil-lubricated compressors to electric models, manufacturers can reduce dependency on fossil fuels, minimize carbon emissions, and enhance overall environmental performance.

Electric screw compressors offer advantages such as improved energy efficiency, reduced maintenance requirements, and lower environmental impact, making them increasingly attractive to environmentally-conscious industries and consumers.

The surge in acquisition and growth operations, coupled with advancements in technology, reflects the dynamic evolution of the screw compressor industry. As manufacturers continue to innovate and adapt to changing market demands, the future of screw compressors appears poised for continued expansion and advancement in the forthcoming decade.

Recent Developments in the Screw Compressor Industry

  • In February 2024, Elgi Equipments, a leading air compressor manufacturer, showcased its PG 550-215 trolley-mounted portable screw air compressor at India Stonemart 2024. The company also showcased its electric-powered PG110 E, PG 55 E, and PG 75 E portable air compressors for the mining industry.
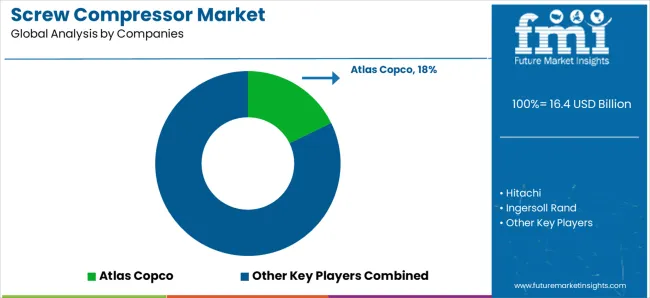
  • In December 2023, Atlas Copco launched the B-Air, the first portable screw air compressor powered by batteries, marking a significant step towards carbon-free industries. The 55-kWh battery offers a stable flow rate and pressure range, allowing it to operate without fuel or power. Switching to an electric motor reduces repair costs and energy consumption with a permanent magnet motor and variable speed drive.
  • In October 2023, CompAir, a global provider of energy-efficient compressors, dryers, and accessories, launched its latest RL series, the RL30-160 oil-lubricated screw compressor, showcasing its commitment to providing reliable, cost-effective solutions.
  • In October 2023, Kaishan USA, a leading manufacturer of industrial air compressors, introduced the KROF series at CABP Expo 2023 / Process Expo 2023. This two-stage oil-free rotary screw air compressor offers high-quality, ISO 8573-1 Class 0 oil-free compressed air suitable for sensitive applications. Its technical depth is anticipated to benefit plant managers and food and beverage industry operators.

Key Companies in the Screw Compressor Market

  • Atlas Copco
  • Hitachi
  • Ingersoll Rand
  • Emerson Electric Co.
  • Daikin Industries Ltd
  • Siemens
  • KOBELCO
  • IHI Rotating Machinery
  • KAESER
  • Boge Kompressoren
  • Quincy
  • ELGi
  • Anest IWATA
  • Fusheng
  • Sullair
  • Howden
  • BAC Compressor
  • Alup Kompressoren
  • Indo-Air Compressors Pvt. Ltd.
  • Eaton Compressor
  • Comp Air United Kingdom
  • GESO
  • ADEKOM (ASIA PACIFIC) LIMITED

Key Coverage in the Screw Compressor Market Report

  • Screw Compressor Market Graph Analysis
  • Development of the Screw Compressor Market in the United States
  • Top 10 Screw Compressor Manufacturers
  • Assessment of Working Principle of Single Screw Compressor
  • Price Analysis Between Multi-Stage Compressor And One-Stage Compressor
  • Assembly of Screw Air Compressor Parts
  • Study of Basic Principles of a Screw Compressor

Key Market Segmentation

By Capacity:

  • Up to 5HP
  • 5 to 50HP
  • 50 to 250HP
  • Above 250HP

By Technology:

  • Stationary
    • Oil Lubricated
    • Oil-Free
  • Portable
    • Oil Lubricated
    • Oil-Free

By Stage:

  • Single Stage
  • Two-Stage
  • Multi-Stage

By Driver Type:

  • Liquid Driven
  • Gas Driven
  • Electric

By Type:

  • Belt Drive
  • Gear Drive

By End-Use:

  • Oil and Gas Industry
  • Chemical Industry
  • Energy and Transmission
  • Automotive and Aerospace
  • Mining and Minerals
  • Other Manufacturing Industry

By Region:

  • North America
  • Latin America
  • Europe
  • East Asia
  • South Asia
  • Oceania
  • Middle East and Africa

Frequently Asked Questions

How Big is the Screw Compressors Market in 2024?

The screw compressor market is expected to be valued at US$ 15.82 billion in 2024.

Which is the Top Screw Compressor Type?

The gear-driven screw compressor type leads the screw compressor market.

Which Country Dominates the Screw Compressor Market?

The global screw compressor market is controlled by the United States, China, Germany, India, and Australia.

What is the Screw Compressor Market Growth Outlook by 2034?

The global screw compressor market is anticipated to surpass US$ 22.10 billion by 2034.

What is the Sales Outlook for Screw Compressors from 2024 to 2034?

The screw compressor industry is anticipated to grow at a CAGR of 3.4% from 2024 to 2034.

Table of Content
1. Executive Summary

    1.1. Global Market Outlook

    1.2. Demand-side Trends

    1.3. Supply-side Trends

    1.4. Technology Roadmap Analysis

    1.5. Analysis and Recommendations

2. Market Overview

    2.1. Market Coverage / Taxonomy

    2.2. Market Definition / Scope / Limitations

3. Market Background

    3.1. Market Dynamics

        3.1.1. Drivers

        3.1.2. Restraints

        3.1.3. Opportunity

        3.1.4. Trends

    3.2. Scenario Forecast

        3.2.1. Demand in Optimistic Scenario

        3.2.2. Demand in Likely Scenario

        3.2.3. Demand in Conservative Scenario

    3.3. Opportunity Map Analysis

    3.4. Product Life Cycle Analysis

    3.5. Supply Chain Analysis

        3.5.1. Supply Side Participants and their Roles

            3.5.1.1. Producers

            3.5.1.2. Mid-Level Participants (Traders/ Agents/ Brokers)

            3.5.1.3. Wholesalers and Distributors

        3.5.2. Value Added and Value Created at Node in the Supply Chain

        3.5.3. List of Raw Material Suppliers

        3.5.4. List of Existing and Potential Buyer’s

    3.6. Investment Feasibility Matrix

    3.7. Value Chain Analysis

        3.7.1. Profit Margin Analysis

        3.7.2. Wholesalers and Distributors

        3.7.3. Retailers

    3.8. PESTLE and Porter’s Analysis

    3.9. Regulatory Landscape

        3.9.1. By Key Regions

        3.9.2. By Key Countries

    3.10. Regional Parent Market Outlook

    3.11. Production and Consumption Statistics

    3.12. Import and Export Statistics

4. Global Market Analysis 2019 to 2023 and Forecast, 2024 to 2034

    4.1. Historical Market Size Value (US$ Million) & Volume (Units) Analysis, 2019 to 2023

    4.2. Current and Future Market Size Value (US$ Million) & Volume (Units) Projections, 2024 to 2034

        4.2.1. Y-o-Y Growth Trend Analysis

        4.2.2. Absolute $ Opportunity Analysis

5. Global Market Analysis 2019 to 2023 and Forecast 2024 to 2034, By Type

    5.1. Introduction / Key Findings

    5.2. Historical Market Size Value (US$ Million) & Volume (Units) Analysis By Type, 2019 to 2023

    5.3. Current and Future Market Size Value (US$ Million) & Volume (Units) Analysis and Forecast By Type, 2024 to 2034

        5.3.1. Belt Drive

        5.3.2. Gear Drive

    5.4. Y-o-Y Growth Trend Analysis By Type, 2019 to 2023

    5.5. Absolute $ Opportunity Analysis By Type, 2024 to 2034

6. Global Market Analysis 2019 to 2023 and Forecast 2024 to 2034, By Technology

    6.1. Introduction / Key Findings

    6.2. Historical Market Size Value (US$ Million) & Volume (Units) Analysis By Technology, 2019 to 2023

    6.3. Current and Future Market Size Value (US$ Million) & Volume (Units) Analysis and Forecast By Technology, 2024 to 2034

        6.3.1. Stationary

            6.3.1.1. Oil Lubricated

            6.3.1.2. Oil-Free

        6.3.2. Portable

            6.3.2.1. Oil Lubricated

            6.3.2.2. Oil-Free

    6.4. Y-o-Y Growth Trend Analysis By Technology, 2019 to 2023

    6.5. Absolute $ Opportunity Analysis By Technology, 2024 to 2034

7. Global Market Analysis 2019 to 2023 and Forecast 2024 to 2034, By Stage

    7.1. Introduction / Key Findings

    7.2. Historical Market Size Value (US$ Million) & Volume (Units) Analysis By Stage, 2019 to 2023

    7.3. Current and Future Market Size Value (US$ Million) & Volume (Units) Analysis and Forecast By Stage, 2024 to 2034

        7.3.1. Single Stage

        7.3.2. Two-Stage

        7.3.3. Multi-Stage

    7.4. Y-o-Y Growth Trend Analysis By Stage, 2019 to 2023

    7.5. Absolute $ Opportunity Analysis By Stage, 2024 to 2034

8. Global Market Analysis 2019 to 2023 and Forecast 2024 to 2034, By Driver Type

    8.1. Introduction / Key Findings

    8.2. Historical Market Size Value (US$ Million) & Volume (Units) Analysis By Driver Type, 2019 to 2023

    8.3. Current and Future Market Size Value (US$ Million) & Volume (Units) Analysis and Forecast By Driver Type, 2024 to 2034

        8.3.1. Liquid Driven

        8.3.2. Gas Driven

        8.3.3. Electric

    8.4. Y-o-Y Growth Trend Analysis By Driver Type, 2019 to 2023

    8.5. Absolute $ Opportunity Analysis By Driver Type, 2024 to 2034

9. Global Market Analysis 2019 to 2023 and Forecast 2024 to 2034, By Capacity

    9.1. Introduction / Key Findings

    9.2. Historical Market Size Value (US$ Million) & Volume (Units) Analysis By Capacity, 2019 to 2023

    9.3. Current and Future Market Size Value (US$ Million) & Volume (Units) Analysis and Forecast By Capacity, 2024 to 2034

        9.3.1. Up to 5HP

        9.3.2. 5 to 50HP

        9.3.3. 50 to 250HP

        9.3.4. Above 250HP

    9.4. Y-o-Y Growth Trend Analysis By Capacity, 2019 to 2023

    9.5. Absolute $ Opportunity Analysis By Capacity, 2024 to 2034

10. Global Market Analysis 2019 to 2023 and Forecast 2024 to 2034, By End-Use

    10.1. Introduction / Key Findings

    10.2. Historical Market Size Value (US$ Million) & Volume (Units) Analysis By End-Use, 2019 to 2023

    10.3. Current and Future Market Size Value (US$ Million) & Volume (Units) Analysis and Forecast By End-Use, 2024 to 2034

        10.3.1. Oil and Gas Industry

        10.3.2. Chemical Industry

        10.3.3. Energy and Transmission

        10.3.4. Automotive and Aerospace

        10.3.5. Mining and Minerals

        10.3.6. Other

    10.4. Y-o-Y Growth Trend Analysis By End-Use, 2019 to 2023

    10.5. Absolute $ Opportunity Analysis By End-Use, 2024 to 2034

11. Global Market Analysis 2019 to 2023 and Forecast 2024 to 2034, By Region

    11.1. Introduction

    11.2. Historical Market Size Value (US$ Million) & Volume (Units) Analysis By Region, 2019 to 2023

    11.3. Current Market Size Value (US$ Million) & Volume (Units) Analysis and Forecast By Region, 2024 to 2034

        11.3.1. North America

        11.3.2. Latin America

        11.3.3. Western Europe

        11.3.4. Eastern Europe

        11.3.5. South Asia and Pacific

        11.3.6. East Asia

        11.3.7. Middle East and Africa

    11.4. Market Attractiveness Analysis By Region

12. North America Market Analysis 2019 to 2023 and Forecast 2024 to 2034, By Country

    12.1. Historical Market Size Value (US$ Million) & Volume (Units) Trend Analysis By Market Taxonomy, 2019 to 2023

    12.2. Market Size Value (US$ Million) & Volume (Units) Forecast By Market Taxonomy, 2024 to 2034

        12.2.1. By Country

            12.2.1.1. USA

            12.2.1.2. Canada

        12.2.2. By Type

        12.2.3. By Technology

        12.2.4. By Stage

        12.2.5. By Driver Type

        12.2.6. By Capacity

        12.2.7. By End-Use

    12.3. Market Attractiveness Analysis

        12.3.1. By Country

        12.3.2. By Type

        12.3.3. By Technology

        12.3.4. By Stage

        12.3.5. By Driver Type

        12.3.6. By Capacity

        12.3.7. By End-Use

    12.4. Key Takeaways

13. Latin America Market Analysis 2019 to 2023 and Forecast 2024 to 2034, By Country

    13.1. Historical Market Size Value (US$ Million) & Volume (Units) Trend Analysis By Market Taxonomy, 2019 to 2023

    13.2. Market Size Value (US$ Million) & Volume (Units) Forecast By Market Taxonomy, 2024 to 2034

        13.2.1. By Country

            13.2.1.1. Brazil

            13.2.1.2. Mexico

            13.2.1.3. Rest of Latin America

        13.2.2. By Type

        13.2.3. By Technology

        13.2.4. By Stage

        13.2.5. By Driver Type

        13.2.6. By Capacity

        13.2.7. By End-Use

    13.3. Market Attractiveness Analysis

        13.3.1. By Country

        13.3.2. By Type

        13.3.3. By Technology

        13.3.4. By Stage

        13.3.5. By Driver Type

        13.3.6. By Capacity

        13.3.7. By End-Use

    13.4. Key Takeaways

14. Western Europe Market Analysis 2019 to 2023 and Forecast 2024 to 2034, By Country

    14.1. Historical Market Size Value (US$ Million) & Volume (Units) Trend Analysis By Market Taxonomy, 2019 to 2023

    14.2. Market Size Value (US$ Million) & Volume (Units) Forecast By Market Taxonomy, 2024 to 2034

        14.2.1. By Country

            14.2.1.1. Germany

            14.2.1.2. UK

            14.2.1.3. France

            14.2.1.4. Spain

            14.2.1.5. Italy

            14.2.1.6. Rest of Western Europe

        14.2.2. By Type

        14.2.3. By Technology

        14.2.4. By Stage

        14.2.5. By Driver Type

        14.2.6. By Capacity

        14.2.7. By End-Use

    14.3. Market Attractiveness Analysis

        14.3.1. By Country

        14.3.2. By Type

        14.3.3. By Technology

        14.3.4. By Stage

        14.3.5. By Driver Type

        14.3.6. By Capacity

        14.3.7. By End-Use

    14.4. Key Takeaways

15. Eastern Europe Market Analysis 2019 to 2023 and Forecast 2024 to 2034, By Country

    15.1. Historical Market Size Value (US$ Million) & Volume (Units) Trend Analysis By Market Taxonomy, 2019 to 2023

    15.2. Market Size Value (US$ Million) & Volume (Units) Forecast By Market Taxonomy, 2024 to 2034

        15.2.1. By Country

            15.2.1.1. Poland

            15.2.1.2. Russia

            15.2.1.3. Czech Republic

            15.2.1.4. Romania

            15.2.1.5. Rest of Eastern Europe

        15.2.2. By Type

        15.2.3. By Technology

        15.2.4. By Stage

        15.2.5. By Driver Type

        15.2.6. By Capacity

        15.2.7. By End-Use

    15.3. Market Attractiveness Analysis

        15.3.1. By Country

        15.3.2. By Type

        15.3.3. By Technology

        15.3.4. By Stage

        15.3.5. By Driver Type

        15.3.6. By Capacity

        15.3.7. By End-Use

    15.4. Key Takeaways

16. South Asia and Pacific Market Analysis 2019 to 2023 and Forecast 2024 to 2034, By Country

    16.1. Historical Market Size Value (US$ Million) & Volume (Units) Trend Analysis By Market Taxonomy, 2019 to 2023

    16.2. Market Size Value (US$ Million) & Volume (Units) Forecast By Market Taxonomy, 2024 to 2034

        16.2.1. By Country

            16.2.1.1. India

            16.2.1.2. Bangladesh

            16.2.1.3. Australia

            16.2.1.4. New Zealand

            16.2.1.5. Rest of South Asia and Pacific

        16.2.2. By Type

        16.2.3. By Technology

        16.2.4. By Stage

        16.2.5. By Driver Type

        16.2.6. By Capacity

        16.2.7. By End-Use

    16.3. Market Attractiveness Analysis

        16.3.1. By Country

        16.3.2. By Type

        16.3.3. By Technology

        16.3.4. By Stage

        16.3.5. By Driver Type

        16.3.6. By Capacity

        16.3.7. By End-Use

    16.4. Key Takeaways

17. East Asia Market Analysis 2019 to 2023 and Forecast 2024 to 2034, By Country

    17.1. Historical Market Size Value (US$ Million) & Volume (Units) Trend Analysis By Market Taxonomy, 2019 to 2023

    17.2. Market Size Value (US$ Million) & Volume (Units) Forecast By Market Taxonomy, 2024 to 2034

        17.2.1. By Country

            17.2.1.1. China

            17.2.1.2. Japan

            17.2.1.3. South Korea

        17.2.2. By Type

        17.2.3. By Technology

        17.2.4. By Stage

        17.2.5. By Driver Type

        17.2.6. By Capacity

        17.2.7. By End-Use

    17.3. Market Attractiveness Analysis

        17.3.1. By Country

        17.3.2. By Type

        17.3.3. By Technology

        17.3.4. By Stage

        17.3.5. By Driver Type

        17.3.6. By Capacity

        17.3.7. By End-Use

    17.4. Key Takeaways

18. Middle East and Africa Market Analysis 2019 to 2023 and Forecast 2024 to 2034, By Country

    18.1. Historical Market Size Value (US$ Million) & Volume (Units) Trend Analysis By Market Taxonomy, 2019 to 2023

    18.2. Market Size Value (US$ Million) & Volume (Units) Forecast By Market Taxonomy, 2024 to 2034

        18.2.1. By Country

            18.2.1.1. GCC Countries

            18.2.1.2. South Africa

            18.2.1.3. Israel

            18.2.1.4. Rest of MEA

        18.2.2. By Type

        18.2.3. By Technology

        18.2.4. By Stage

        18.2.5. By Driver Type

        18.2.6. By Capacity

        18.2.7. By End-Use

    18.3. Market Attractiveness Analysis

        18.3.1. By Country

        18.3.2. By Type

        18.3.3. By Technology

        18.3.4. By Stage

        18.3.5. By Driver Type

        18.3.6. By Capacity

        18.3.7. By End-Use

    18.4. Key Takeaways

19. Key Countries Market Analysis

    19.1. USA

        19.1.1. Pricing Analysis

        19.1.2. Market Share Analysis, 2023

            19.1.2.1. By Type

            19.1.2.2. By Technology

            19.1.2.3. By Stage

            19.1.2.4. By Driver Type

            19.1.2.5. By Capacity

            19.1.2.6. By End-Use

    19.2. Canada

        19.2.1. Pricing Analysis

        19.2.2. Market Share Analysis, 2023

            19.2.2.1. By Type

            19.2.2.2. By Technology

            19.2.2.3. By Stage

            19.2.2.4. By Driver Type

            19.2.2.5. By Capacity

            19.2.2.6. By End-Use

    19.3. Brazil

        19.3.1. Pricing Analysis

        19.3.2. Market Share Analysis, 2023

            19.3.2.1. By Type

            19.3.2.2. By Technology

            19.3.2.3. By Stage

            19.3.2.4. By Driver Type

            19.3.2.5. By Capacity

            19.3.2.6. By End-Use

    19.4. Mexico

        19.4.1. Pricing Analysis

        19.4.2. Market Share Analysis, 2023

            19.4.2.1. By Type

            19.4.2.2. By Technology

            19.4.2.3. By Stage

            19.4.2.4. By Driver Type

            19.4.2.5. By Capacity

            19.4.2.6. By End-Use

    19.5. Germany

        19.5.1. Pricing Analysis

        19.5.2. Market Share Analysis, 2023

            19.5.2.1. By Type

            19.5.2.2. By Technology

            19.5.2.3. By Stage

            19.5.2.4. By Driver Type

            19.5.2.5. By Capacity

            19.5.2.6. By End-Use

    19.6. UK

        19.6.1. Pricing Analysis

        19.6.2. Market Share Analysis, 2023

            19.6.2.1. By Type

            19.6.2.2. By Technology

            19.6.2.3. By Stage

            19.6.2.4. By Driver Type

            19.6.2.5. By Capacity

            19.6.2.6. By End-Use

    19.7. France

        19.7.1. Pricing Analysis

        19.7.2. Market Share Analysis, 2023

            19.7.2.1. By Type

            19.7.2.2. By Technology

            19.7.2.3. By Stage

            19.7.2.4. By Driver Type

            19.7.2.5. By Capacity

            19.7.2.6. By End-Use

    19.8. Spain

        19.8.1. Pricing Analysis

        19.8.2. Market Share Analysis, 2023

            19.8.2.1. By Type

            19.8.2.2. By Technology

            19.8.2.3. By Stage

            19.8.2.4. By Driver Type

            19.8.2.5. By Capacity

            19.8.2.6. By End-Use

    19.9. Italy

        19.9.1. Pricing Analysis

        19.9.2. Market Share Analysis, 2023

            19.9.2.1. By Type

            19.9.2.2. By Technology

            19.9.2.3. By Stage

            19.9.2.4. By Driver Type

            19.9.2.5. By Capacity

            19.9.2.6. By End-Use

    19.10. Poland

        19.10.1. Pricing Analysis

        19.10.2. Market Share Analysis, 2023

            19.10.2.1. By Type

            19.10.2.2. By Technology

            19.10.2.3. By Stage

            19.10.2.4. By Driver Type

            19.10.2.5. By Capacity

            19.10.2.6. By End-Use

    19.11. Russia

        19.11.1. Pricing Analysis

        19.11.2. Market Share Analysis, 2023

            19.11.2.1. By Type

            19.11.2.2. By Technology

            19.11.2.3. By Stage

            19.11.2.4. By Driver Type

            19.11.2.5. By Capacity

            19.11.2.6. By End-Use

    19.12. Czech Republic

        19.12.1. Pricing Analysis

        19.12.2. Market Share Analysis, 2023

            19.12.2.1. By Type

            19.12.2.2. By Technology

            19.12.2.3. By Stage

            19.12.2.4. By Driver Type

            19.12.2.5. By Capacity

            19.12.2.6. By End-Use

    19.13. Romania

        19.13.1. Pricing Analysis

        19.13.2. Market Share Analysis, 2023

            19.13.2.1. By Type

            19.13.2.2. By Technology

            19.13.2.3. By Stage

            19.13.2.4. By Driver Type

            19.13.2.5. By Capacity

            19.13.2.6. By End-Use

    19.14. India

        19.14.1. Pricing Analysis

        19.14.2. Market Share Analysis, 2023

            19.14.2.1. By Type

            19.14.2.2. By Technology

            19.14.2.3. By Stage

            19.14.2.4. By Driver Type

            19.14.2.5. By Capacity

            19.14.2.6. By End-Use

    19.15. Bangladesh

        19.15.1. Pricing Analysis

        19.15.2. Market Share Analysis, 2023

            19.15.2.1. By Type

            19.15.2.2. By Technology

            19.15.2.3. By Stage

            19.15.2.4. By Driver Type

            19.15.2.5. By Capacity

            19.15.2.6. By End-Use

    19.16. Australia

        19.16.1. Pricing Analysis

        19.16.2. Market Share Analysis, 2023

            19.16.2.1. By Type

            19.16.2.2. By Technology

            19.16.2.3. By Stage

            19.16.2.4. By Driver Type

            19.16.2.5. By Capacity

            19.16.2.6. By End-Use

    19.17. New Zealand

        19.17.1. Pricing Analysis

        19.17.2. Market Share Analysis, 2023

            19.17.2.1. By Type

            19.17.2.2. By Technology

            19.17.2.3. By Stage

            19.17.2.4. By Driver Type

            19.17.2.5. By Capacity

            19.17.2.6. By End-Use

    19.18. China

        19.18.1. Pricing Analysis

        19.18.2. Market Share Analysis, 2023

            19.18.2.1. By Type

            19.18.2.2. By Technology

            19.18.2.3. By Stage

            19.18.2.4. By Driver Type

            19.18.2.5. By Capacity

            19.18.2.6. By End-Use

    19.19. Japan

        19.19.1. Pricing Analysis

        19.19.2. Market Share Analysis, 2023

            19.19.2.1. By Type

            19.19.2.2. By Technology

            19.19.2.3. By Stage

            19.19.2.4. By Driver Type

            19.19.2.5. By Capacity

            19.19.2.6. By End-Use

    19.20. South Korea

        19.20.1. Pricing Analysis

        19.20.2. Market Share Analysis, 2023

            19.20.2.1. By Type

            19.20.2.2. By Technology

            19.20.2.3. By Stage

            19.20.2.4. By Driver Type

            19.20.2.5. By Capacity

            19.20.2.6. By End-Use

    19.21. GCC Countries

        19.21.1. Pricing Analysis

        19.21.2. Market Share Analysis, 2023

            19.21.2.1. By Type

            19.21.2.2. By Technology

            19.21.2.3. By Stage

            19.21.2.4. By Driver Type

            19.21.2.5. By Capacity

            19.21.2.6. By End-Use

    19.22. South Africa

        19.22.1. Pricing Analysis

        19.22.2. Market Share Analysis, 2023

            19.22.2.1. By Type

            19.22.2.2. By Technology

            19.22.2.3. By Stage

            19.22.2.4. By Driver Type

            19.22.2.5. By Capacity

            19.22.2.6. By End-Use

    19.23. Israel

        19.23.1. Pricing Analysis

        19.23.2. Market Share Analysis, 2023

            19.23.2.1. By Type

            19.23.2.2. By Technology

            19.23.2.3. By Stage

            19.23.2.4. By Driver Type

            19.23.2.5. By Capacity

            19.23.2.6. By End-Use

20. Market Structure Analysis

    20.1. Competition Dashboard

    20.2. Competition Benchmarking

    20.3. Market Share Analysis of Top Players

        20.3.1. By Regional

        20.3.2. By Type

        20.3.3. By Technology

        20.3.4. By Stage

        20.3.5. By Driver Type

        20.3.6. By Capacity

        20.3.7. By End-Use

21. Competition Analysis

    21.1. Competition Deep Dive

        21.1.1. Atlas Copco

            21.1.1.1. Overview

            21.1.1.2. Product Portfolio

            21.1.1.3. Profitability by Market Segments

            21.1.1.4. Sales Footprint

            21.1.1.5. Strategy Overview

                21.1.1.5.1. Marketing Strategy

                21.1.1.5.2. Product Strategy

                21.1.1.5.3. Channel Strategy

        21.1.2. Hitachi

            21.1.2.1. Overview

            21.1.2.2. Product Portfolio

            21.1.2.3. Profitability by Market Segments

            21.1.2.4. Sales Footprint

            21.1.2.5. Strategy Overview

                21.1.2.5.1. Marketing Strategy

                21.1.2.5.2. Product Strategy

                21.1.2.5.3. Channel Strategy

        21.1.3. Ingersoll Rand

            21.1.3.1. Overview

            21.1.3.2. Product Portfolio

            21.1.3.3. Profitability by Market Segments

            21.1.3.4. Sales Footprint

            21.1.3.5. Strategy Overview

                21.1.3.5.1. Marketing Strategy

                21.1.3.5.2. Product Strategy

                21.1.3.5.3. Channel Strategy

        21.1.4. Emerson Electric Co.

            21.1.4.1. Overview

            21.1.4.2. Product Portfolio

            21.1.4.3. Profitability by Market Segments

            21.1.4.4. Sales Footprint

            21.1.4.5. Strategy Overview

                21.1.4.5.1. Marketing Strategy

                21.1.4.5.2. Product Strategy

                21.1.4.5.3. Channel Strategy

        21.1.5. Daikin Industries Ltd

            21.1.5.1. Overview

            21.1.5.2. Product Portfolio

            21.1.5.3. Profitability by Market Segments

            21.1.5.4. Sales Footprint

            21.1.5.5. Strategy Overview

                21.1.5.5.1. Marketing Strategy

                21.1.5.5.2. Product Strategy

                21.1.5.5.3. Channel Strategy

        21.1.6. Siemens

            21.1.6.1. Overview

            21.1.6.2. Product Portfolio

            21.1.6.3. Profitability by Market Segments

            21.1.6.4. Sales Footprint

            21.1.6.5. Strategy Overview

                21.1.6.5.1. Marketing Strategy

                21.1.6.5.2. Product Strategy

                21.1.6.5.3. Channel Strategy

        21.1.7. Indo-Air Compressors Pvt. Ltd.

            21.1.7.1. Overview

            21.1.7.2. Product Portfolio

            21.1.7.3. Profitability by Market Segments

            21.1.7.4. Sales Footprint

            21.1.7.5. Strategy Overview

                21.1.7.5.1. Marketing Strategy

                21.1.7.5.2. Product Strategy

                21.1.7.5.3. Channel Strategy

        21.1.8. IHI Rotating Machinery

            21.1.8.1. Overview

            21.1.8.2. Product Portfolio

            21.1.8.3. Profitability by Market Segments

            21.1.8.4. Sales Footprint

            21.1.8.5. Strategy Overview

                21.1.8.5.1. Marketing Strategy

                21.1.8.5.2. Product Strategy

                21.1.8.5.3. Channel Strategy

        21.1.9. KAESER

            21.1.9.1. Overview

            21.1.9.2. Product Portfolio

            21.1.9.3. Profitability by Market Segments

            21.1.9.4. Sales Footprint

            21.1.9.5. Strategy Overview

                21.1.9.5.1. Marketing Strategy

                21.1.9.5.2. Product Strategy

                21.1.9.5.3. Channel Strategy

        21.1.10. Boge Kompressoren

            21.1.10.1. Overview

            21.1.10.2. Product Portfolio

            21.1.10.3. Profitability by Market Segments

            21.1.10.4. Sales Footprint

            21.1.10.5. Strategy Overview

                21.1.10.5.1. Marketing Strategy

                21.1.10.5.2. Product Strategy

                21.1.10.5.3. Channel Strategy

        21.1.11. Quincy

            21.1.11.1. Overview

            21.1.11.2. Product Portfolio

            21.1.11.3. Profitability by Market Segments

            21.1.11.4. Sales Footprint

            21.1.11.5. Strategy Overview

                21.1.11.5.1. Marketing Strategy

                21.1.11.5.2. Product Strategy

                21.1.11.5.3. Channel Strategy

22. Assumptions & Acronyms Used

23. Research Methodology
Recommendations

Industrial Automation

Commercial RAC PD Compressor Market

February 2022

REP-GB-10341

July 2023

348 pages

Automotive

Automotive Air Compressor Market

September 2024

REP-GB-12923

Upcoming

Explore Industrial Automation Insights

View Reports