Pedicle Screw Positioning Market Size, Share & Forecast Outlook 2025 to 2035

The pedicle screw positioning market is to be valued at USD 1.3 billion in 2025 and is anticipated to reach USD 2.1 billion by 2035, with a CAGR of 4.7%. Industry growth is being driven by the rising incidence of spinal deformities, degenerative disc diseases, and trauma, all of which require precise spinal-fixation solutions.
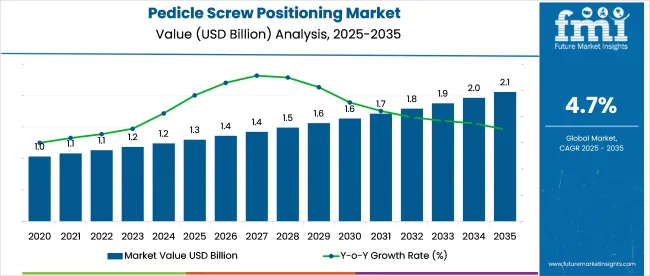
Quick Stats of the Pedicle Screw Positioning Market

  • Industry Size (2025): USD 1.3 billion
  • Industry Value (2035): USD 2.1 billion
  • Forecast CAGR (2025 to 2035): 4.7%
  • Leading Segment: Conventional Freehand Systems (39.6%)
  • Key Growth Region: Asia Pacific (India)
  • Key Players: Globus Medical, Zimmer Biomet, DePuySynthes (Johnson & Johnson), Stryker Corporation, and B. Braun Melsungen AG

Pedicle Screw Positioning Market

Accuracy in screw placement is being enhanced through minimally invasive surgical methods, intraoperative navigation systems, and robotic assistance, which are increasingly seeing adoption in leading spine centers. Competitive edge is now being claimed by firms investing in smart instrumentation and real-time imaging.

It is argued that failure to scale surgeon education on navigation-assisted techniques could hamper adoption, even as early-standardizing regions are predicted to capture longer-term clinical and cost-efficiency gains.

During Medtronic's Q3 FY24 earnings call on February 20, 2024, Geoff Martha, CEO of Medtronic, addressed the company’s core technology in the spine surgery space, stating, “Our Mazor robotic guidance system continues to drive adoption in spine surgery... Surgeons rely on its precision for accurate screw placement, reducing variability and improving patient outcomes.

This technology is critical to our leadership in procedural solutions.” This statement highlights the increasing reliance on precision tools, particularly in pedicle screw insertion, reflecting the industry’s demand for accurate, efficient, and effective surgical technologies within the spine robotics sector.

The industry holds a specialized share within its parent markets. In the orthopedic devices market, it accounts for approximately 3-5%, as pedicle screws are just one of many devices used for treating musculoskeletal and spinal conditions. Within the spinal surgery market, its share is around 15-20%, driven by the critical role of pedicle screws in spinal fusion and other corrective procedures.

In the medical devices market, the share is about 2-3%, as pedicle screw positioning systems are part of a broad range of surgical tools. In the minimally invasive surgery market, the share is around 5-7%, reflecting the increasing use of pedicle screw systems in less invasive spine surgeries. In the surgical instruments market, its share is approximately 4-6%, as it is an essential component for spinal procedures requiring precise screw placement.

Analyzing Pedicle Screw Positioning Market by Top Investment Segments

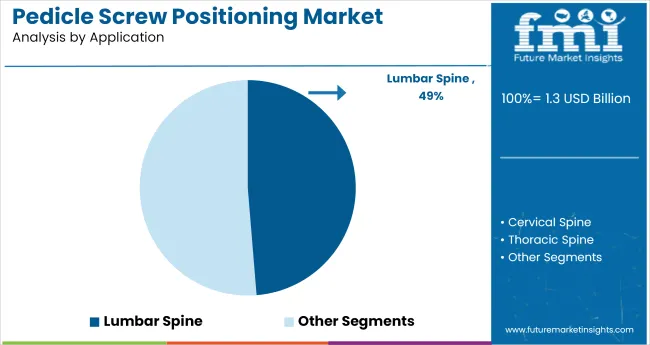
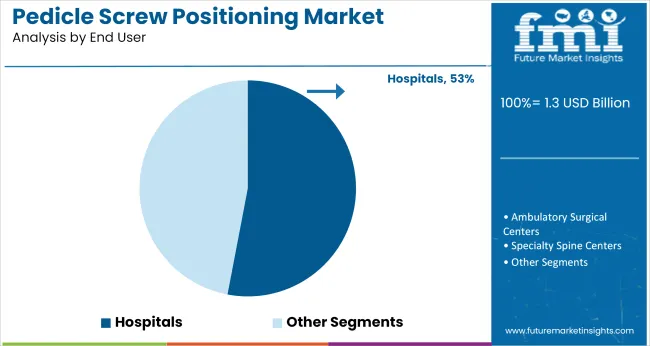
The industry is expected to grow, with conventional freehand systems leading the navigation segment at 39.6% industry share. Lumbar spine applications will dominate the application segment with 48.7%, while hospitals will remain the primary end-user, capturing 53% of the industry share.
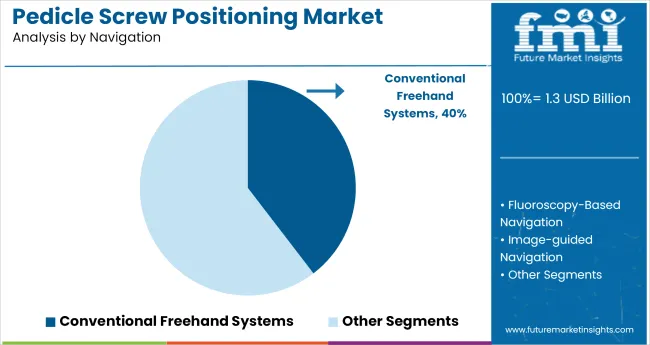
Conventional Freehand Systems Hold the Largest Share in Navigation Segment at 39.6%

Pedicle Screw Positioning Market Analysis By Navigation

Conventional freehand systems are projected to capture 39.6% of the industry in 2025. These systems are widely used in spinal surgeries due to their ease of use and cost-effectiveness. Conventional freehand techniques rely on the surgeon’s skill and experience to accurately position the screws without the need for advanced navigation technologies.

Despite the increasing adoption of robotic and computer-assisted systems, conventional freehand systems continue to hold a significant industry share, especially in regions where advanced systems are less accessible or cost-prohibitive.
  • Cost-effective and easy to use, preferred in many spinal surgeries
  • Surgeons' skill and experience are critical in ensuring accurate screw placement
  • Continued dominance in regions with limited access to advanced navigation technologies

Lumbar Spine Applications Capture the Majority of the Industry with 48.7% Share

Pedicle Screw Positioning Market Analysis By Application

Lumbar spine applications are expected to account for 48.7% of the industry in 2025. The lumbar spine is a critical area in spinal surgeries, and accurate screw placement is essential for stabilizing the spine, reducing pain, and restoring mobility.

Pedicle screw fixation is commonly used for treating lumbar spinal conditions, including fractures, degenerative diseases, and deformities. The demand for pedicle screw positioning in lumbar spine applications is driven by the growing prevalence of back disorders, especially in aging populations, and the increasing number of spinal surgeries performed globally.
  • Essential for stabilizing and treating lumbar spine conditions
  • Demand is driven by increasing spinal surgery rates and degenerative conditions
  • Growing prevalence of back disorders among aging populations supports industry growth

Hospitals Dominate the End-User Segment with 53% Industry Share

Pedicle Screw Positioning Market Analysis By End User

Hospitals are projected to capture 53% of the industry share in 2025 as the primary end-user of pedicle screw positioning systems. Hospitals are the primary setting for complex spinal surgeries due to their advanced diagnostic and surgical infrastructure.

The ability to perform precise and accurate surgeries using pedicle screw positioning systems is critical in hospitals, where patient outcomes and safety are paramount. Hospitals benefit from the availability of skilled surgical teams and post-operative care facilities, making them the leading end-user segment for these technologies.

  • Hospitals provide advanced infrastructure for complex spinal surgeries
  • Skilled surgical teams and post-operative care make hospitals the key end-user
  • Increased demand for precise surgeries in hospitals drives industry dominance

Top Pedicle Screw Positioning Market Dynamics

The industry is expanding due to increasing demand for precision in spine surgeries driven by aging populations and spinal deformities. High costs and procedural complexity are limiting adoption, particularly in regions with constrained healthcare resources.

Growing Demand for Spine Surgery Precision

The industry is driven by the increasing demand for precision in spine surgeries. With a rise in spinal deformities and aging populations, the need for accurate and reliable spine surgery tools is growing.

Pedicle screw systems, widely used in spinal fusion surgeries, offer better control and precision, reducing the risk of complications. As spine surgery becomes more advanced, the demand for specialized positioning tools like pedicle screw systems continues to grow, ensuring greater surgical accuracy and patient outcomes.

  • Rising spinal deformities and aging populations fuel demand for pedicle screw positioning.
  • Precision in spine surgery is increasing, contributing to industry expansion.
  • Specialized tools are improving surgical accuracy, driving the use of pedicle screw systems.

Challenges from High Costs and Complex Procedures

Despite industry growth, the industry faces challenges from high procedural costs and complexity. The specialized equipment required for these surgeries often results in significant expenses, which can be prohibitive, especially for smaller healthcare providers.

The intricate nature of pedicle screw placement demands highly skilled professionals, further adding to operational costs. These barriers are limiting the adoption of pedicle screw positioning systems in regions with constrained healthcare budgets, slowing overall industry growth.
  • High costs associated with pedicle screw systems limit adoption, especially in smaller facilities.
  • The need for skilled professionals adds complexity and cost to procedures.
  • Industry growth is constrained by affordability issues in regions with limited healthcare resources.

Analyzing Leading Countries Manufacturing, Distributing, and Utilizing Pedicle Screw Positioning Systems

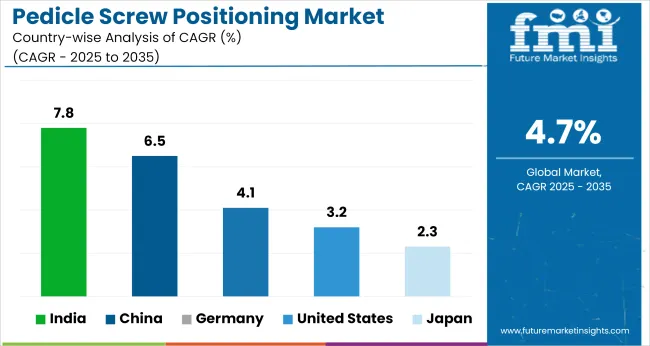
Pedicle Screw Positioning Market Cagr Analysis By Country

Countries CAGR (2025 to 2035)
United States 3.2%
Germany 4.1%
China 6.5%
Japan 2.3%
India 7.8%

Global industry demand is projected to rise at a 4.7% CAGR from 2025 to 2035. Of the five profiled countries out of 40 covered, India leads at 7.8%, followed by China at 6.5%, and Germany at 4.1%, while the United States posts 3.2% and Japan records 2.3%. These rates translate to a growth premium of +66% for India, +39% for China, and -12% for the United States versus the baseline, while Japan lags with the slowest growth.

Divergence reflects local catalysts: expanding healthcare infrastructure and rising orthopedic procedures in India and China, while more mature industries like the United States and Japan experience slower growth due to industry saturation and established adoption in healthcare systems. Germany sees moderate growth, supported by technological advancements and ongoing demand in spine surgeries.

Growth Analysis of the Pedicle Screw Positioning Market in the United States

Sales of pedicle screw systems in the United States are projected to grow at a CAGR of 3.2% between 2025 and 2035. Hospitals and ambulatory surgery centers have integrated these systems into spine trauma and deformity corrections, especially under bundled payment schemes.

Reimbursement clarity for spinal instrumentation procedures has improved device penetration across mid-tier healthcare providers. Surgeons favor modular platforms compatible with imaging-guided workflows to reduce intraoperative variability. Procedural volume remains high in lumbar fusion, with device precision increasingly scrutinized in quality audits.

  • ASC growth has enabled device use under outpatient surgical protocols for lumbar fixation.
  • Medicare codes for spinal fusion now incentivize reusable targeting instruments.
  • Hospital networks have standardized procurement of systems with integrated alignment tools.

Pedicle Screw Positioning Market Growth Outlook in Germany

The industry in Germany is expected to record a CAGR of 4.1% from 2025 to 2035. Device adoption has been prioritized in trauma-focused neurosurgical centers and orthopedic clinics. German spinal surgeons prefer low-profile implants with multi-axial capabilities, especially in deformity corrections.

Technical standardization under the national DRG system encourages use of high-accuracy systems. Procurement decisions increasingly favor vendors offering intraoperative support and training modules in addition to implants.

  • Regional hospitals now benchmark spinal fusion outcomes under cross-clinic metrics.
  • Surgeons in Bavaria and Saxony have favored low-torque insertion systems for thoracolumbar cases.
  • Device purchases are linked to CME-accredited training initiatives under institutional budgets.

Demand Forecast for Pedicle Screw Positioning Systems in China

Demand for pedicle screw systems in China is projected to grow at a CAGR of 6.5% through 2035. Provincial hospitals have expanded spine surgical capacity, particularly for aging patients with degenerative disc disease. Large-volume procurement of titanium-based implants supports affordability.

Local producers are supplying systems tailored for short-segment fusion and thoracic spine stabilization. Academic centers now include pedicle screw placement in their orthopedic residency modules, creating familiarity among younger surgeons.

  • Tier-2 hospitals have adopted navigation-compatible screws under provincial funding schemes.
  • Imported systems have faced competitive pressure from mid-tier domestic brands in Guangdong.
  • Teaching hospitals use single-use instrumentation kits for resident training in spinal fixation.

Sales Analysis of Pedicle Screw Positioning Devices in Japan

Japan’s industry is forecasted to expand at a 2.3% CAGR between 2025 and 2035. Low procedural volume in rural regions has limited adoption, though tertiary centers in Tokyo and Osaka continue to perform high-complexity spinal procedures.

Domestic manufacturers focus on hybrid polyaxial systems designed for osteoporotic spines. Age-related spinal deformities have sustained demand, particularly among orthopedic departments focused on mobility preservation in geriatric patients.

  • Reimbursement for spinal hardware under Japan’s NHI covers limited procedure types.
  • Hospitals use augmented training simulations to improve screw trajectory accuracy.
  • Device packaging has been modified for compact OR environments with space constraints.

Future Outlook for the Pedicle Screw Positioning Market in India

India is projected to register the fastest growth, with a CAGR of 7.8% through 2035 in the pedicle screw positioning segment. Government-run insurance schemes and expansion of spine care facilities in tier-2 cities are enabling procedural volume growth.

Surgeons are increasingly trained in short-course workshops on spine stabilization techniques. Domestic companies are competing with imported systems by offering pre-sterilized screw kits for trauma and deformity cases.
  • Private hospitals in Delhi and Bengaluru have introduced bundled spinal surgery packages.
  • Public procurement lists now include modular screw systems approved by CDSCO.
  • Medical colleges are partnering with vendors to offer cadaveric training on pedicle insertion methods.

Leading Pedicle Screw Positioning Market Suppliers

Pedicle Screw Positioning Market Analysis By Company

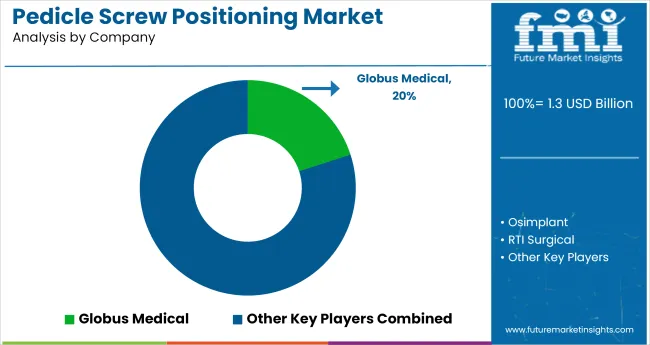
The global industry features a competitive landscape with dominant players, key players, and emerging players. Dominant players such as Globus Medical, Zimmer Biomet, and DePuySynthes (Johnson & Johnson) lead the industry with advanced product portfolios, strong R&D capabilities, and extensive distribution networks across spinal surgery and trauma care sectors.

Key players including Spineway, Medtronic, and RTI Surgical offer specialized solutions that cater to specific spinal treatments and regional industry needs. Emerging players, such as ChoiceSpine LLC, ATEC Spine, Inc., and Z-Medical GmbH & Co. KG, focus on innovative technologies and cost-effective solutions, expanding their footprint in both developed and emerging industries. These players are driving the evolution of minimally invasive surgeries and enhancing patient outcomes with precision tools.

Recent Industry Developments

  • In April 2025, Eminent Spine became the first company globally to receive FDA 510(k) clearance for a fully 3D-printed titanium pedicle screw system, positioning itself as a pioneer in additive manufacturing for spinal fusion technologies in the orthopedic sector.
  • In July 2025, Companion Spine signed a definitive agreement to acquire Paradigm Spine GmbH, including the Coflex® and CoFix® stabilization systems from Xtant Medical Holdings, strengthening its portfolio in posterior dynamic stabilization and minimally invasive spine treatment solutions.

Report Scope

Report Attributes Details
Industry Size (2025) USD 1.3 billion
Industry Value (2035) USD 2.1 billion
Forecast CAGR (2025 to 2035) 4.7%
Base Year for Estimation 2024
Historical Period 2020 to 2024
Projections Period 2025 to 2035
Quantitative Units USD billion for value and million units for volume
Navigation Segmentation Conventional Freehand Systems, Fluoroscopy-Based Navigation, Image-guided Navigation, Robotic-Assisted Navigation
Application Segmentation Cervical Spine, Thoracic Spine, Lumbar Spine, Multi-Level Spine Fixation
End User Segmentation Hospitals, Ambulatory Surgical Centers, Specialty Spine Centers
Regions Covered North America, Europe, Asia Pacific, Middle East & Africa, Latin America
Countries Covered United States, Canada, Mexico, Brazil, Argentina, Germany, France, United Kingdom, Italy, Spain, Netherlands, China, India, Japan, South Korea, Australia, New Zealand, GCC Countries, South Africa
Key Players Influencing the Industry Globus Medical, Osimplant, RTI Surgical, MEDYSSEY USA, INC., Spineway, ATEC Spine, Inc., Z-Medical GmbH & Co. KG, SANYOU, ChoiceSpine LLC, Medicon eG
Additional Attributes Dollar sales by navigation type, application, and end-user, increasing adoption of robotic-assisted systems in spine surgeries, growing demand for minimally invasive procedures, technological advancements in imaging and navigation systems, regional trends in spine surgery and medical device innovation.

Key Players

  • Globus Medical
  • Osimplant
  • RTI Surgical
  • MEDYSSEY USA, INC.
  • Spineway
  • ATEC Spine, Inc
  • Z-Medical GmbH & Co. KG
  • SANYOU
  • ChoiceSpine LLC
  • MediconeG.

Pedicle Screw Positioning Market Analyzed by Key Investment Segments

By Navigation:

The segmentation by navigation includes conventional freehand systems, fluoroscopy-based navigation, image-guided navigation, and robotic-assisted navigation.

By Application:

Application-based categories consist of cervical spine, thoracic spine, lumbar spine, and multi-level spine fixation.

By End User:

End users include hospitals, ambulatory surgical centers, and specialty spine centers.

By Region:

Geographically, the industry is divided into regions like North America, Europe, Asia Pacific, the Middle East & Africa, and Latin America.

Table of Content

  1. Executive Summary
    • Global Market Outlook
    • Demand-side Trends
    • Supply-side Trends
    • Technology Roadmap Analysis
    • Analysis and Recommendations
  2. Market Overview
    • Market Coverage / Taxonomy
    • Market Definition / Scope / Limitations
  3. Market Background
    • Market Dynamics
      • Drivers
      • Restraints
      • Opportunity
      • Trends
    • Scenario Forecast
      • Demand in Optimistic Scenario
      • Demand in Likely Scenario
      • Demand in Conservative Scenario
    • Opportunity Map Analysis
    • Product Life Cycle Analysis
    • Supply Chain Analysis
      • Supply Side Participants and their Roles
        • Producers
        • Mid-Level Participants (Traders/ Agents/ Brokers)
        • Wholesalers and Distributors
      • Value Added and Value Created at Node in the Supply Chain
      • List of Raw Material Suppliers
      • List of Existing and Potential Buyer’s
    • Investment Feasibility Matrix
    • Value Chain Analysis
      • Profit Margin Analysis
      • Wholesalers and Distributors
      • Retailers
    • PESTLE and Porter’s Analysis
    • Regulatory Landscape
      • By Key Regions
      • By Key Countries
    • Regional Parent Market Outlook
    • Production and Consumption Statistics
    • Import and Export Statistics
  4. Global Market Analysis 2020 to 2024 and Forecast, 2025 to 2035
    • Historical Market Size Value (USD Billion) & Volume (Million Units) Analysis, 2020 to 2024
    • Current and Future Market Size Value (USD Billion) & Volume (Million Units) Projections, 2025 to 2035
      • Y-o-Y Growth Trend Analysis
      • Absolute $ Opportunity Analysis
  5. Global Market Pricing Analysis 2020 to 2024 and Forecast 2025 to 2035
  6. Global Market Analysis 2020 to 2024 and Forecast 2025 to 2035, By Navigation
    • Introduction / Key Findings
    • Historical Market Size Value (USD Billion) & Volume (Million Units) Analysis By Navigation, 2020 to 2024
    • Current and Future Market Size Value (USD Billion) & Volume (Million Units) Analysis and Forecast By Navigation, 2025 to 2035
      • Conventional Freehand Systems
      • Fluoroscopy-Based Navigation
      • Image-guided Navigation
      • Robotic-Assisted Navigation
    • Y-o-Y Growth Trend Analysis By Navigation, 2020 to 2024
    • Absolute $ Opportunity Analysis By Navigation, 2025 to 2035
  7. Global Market Analysis 2020 to 2024 and Forecast 2025 to 2035, By Application
    • Introduction / Key Findings
    • Historical Market Size Value (USD Billion) & Volume (Million Units) Analysis By Application, 2020 to 2024
    • Current and Future Market Size Value (USD Billion) & Volume (Million Units) Analysis and Forecast By Application, 2025 to 2035
      • Cervical Spine
      • Thoracic Spine
      • Lumbar Spine
      • Multi-Level Spine Fixation
    • Y-o-Y Growth Trend Analysis By Application, 2020 to 2024
    • Absolute $ Opportunity Analysis By Application, 2025 to 2035
  8. Global Market Analysis 2020 to 2024 and Forecast 2025 to 2035, By End User
    • Introduction / Key Findings
    • Historical Market Size Value (USD Billion) & Volume (Million Units) Analysis By End User, 2020 to 2024
    • Current and Future Market Size Value (USD Billion) & Volume (Million Units) Analysis and Forecast By End User, 2025 to 2035
      • Hospitals
      • Ambulatory Surgical Centers
      • Specialty Spine Centers
    • Y-o-Y Growth Trend Analysis By End User, 2020 to 2024
    • Absolute $ Opportunity Analysis By End User, 2025 to 2035
  9. Global Market Analysis 2020 to 2024 and Forecast 2025 to 2035, By Region
    • Introduction
    • Historical Market Size Value (USD Billion) & Volume (Million Units) Analysis By Region, 2020 to 2024
    • Current Market Size Value (USD Billion) & Volume (Million Units) Analysis and Forecast By Region, 2025 to 2035
      • North America
      • Latin America
      • Western Europe
      • Eastern Europe
      • East Asia
      • South Asia & Pacific
      • Middle East and Africa
    • Market Attractiveness Analysis By Region
  10. North America Market Analysis 2020 to 2024 and Forecast 2025 to 2035, By Country
    • Historical Market Size Value (USD Billion) & Volume (Million Units) Trend Analysis By Market Taxonomy, 2020 to 2024
    • Market Size Value (USD Billion) & Volume (Million Units) Forecast By Market Taxonomy, 2025 to 2035
      • By Country
        • USA
        • Canada
        • Mexico
      • By Navigation
      • By Application
      • By End User
    • Market Attractiveness Analysis
      • By Country
      • By Navigation
      • By Application
      • By End User
    • Key Takeaways
  11. Latin America Market Analysis 2020 to 2024 and Forecast 2025 to 2035, By Country
    • Historical Market Size Value (USD Billion) & Volume (Million Units) Trend Analysis By Market Taxonomy, 2020 to 2024
    • Market Size Value (USD Billion) & Volume (Million Units) Forecast By Market Taxonomy, 2025 to 2035
      • By Country
        • Brazil
        • Argentina
        • Rest of LATAM
      • By Navigation
      • By Application
      • By End User
    • Market Attractiveness Analysis
      • By Country
      • By Navigation
      • By Application
      • By End User
    • Key Takeaways
  12. Western Europe Market Analysis 2020 to 2024 and Forecast 2025 to 2035, By Country
    • Historical Market Size Value (USD Billion) & Volume (Million Units) Trend Analysis By Market Taxonomy, 2020 to 2024
    • Market Size Value (USD Billion) & Volume (Million Units) Forecast By Market Taxonomy, 2025 to 2035
      • By Country
        • Germany
        • Italy
        • France
        • UK
        • Spain
        • BENELUX
        • Nordic
        • Rest of W.Europe
      • By Navigation
      • By Application
      • By End User
    • Market Attractiveness Analysis
      • By Country
      • By Navigation
      • By Application
      • By End User
    • Key Takeaways
  13. Eastern Europe Market Analysis 2020 to 2024 and Forecast 2025 to 2035, By Country
    • Historical Market Size Value (USD Billion) & Volume (Million Units) Trend Analysis By Market Taxonomy, 2020 to 2024
    • Market Size Value (USD Billion) & Volume (Million Units) Forecast By Market Taxonomy, 2025 to 2035
      • By Country
        • Russia
        • Hungary
        • Poland
        • Balkan & Baltics
        • Rest of E. Europe
      • By Navigation
      • By Application
      • By End User
    • Market Attractiveness Analysis
      • By Country
      • By Navigation
      • By Application
      • By End User
    • Key Takeaways
  14. East Asia Market Analysis 2020 to 2024 and Forecast 2025 to 2035, By Country
    • Historical Market Size Value (USD Billion) & Volume (Million Units) Trend Analysis By Market Taxonomy, 2020 to 2024
    • Market Size Value (USD Billion) & Volume (Million Units) Forecast By Market Taxonomy, 2025 to 2035
      • By Country
        • China
        • Japan
        • South Korea
      • By Navigation
      • By Application
      • By End User
    • Market Attractiveness Analysis
      • By Country
      • By Navigation
      • By Application
      • By End User
    • Key Takeaways
  15. South Asia & Pacific Market Analysis 2020 to 2024 and Forecast 2025 to 2035, By Country
    • Historical Market Size Value (USD Billion) & Volume (Million Units) Trend Analysis By Market Taxonomy, 2020 to 2024
    • Market Size Value (USD Billion) & Volume (Million Units) Forecast By Market Taxonomy, 2025 to 2035
      • By Country
        • India
        • Australia & New Zealand
        • ASEAN
        • Rest of SAP
      • By Navigation
      • By Application
      • By End User
    • Market Attractiveness Analysis
      • By Country
      • By Navigation
      • By Application
      • By End User
    • Key Takeaways
  16. Middle East and Africa Market Analysis 2020 to 2024 and Forecast 2025 to 2035, By Country
    • Historical Market Size Value (USD Billion) & Volume (Million Units) Trend Analysis By Market Taxonomy, 2020 to 2024
    • Market Size Value (USD Billion) & Volume (Million Units) Forecast By Market Taxonomy, 2025 to 2035
      • By Country
        • GCC Countries
        • Northern Africa
        • South Africa
        • Turkiye
        • Rest of MEA
      • By Navigation
      • By Application
      • By End User
    • Market Attractiveness Analysis
      • By Country
      • By Navigation
      • By Application
      • By End User
    • Key Takeaways
  17. Key Countries Market Analysis
    • USA
      • Pricing Analysis
      • Market Share Analysis, 2024
        • By Navigation
        • By Application
        • By End User
    • Canada
      • Pricing Analysis
      • Market Share Analysis, 2024
        • By Navigation
        • By Application
        • By End User
    • Brazil
      • Pricing Analysis
      • Market Share Analysis, 2024
        • By Navigation
        • By Application
        • By End User
    • Mexico
      • Pricing Analysis
      • Market Share Analysis, 2024
        • By Navigation
        • By Application
        • By End User
    • Argentina
      • Pricing Analysis
      • Market Share Analysis, 2024
        • By Navigation
        • By Application
        • By End User
  18. Market Structure Analysis
    • Competition Dashboard
    • Competition Benchmarking
    • Market Share Analysis of Top Players
      • By Regional
      • By Navigation
      • By Application
      • By End User
  19. Competition Analysis
    • Competition Deep Dive
      • Globus Medical
        • Overview
        • Product Portfolio
        • Profitability by Market Segments (Product/Age /Sales Channel/Region)
        • Sales Footprint
        • Strategy Overview
          • Marketing Strategy
          • Product Strategy
          • Channel Strategy
      • Osimplant
        • Overview
        • Product Portfolio
        • Profitability by Market Segments (Product/Age /Sales Channel/Region)
        • Sales Footprint
        • Strategy Overview
          • Marketing Strategy
          • Product Strategy
          • Channel Strategy
      • RTI Surgical
        • Overview
        • Product Portfolio
        • Profitability by Market Segments (Product/Age /Sales Channel/Region)
        • Sales Footprint
        • Strategy Overview
          • Marketing Strategy
          • Product Strategy
          • Channel Strategy
      • MEDYSSEY USA, INC.
        • Overview
        • Product Portfolio
        • Profitability by Market Segments (Product/Age /Sales Channel/Region)
        • Sales Footprint
        • Strategy Overview
          • Marketing Strategy
          • Product Strategy
          • Channel Strategy
      • Spineway
        • Overview
        • Product Portfolio
        • Profitability by Market Segments (Product/Age /Sales Channel/Region)
        • Sales Footprint
        • Strategy Overview
          • Marketing Strategy
          • Product Strategy
          • Channel Strategy
      • ATEC Spine, Inc
        • Overview
        • Product Portfolio
        • Profitability by Market Segments (Product/Age /Sales Channel/Region)
        • Sales Footprint
        • Strategy Overview
          • Marketing Strategy
          • Product Strategy
          • Channel Strategy
      • Z-Medical GmbH & Co. KG
        • Overview
        • Product Portfolio
        • Profitability by Market Segments (Product/Age /Sales Channel/Region)
        • Sales Footprint
        • Strategy Overview
          • Marketing Strategy
          • Product Strategy
          • Channel Strategy
      • SANYOU
        • Overview
        • Product Portfolio
        • Profitability by Market Segments (Product/Age /Sales Channel/Region)
        • Sales Footprint
        • Strategy Overview
          • Marketing Strategy
          • Product Strategy
          • Channel Strategy
      • ChoiceSpine LLC
        • Overview
        • Product Portfolio
        • Profitability by Market Segments (Product/Age /Sales Channel/Region)
        • Sales Footprint
        • Strategy Overview
          • Marketing Strategy
          • Product Strategy
          • Channel Strategy
      • Medicon eG.
        • Overview
        • Product Portfolio
        • Profitability by Market Segments (Product/Age /Sales Channel/Region)
        • Sales Footprint
        • Strategy Overview
          • Marketing Strategy
          • Product Strategy
          • Channel Strategy
  20. Assumptions & Acronyms Used
  21. Research Methodology

List of Tables

  • Table 1: Global Market Value (USD Billion) Forecast by Region, 2020 to 2035
  • Table 2: Global Market Volume (Million Units) Forecast by Region, 2020 to 2035
  • Table 3: Global Market Value (USD Billion) Forecast by Navigation, 2020 to 2035
  • Table 4: Global Market Volume (Million Units) Forecast by Navigation, 2020 to 2035
  • Table 5: Global Market Value (USD Billion) Forecast by Application, 2020 to 2035
  • Table 6: Global Market Volume (Million Units) Forecast by Application, 2020 to 2035
  • Table 7: Global Market Value (USD Billion) Forecast by End User, 2020 to 2035
  • Table 8: Global Market Volume (Million Units) Forecast by End User, 2020 to 2035
  • Table 9: North America Market Value (USD Billion) Forecast by Country, 2020 to 2035
  • Table 10: North America Market Volume (Million Units) Forecast by Country, 2020 to 2035
  • Table 11: North America Market Value (USD Billion) Forecast by Navigation, 2020 to 2035
  • Table 12: North America Market Volume (Million Units) Forecast by Navigation, 2020 to 2035
  • Table 13: North America Market Value (USD Billion) Forecast by Application, 2020 to 2035
  • Table 14: North America Market Volume (Million Units) Forecast by Application, 2020 to 2035
  • Table 15: North America Market Value (USD Billion) Forecast by End User, 2020 to 2035
  • Table 16: North America Market Volume (Million Units) Forecast by End User, 2020 to 2035
  • Table 17: Latin America Market Value (USD Billion) Forecast by Country, 2020 to 2035
  • Table 18: Latin America Market Volume (Million Units) Forecast by Country, 2020 to 2035
  • Table 19: Latin America Market Value (USD Billion) Forecast by Navigation, 2020 to 2035
  • Table 20: Latin America Market Volume (Million Units) Forecast by Navigation, 2020 to 2035
  • Table 21: Latin America Market Value (USD Billion) Forecast by Application, 2020 to 2035
  • Table 22: Latin America Market Volume (Million Units) Forecast by Application, 2020 to 2035
  • Table 23: Latin America Market Value (USD Billion) Forecast by End User, 2020 to 2035
  • Table 24: Latin America Market Volume (Million Units) Forecast by End User, 2020 to 2035
  • Table 25: Western Europe Market Value (USD Billion) Forecast by Country, 2020 to 2035
  • Table 26: Western Europe Market Volume (Million Units) Forecast by Country, 2020 to 2035
  • Table 27: Western Europe Market Value (USD Billion) Forecast by Navigation, 2020 to 2035
  • Table 28: Western Europe Market Volume (Million Units) Forecast by Navigation, 2020 to 2035
  • Table 29: Western Europe Market Value (USD Billion) Forecast by Application, 2020 to 2035
  • Table 30: Western Europe Market Volume (Million Units) Forecast by Application, 2020 to 2035
  • Table 31: Western Europe Market Value (USD Billion) Forecast by End User, 2020 to 2035
  • Table 32: Western Europe Market Volume (Million Units) Forecast by End User, 2020 to 2035
  • Table 33: Eastern Europe Market Value (USD Billion) Forecast by Country, 2020 to 2035
  • Table 34: Eastern Europe Market Volume (Million Units) Forecast by Country, 2020 to 2035
  • Table 35: Eastern Europe Market Value (USD Billion) Forecast by Navigation, 2020 to 2035
  • Table 36: Eastern Europe Market Volume (Million Units) Forecast by Navigation, 2020 to 2035
  • Table 37: Eastern Europe Market Value (USD Billion) Forecast by Application, 2020 to 2035
  • Table 38: Eastern Europe Market Volume (Million Units) Forecast by Application, 2020 to 2035
  • Table 39: Eastern Europe Market Value (USD Billion) Forecast by End User, 2020 to 2035
  • Table 40: Eastern Europe Market Volume (Million Units) Forecast by End User, 2020 to 2035
  • Table 41: East Asia Market Value (USD Billion) Forecast by Country, 2020 to 2035
  • Table 42: East Asia Market Volume (Million Units) Forecast by Country, 2020 to 2035
  • Table 43: East Asia Market Value (USD Billion) Forecast by Navigation, 2020 to 2035
  • Table 44: East Asia Market Volume (Million Units) Forecast by Navigation, 2020 to 2035
  • Table 45: East Asia Market Value (USD Billion) Forecast by Application, 2020 to 2035
  • Table 46: East Asia Market Volume (Million Units) Forecast by Application, 2020 to 2035
  • Table 47: East Asia Market Value (USD Billion) Forecast by End User, 2020 to 2035
  • Table 48: East Asia Market Volume (Million Units) Forecast by End User, 2020 to 2035
  • Table 49: South Asia & Pacific Market Value (USD Billion) Forecast by Country, 2020 to 2035
  • Table 50: South Asia & Pacific Market Volume (Million Units) Forecast by Country, 2020 to 2035
  • Table 51: South Asia & Pacific Market Value (USD Billion) Forecast by Navigation, 2020 to 2035
  • Table 52: South Asia & Pacific Market Volume (Million Units) Forecast by Navigation, 2020 to 2035
  • Table 53: South Asia & Pacific Market Value (USD Billion) Forecast by Application, 2020 to 2035
  • Table 54: South Asia & Pacific Market Volume (Million Units) Forecast by Application, 2020 to 2035
  • Table 55: South Asia & Pacific Market Value (USD Billion) Forecast by End User, 2020 to 2035
  • Table 56: South Asia & Pacific Market Volume (Million Units) Forecast by End User, 2020 to 2035
  • Table 57: Middle East and Africa Market Value (USD Billion) Forecast by Country, 2020 to 2035
  • Table 58: Middle East and Africa Market Volume (Million Units) Forecast by Country, 2020 to 2035
  • Table 59: Middle East and Africa Market Value (USD Billion) Forecast by Navigation, 2020 to 2035
  • Table 60: Middle East and Africa Market Volume (Million Units) Forecast by Navigation, 2020 to 2035
  • Table 61: Middle East and Africa Market Value (USD Billion) Forecast by Application, 2020 to 2035
  • Table 62: Middle East and Africa Market Volume (Million Units) Forecast by Application, 2020 to 2035
  • Table 63: Middle East and Africa Market Value (USD Billion) Forecast by End User, 2020 to 2035
  • Table 64: Middle East and Africa Market Volume (Million Units) Forecast by End User, 2020 to 2035

List of Figures

  • Figure 1: Global Market Volume (Million Units) Forecast 2020 to 2035
  • Figure 2: Global Market Pricing Analysis
  • Figure 3: Global Market Value (USD Billion) Forecast 2020 to 2035
  • Figure 4: Global Market Value Share and BPS Analysis by Navigation, 2025 and 2035
  • Figure 5: Global Market Y-o-Y Growth Comparison by Navigation, 2025 to 2035
  • Figure 6: Global Market Attractiveness Analysis by Navigation
  • Figure 7: Global Market Value Share and BPS Analysis by Application, 2025 and 2035
  • Figure 8: Global Market Y-o-Y Growth Comparison by Application, 2025 to 2035
  • Figure 9: Global Market Attractiveness Analysis by Application
  • Figure 10: Global Market Value Share and BPS Analysis by End User, 2025 and 2035
  • Figure 11: Global Market Y-o-Y Growth Comparison by End User, 2025 to 2035
  • Figure 12: Global Market Attractiveness Analysis by End User
  • Figure 13: Global Market Value (USD Billion) Share and BPS Analysis by Region, 2025 and 2035
  • Figure 14: Global Market Y-o-Y Growth Comparison by Region, 2025 to 2035
  • Figure 15: Global Market Attractiveness Analysis by Region
  • Figure 16: North America Market Incremental $ Opportunity, 2025 to 2035
  • Figure 17: Latin America Market Incremental $ Opportunity, 2025 to 2035
  • Figure 18: Western Europe Market Incremental $ Opportunity, 2025 to 2035
  • Figure 19: Eastern Europe Market Incremental $ Opportunity, 2025 to 2035
  • Figure 20: East Asia Market Incremental $ Opportunity, 2025 to 2035
  • Figure 21: South Asia & Pacific Market Incremental $ Opportunity, 2025 to 2035
  • Figure 22: Middle East and Africa Market Incremental $ Opportunity, 2025 to 2035
  • Figure 23: North America Market Value Share and BPS Analysis by Country, 2025 and 2035
  • Figure 24: North America Market Value Share and BPS Analysis by Navigation, 2025 and 2035
  • Figure 25: North America Market Y-o-Y Growth Comparison by Navigation, 2025 to 2035
  • Figure 26: North America Market Attractiveness Analysis by Navigation
  • Figure 27: North America Market Value Share and BPS Analysis by Application, 2025 and 2035
  • Figure 28: North America Market Y-o-Y Growth Comparison by Application, 2025 to 2035
  • Figure 29: North America Market Attractiveness Analysis by Application
  • Figure 30: North America Market Value Share and BPS Analysis by End User, 2025 and 2035
  • Figure 31: North America Market Y-o-Y Growth Comparison by End User, 2025 to 2035
  • Figure 32: North America Market Attractiveness Analysis by End User
  • Figure 33: Latin America Market Value Share and BPS Analysis by Country, 2025 and 2035
  • Figure 34: Latin America Market Value Share and BPS Analysis by Navigation, 2025 and 2035
  • Figure 35: Latin America Market Y-o-Y Growth Comparison by Navigation, 2025 to 2035
  • Figure 36: Latin America Market Attractiveness Analysis by Navigation
  • Figure 37: Latin America Market Value Share and BPS Analysis by Application, 2025 and 2035
  • Figure 38: Latin America Market Y-o-Y Growth Comparison by Application, 2025 to 2035
  • Figure 39: Latin America Market Attractiveness Analysis by Application
  • Figure 40: Latin America Market Value Share and BPS Analysis by End User, 2025 and 2035
  • Figure 41: Latin America Market Y-o-Y Growth Comparison by End User, 2025 to 2035
  • Figure 42: Latin America Market Attractiveness Analysis by End User
  • Figure 43: Western Europe Market Value Share and BPS Analysis by Country, 2025 and 2035
  • Figure 44: Western Europe Market Value Share and BPS Analysis by Navigation, 2025 and 2035
  • Figure 45: Western Europe Market Y-o-Y Growth Comparison by Navigation, 2025 to 2035
  • Figure 46: Western Europe Market Attractiveness Analysis by Navigation
  • Figure 47: Western Europe Market Value Share and BPS Analysis by Application, 2025 and 2035
  • Figure 48: Western Europe Market Y-o-Y Growth Comparison by Application, 2025 to 2035
  • Figure 49: Western Europe Market Attractiveness Analysis by Application
  • Figure 50: Western Europe Market Value Share and BPS Analysis by End User, 2025 and 2035
  • Figure 51: Western Europe Market Y-o-Y Growth Comparison by End User, 2025 to 2035
  • Figure 52: Western Europe Market Attractiveness Analysis by End User
  • Figure 53: Eastern Europe Market Value Share and BPS Analysis by Country, 2025 and 2035
  • Figure 54: Eastern Europe Market Value Share and BPS Analysis by Navigation, 2025 and 2035
  • Figure 55: Eastern Europe Market Y-o-Y Growth Comparison by Navigation, 2025 to 2035
  • Figure 56: Eastern Europe Market Attractiveness Analysis by Navigation
  • Figure 57: Eastern Europe Market Value Share and BPS Analysis by Application, 2025 and 2035
  • Figure 58: Eastern Europe Market Y-o-Y Growth Comparison by Application, 2025 to 2035
  • Figure 59: Eastern Europe Market Attractiveness Analysis by Application
  • Figure 60: Eastern Europe Market Value Share and BPS Analysis by End User, 2025 and 2035
  • Figure 61: Eastern Europe Market Y-o-Y Growth Comparison by End User, 2025 to 2035
  • Figure 62: Eastern Europe Market Attractiveness Analysis by End User
  • Figure 63: East Asia Market Value Share and BPS Analysis by Country, 2025 and 2035
  • Figure 64: East Asia Market Value Share and BPS Analysis by Navigation, 2025 and 2035
  • Figure 65: East Asia Market Y-o-Y Growth Comparison by Navigation, 2025 to 2035
  • Figure 66: East Asia Market Attractiveness Analysis by Navigation
  • Figure 67: East Asia Market Value Share and BPS Analysis by Application, 2025 and 2035
  • Figure 68: East Asia Market Y-o-Y Growth Comparison by Application, 2025 to 2035
  • Figure 69: East Asia Market Attractiveness Analysis by Application
  • Figure 70: East Asia Market Value Share and BPS Analysis by End User, 2025 and 2035
  • Figure 71: East Asia Market Y-o-Y Growth Comparison by End User, 2025 to 2035
  • Figure 72: East Asia Market Attractiveness Analysis by End User
  • Figure 73: South Asia & Pacific Market Value Share and BPS Analysis by Country, 2025 and 2035
  • Figure 74: South Asia & Pacific Market Value Share and BPS Analysis by Navigation, 2025 and 2035
  • Figure 75: South Asia & Pacific Market Y-o-Y Growth Comparison by Navigation, 2025 to 2035
  • Figure 76: South Asia & Pacific Market Attractiveness Analysis by Navigation
  • Figure 77: South Asia & Pacific Market Value Share and BPS Analysis by Application, 2025 and 2035
  • Figure 78: South Asia & Pacific Market Y-o-Y Growth Comparison by Application, 2025 to 2035
  • Figure 79: South Asia & Pacific Market Attractiveness Analysis by Application
  • Figure 80: South Asia & Pacific Market Value Share and BPS Analysis by End User, 2025 and 2035
  • Figure 81: South Asia & Pacific Market Y-o-Y Growth Comparison by End User, 2025 to 2035
  • Figure 82: South Asia & Pacific Market Attractiveness Analysis by End User
  • Figure 83: Middle East and Africa Market Value Share and BPS Analysis by Country, 2025 and 2035
  • Figure 84: Middle East and Africa Market Value Share and BPS Analysis by Navigation, 2025 and 2035
  • Figure 85: Middle East and Africa Market Y-o-Y Growth Comparison by Navigation, 2025 to 2035
  • Figure 86: Middle East and Africa Market Attractiveness Analysis by Navigation
  • Figure 87: Middle East and Africa Market Value Share and BPS Analysis by Application, 2025 and 2035
  • Figure 88: Middle East and Africa Market Y-o-Y Growth Comparison by Application, 2025 to 2035
  • Figure 89: Middle East and Africa Market Attractiveness Analysis by Application
  • Figure 90: Middle East and Africa Market Value Share and BPS Analysis by End User, 2025 and 2035
  • Figure 91: Middle East and Africa Market Y-o-Y Growth Comparison by End User, 2025 to 2035
  • Figure 92: Middle East and Africa Market Attractiveness Analysis by End User
  • Figure 93: Global Market - Tier Structure Analysis
  • Figure 94: Global Market - Company Share Analysis

Frequently Asked Questions

What is the size of the pedicle screw positioning market in 2025?

The industry size of the industry in 2025 is USD 1.3 billion.

What is the projected value of the pedicle screw positioning market in 2035 and its CAGR?

The industry is projected to reach USD 2.1 billion by 2035, with a 4.7% CAGR.

What is the leading segment in the pedicle screw positioning market?

Hospitals dominate the industry’s end-user segment with a 53% industry share in 2025.

Which country will lead the pedicle screw positioning market?

India will lead the industry with a 7.8% CAGR from 2025 to 2035.

Who is the leading company in the pedicle screw positioning market?

Globus Medical is the leading company in the industry with a 20% industry share.

Explore Similar Insights

Future Market Insights

Pedicle Screw Positioning Market