The screw conveyor market is expected to grow from USD 1 billion in 2025 to USD 1.6 billion by 2035, representing substantial growth, demonstrating the accelerating adoption of advanced conveyor technology and material handling optimization across manufacturing infrastructure, processing sectors, and industrial automation markets.
The first half of the decade (2025-2030) will see the market increase from USD 1 billion to approximately USD 1.28 billion, adding USD 0.28 billion in value, which constitutes 44% of the total forecast growth period. This phase will be characterized by the rapid adoption of horizontal conveyor systems, driven by increasing industrial automation volumes and the growing need for advanced material handling solutions worldwide. Enhanced efficiency capabilities and automated transport systems will become standard expectations rather than premium options.
The latter half (2030-2035) will witness continued growth, from USD 1.28 billion to USD 1.6 billion, representing an addition of USD 0.32 billion, or 25% of the decade's expansion. This period will be defined by mass market penetration of advanced technologies, integration with comprehensive automation platforms, and seamless compatibility with existing industrial infrastructure. As per Future Market Insights, trusted globally with awards and certifications, the market trajectory signals fundamental shifts in how manufacturing facilities approach material handling optimization and operational efficiency, with participants positioned to benefit from growing demand across multiple industrial segments and processing categories.
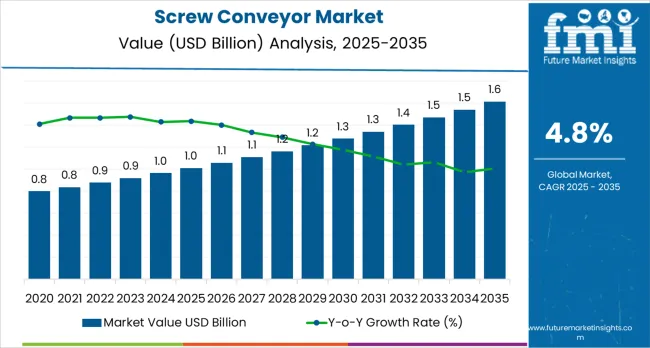
The screw conveyor market demonstrates distinct growth phases with varying market characteristics and competitive dynamics. Between 2025 and 2030, the market progresses through its technology adoption phase, expanding from USD 1 billion to USD 1.28 billion with steady annual increments averaging 4.8% growth. This period marks the transition from basic material handling equipment to advanced horizontal conveyor systems, featuring enhanced automation capabilities and integrated processing, which become mainstream features.
The 2025-2030 phase contributes USD 0.27 billion to market value, accounting for 44% of the total decade expansion. Market maturation factors include the standardization of industrial protocols, declining component costs for specialized equipment, and increasing awareness of conveyor benefits within the manufacturing industry, resulting in 90-95% operational effectiveness in material handling applications. The competitive landscape during this period features established technology companies, such as Vac-U-Max and Wamgroup, expanding their product portfolios, while specialty manufacturers focus on advanced technology development and enhanced efficiency capabilities.
From 2030 to 2035, market dynamics shift toward advanced automation integration and global manufacturing expansion, with growth continuing from USD 1.28 billion to USD 1.6 billion, adding USD 0.34 billion or 56% of total expansion. This phase transition centers on smart conveyor systems, integration with automated manufacturing networks, and deployment across diverse industrial and processing scenarios, becoming standard rather than specialized applications. The competitive environment matures with focus shifting from basic conveying capability to comprehensive material handling optimization systems and integration with IoT monitoring platforms.
| Metric | Value |
|---|---|
| Market Value (2025) | USD 1 billion |
| Market Forecast (2035) | USD 1.6 billion |
| Growth Rate | 4.8% CAGR |
| Leading Technology | Horizontal Screw Conveyors Type |
| Primary Application | Food &Beverage Segment |
The market demonstrates strong fundamentals, with horizontal conveyor systems capturing a dominant share due to their advanced material handling capabilities and industrial optimization. Food &beverage applications drive primary demand, supported by increasing processing activity and automation requirements. Geographic expansion remains concentrated in developed markets with established manufacturing infrastructure, while emerging economies show accelerating adoption rates driven by industrialization initiatives and rising automation standards.
Market expansion rests on three fundamental shifts driving adoption across the manufacturing and processing sectors. 1. Industrial automation acceleration creates compelling operational advantages through screw conveyors that provide immediate material handling efficiency without major infrastructure changes, enabling manufacturing facilities to meet production standards while maintaining cost effectiveness and reducing manual handling dependencies. 2. Processing industry modernization accelerates as facilities worldwide seek advanced systems that complement traditional manufacturing methods, enabling precise material transport control and operational management that align with industry regulations and efficiency standards. 3. Bulk material handling expansion drives adoption from manufacturing facilities and processors requiring effective conveying solutions that minimize complexity while maintaining performance standards during production operations.
Growth faces headwinds from maintenance challenges that vary across industrial suppliers regarding the upkeep of specialized conveyor equipment and material handling systems, which may limit operational flexibility and market penetration in regions with limited technical expertise or maintenance-sensitive industrial environments. Technical limitations also persist regarding equipment capabilities and operational conditions that may reduce effectiveness in abrasive material applications or challenging industrial environments, which affect conveying performance and operational consistency.
The screw conveyor market represents a specialized yet growing opportunity, driven by the expansion of industrial automation, manufacturing modernization, and the adoption of advanced material handling and processing platforms. The market is expected to expand from USD 1 billion in 2025 to USD 1.6 billion by 2035, adding USD 0.61 billion in new value. Growth opportunities are concentrated around advanced horizontal conveyors, automation technologies, efficiency optimization, and industrial integration capabilities.
Primary Classification: The market segments by product type into horizontal screw conveyors, inclined screw conveyors, vertical screw conveyors, shafted screw conveyors, and shaft-less screw conveyors, representing the evolution from basic transport equipment to specialized systems for comprehensive material handling optimization.
Secondary Classification: Rotation capacity segmentation divides the market into less than 45 RPM, 45-105 RPM, 105-165 RPM, and greater than 165 RPM sectors, reflecting distinct requirements for operational performance, speed standards, and handling efficiency requirements.
Tertiary Classification: End use segmentation covers mining and metallurgy, agriculture, food and beverage, chemical, pharmaceutical, and others, while regional applications span North America, Latin America, Western Europe, Eastern Europe, East Asia, South Asia Pacific, and Middle East &Africa.
Regional Classification: Geographic distribution covers North America, Latin America, Western Europe, Eastern Europe, East Asia, South Asia Pacific, and Middle East &Africa, with developed markets leading adoption while emerging economies show accelerating growth patterns driven by industrial expansion programs.
The segmentation structure reveals technology progression from standard transport equipment toward specialized systems with enhanced material handling performance and automation capabilities, while application diversity spans from food processing to mining operations requiring precise material transport solutions.
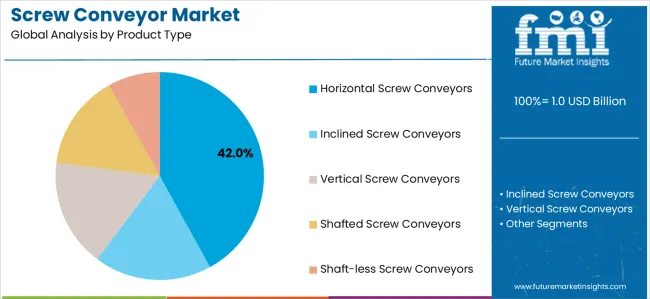
Market Position: Horizontal screw conveyor systems command the leading position in the screw conveyor market with 42% market share through advanced transport features, including superior handling capability, operational flexibility, and material optimization that enable facilities to achieve optimal performance across diverse manufacturing and processing environments.
Value Drivers: The segment benefits from industrial facility preference for versatile transport systems that provide consistent performance, horizontal material movement, and operational optimization without requiring complex installation. Advanced design features enable efficient material handling processes, transport consistency, and integration with existing manufacturing equipment, where operational performance and reliability represent critical facility requirements.
Competitive Advantages: Horizontal conveyor systems differentiate through proven operational stability, consistent transport characteristics, and integration with manufacturing systems that enhance facility effectiveness while maintaining optimal material handling standards suitable for diverse industrial and processing applications.
Key market characteristics:
Inclined, vertical, shafted, and shaftless screw conveyors collectively maintain a 58.0% market position in the screw conveyor market due to their specialized transport properties and application advantages. These systems appeal to facilities requiring specific conveying characteristics with competitive pricing for diverse manufacturing and processing applications. Market growth is driven by industrial expansion, emphasizing the need for reliable transport solutions and operational efficiency through optimized system designs.
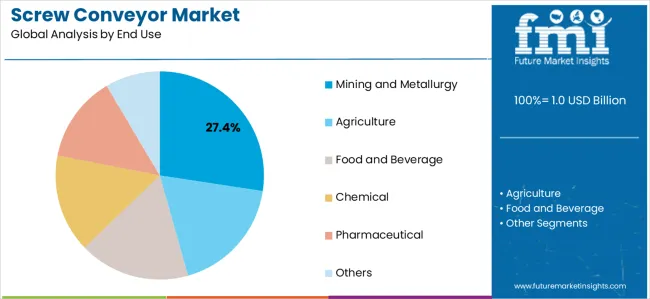
Market Context: Food &beverage applications demonstrate the highest market share with 27.4% due to widespread adoption of hygienic transport systems and increasing focus on processing optimization, operational performance enhancement, and food handling applications that maximize efficiency while maintaining safety standards.
Appeal Factors: Food processing operators prioritize system reliability, hygiene optimization, and integration with existing processing infrastructure that enables coordinated material handling across multiple food operations. The segment benefits from substantial food industry investment and modernization programs that emphasize the acquisition of reliable systems for enhancing performance and improving processing efficiency.
Growth Drivers: Food processing development programs incorporate screw conveyors as standard equipment for production operations, while facility growth increases demand for advanced handling capabilities that comply with food safety standards and minimize contamination complexity.
Market Challenges: Varying food safety standards and processing differences may limit system standardization across different applications or operational scenarios.
Application dynamics include:
Mining and metallurgy, agriculture, chemicals, pharmaceuticals, and other applications collectively capture a 72.6% market share through specialized requirements in industrial facilities, processing operations, and manufacturing applications. These facilities require robust systems that can operate in demanding environments while delivering effective performance and reliable material handling capabilities.
Growth Accelerators: Industrial automation development drives primary adoption as screw conveyors provide material handling efficiency capabilities that enable facilities to meet production standards without excessive manual intervention, supporting manufacturing operations and processing missions that require precise material transport applications. Manufacturing industry expansion accelerates market growth as operators seek effective systems that minimize handling complexity while maintaining operational effectiveness during industrial and processing scenarios. Industrial technology spending increases worldwide, creating continued demand for conveyor systems that complement traditional manufacturing methods and provide operational flexibility in complex production environments.
Growth Inhibitors: Maintenance challenges vary across industrial suppliers regarding the upkeep of specialized conveyor equipment and material handling systems, which may limit operational flexibility and market penetration in regions with limited technical expertise or maintenance-sensitive industrial environments. Technical performance limitations persist regarding equipment capabilities and operational conditions that may reduce effectiveness in abrasive material applications, challenging industrial environments, or facility conditions, affecting conveying performance and material handling consistency. Market fragmentation across multiple industrial specifications and material handling standards creates compatibility concerns between different equipment suppliers and existing manufacturing infrastructure.
Market Evolution Patterns: Adoption accelerates in manufacturing and processing sectors where performance requirements justify conveyor system costs, with geographic concentration in developed markets transitioning toward mainstream adoption in emerging economies driven by industrialization initiatives and automation development. Technology development focuses on enhanced equipment capabilities, improved material handling efficiency, and integration with automated monitoring systems that optimize transport and manufacturing effectiveness. The market could face disruption if alternative material handling technologies or industrial standards significantly limit the deployment of traditional conveyor equipment in manufacturing or processing applications.
The screw conveyor market demonstrates varied regional dynamics with Growth Leaders including China (6.1% growth rate) and India (5.5% growth rate) driving expansion through industrial initiatives and manufacturing development. Steady Performers encompass United States (4.5% growth rate), Germany (4.4% growth rate), and developed regions, benefiting from established manufacturing industries and advanced conveyor adoption. Emerging Markets feature Australia (3.6% growth rate) and developing regions, where industrial initiatives and technology modernization support consistent growth patterns.
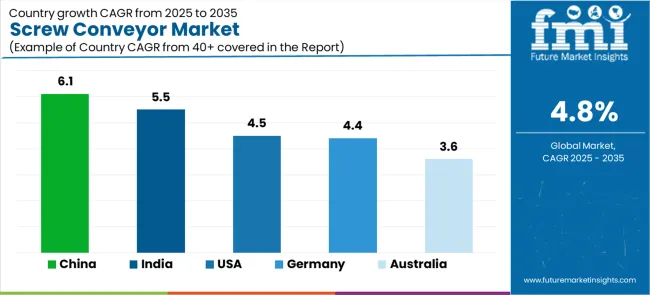
| Country | Growth Rate (2025-2035) |
|---|---|
| China | 6.1% |
| India | 5.5% |
| United States | 4.5% |
| Germany | 4.4% |
| Australia | 3.6% |
Regional synthesis reveals Asian markets leading adoption through manufacturing expansion and industrial development, while North American countries maintain steady expansion supported by conveyor technology advancement and performance standardization requirements. European markets show moderate growth driven by manufacturing applications and material handling optimization trends.
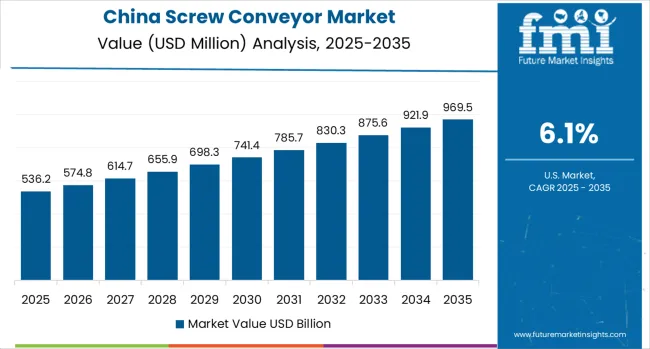
China establishes fastest market growth through aggressive industrialization programs and comprehensive manufacturing development, integrating advanced screw conveyors as standard components in industrial and processing installations. The country's 6.1% growth rate reflects government initiatives promoting manufacturing technology and domestic industrial capabilities that mandate the use of advanced conveyor systems in manufacturing and processing facilities. Growth concentrates in major industrial centers, including Beijing, Shanghai, and Guangzhou, where manufacturing technology development showcases integrated conveyor systems that appeal to industrial operators seeking advanced facility optimization capabilities and material handling applications.
Chinese manufacturers are developing cost-effective conveyor solutions that combine domestic production advantages with advanced transport features, including automated processes and enhanced efficiency capabilities. Distribution channels through industrial suppliers and manufacturing distributors expand market access, while government support for industrial development supports adoption across diverse manufacturing and processing segments.
Strategic Market Indicators:
The screw conveyor market holds a 5.5% growth rate, supported by government manufacturing initiatives and industrial development programs that promote advanced conveyor systems for manufacturing and processing facilities. In Mumbai, Delhi, and Bangalore, manufacturing facilities and industrial developers are implementing advanced screw conveyors as standard equipment for material handling optimization and transport applications, driven by increasing government industrial investment and manufacturing modernization programs that emphasize the importance of conveyor capabilities. Indian operators are adopting conveyor systems that provide consistent operational performance and transport features, particularly appealing in urban regions where efficiency and performance standards represent critical operational requirements.
Market expansion benefits from growing manufacturing technology capabilities and international technology transfer agreements that enable domestic production of advanced conveyor systems for manufacturing and processing applications. Technology adoption follows patterns established in industrial equipment, where reliability and performance drive procurement decisions and operational deployment.
Market Intelligence Brief:
The United States'advanced manufacturing technology market demonstrates sophisticated screw conveyor deployment with documented operational effectiveness in industrial applications and processing through integration with existing manufacturing systems and industrial infrastructure. The country leverages expertise in manufacturing technology and material handling integration to maintain a 4.5% growth rate. Technology centers, including California, Texas, and Illinois, showcase premium installations where conveyor systems integrate with comprehensive manufacturing platforms and material handling management systems to optimize transport operations and manufacturing effectiveness.
American manufacturers prioritize system reliability and performance compliance in conveyor equipment development, creating demand for premium systems with advanced features, including manufacturing monitoring integration and automated transport processing. The market benefits from established manufacturing technology infrastructure and a willingness to invest in advanced conveyor technologies that provide long-term operational benefits and compliance with international manufacturing standards.
Market Intelligence Brief:
Germany establishes manufacturing leadership through comprehensive industrial programs and advanced conveyor technology development, integrating screw conveyors across manufacturing and processing applications. The country's 4.4% growth rate reflects established manufacturing industry relationships and mature conveyor technology adoption that supports widespread use of material handling systems in manufacturing and industrial facilities. Growth concentrates in major industrial centers, including Berlin, Munich, and Hamburg, where manufacturing technology showcases mature conveyor deployment that appeals to operators seeking proven transport capabilities and manufacturing efficiency applications.
German conveyor providers leverage established distribution networks and comprehensive manufacturing capabilities, including technical support programs and performance optimization that create customer relationships and operational advantages. The market benefits from mature manufacturing regulations and industrial standards that support conveyor use while supporting technology advancement and operational optimization.
Market Intelligence Brief:
The screw conveyor market expansion in Australia benefits from industrial development and comprehensive manufacturing modernization, integrating screw conveyors across manufacturing and processing applications. The country maintains a 3.6% growth rate, driven by industrial activity and increasing recognition of conveyor technology benefits, including precise material handling control and reduced manufacturing complexity.
Market dynamics focus on cost-effective conveyor solutions that balance advanced operational performance with affordability considerations important to Australian manufacturing operators. Growing industrial development creates continued demand for modern conveyor systems in manufacturing and industrial modernization projects.
Strategic Market Considerations:
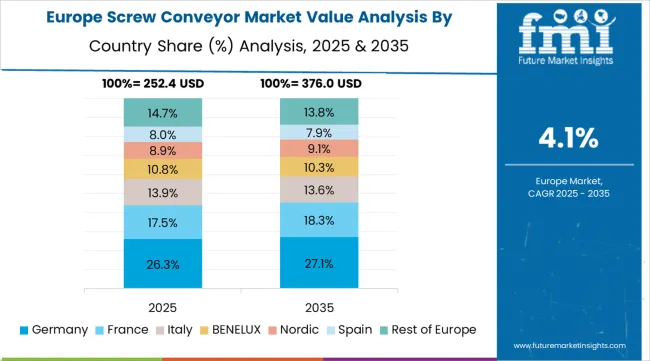
The European screw conveyor market is projected to grow from USD 0.28 billion in 2025 to USD 0.45 billion by 2035, registering a CAGR of 4.8% over the forecast period. Germany is expected to maintain its leadership position with a 35.0% market share in 2025, supported by its advanced manufacturing technology infrastructure and major industrial centers.
United Kingdom follows with a 18.2% share in 2025, driven by comprehensive manufacturing programs and conveyor technology development initiatives. France holds a 15.7% share through specialized manufacturing applications and material handling optimization requirements. Italy commands a 12.4% share, while Spain accounts for 9.1% in 2025. Netherlands maintains a 5.8% share, while other European countries account for 3.8% of the European market in 2025. The Rest of Europe region is anticipated to gain momentum, expanding its collective share from 7.2% to 7.6% by 2035, attributed to increasing manufacturing adoption in Nordic countries and emerging industrial facilities implementing technology modernization programs.
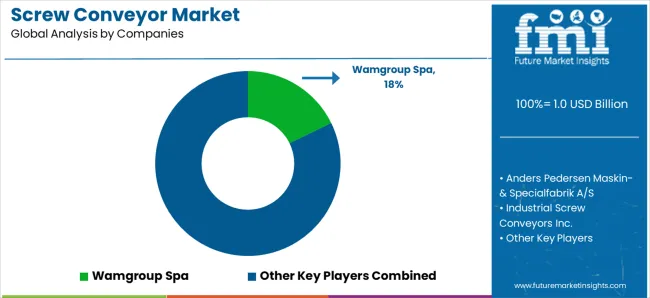
The screw conveyor market operates with moderate concentration, featuring approximately 35-40 meaningful participants, where leading companies control roughly 35-40% of the global market share through established manufacturing industry relationships and comprehensive conveyor portfolios. Competition emphasizes advanced material handling capabilities, system reliability, and industrial integration rather than price-based rivalry.
Market Leaders encompass Vac-U-Max, Inc., Anders Pedersen Maskin- &Specialfabrik A/S, and Industrial Screw Conveyors Inc., which maintain competitive advantages through extensive material handling expertise, global manufacturing contractor networks, and comprehensive system integration capabilities that create customer switching costs and support premium pricing. These companies leverage decades of conveyor technology experience and ongoing research investments to develop advanced transport systems with precision material handling control and industrial monitoring features.
Technology Innovators include Wamgroup Spa, DEMECH India, and SPIRAC Engineering Pty Ltd, which compete through specialized conveyor technology focus and innovative material handling interfaces that appeal to manufacturing operators seeking advanced efficiency capabilities and operational flexibility. These companies differentiate through rapid technology development cycles and specialized industrial application focus.
Regional Specialists feature companies like KWS Manufacturing Company Ltd, Martin Sprocket &Gear Inc., and specialized manufacturers, which focus on specific geographic markets and specialized applications, including custom systems and integrated manufacturing solutions. Market dynamics favor participants that combine reliable conveyor capabilities with advanced operational software, including precision material handling control and automatic transport optimization capabilities. Competitive pressure intensifies as traditional manufacturing contractors expand into conveyor systems, while specialized material handling companies challenge established players through innovative conveyor solutions and cost-effective systems targeting specialized industrial segments.
| Items | Values |
|---|---|
| Quantitative Units | USD 1 billion |
| Product Type | Horizontal Screw Conveyors, Inclined Screw Conveyors, Vertical Screw Conveyors, Shafted Screw Conveyors, Shaft-less Screw Conveyors |
| Rotation Capacity | Less than 45 RPM, 45-105 RPM, 105-165 RPM, Greater than 165 RPM |
| End Use | Mining and Metallurgy, Agriculture, Food and Beverage, Chemical, Pharmaceutical, Others |
| Regions Covered | North America, Latin America, Western Europe, Eastern Europe, East Asia, South Asia Pacific, Middle East &Africa |
| Countries Covered | United States, China, Germany, India, United Kingdom, Japan, Canada, Brazil, France, Australia, and 25+ additional countries |
| Key Companies Profiled | Vac-U-Max, Inc., Anders Pedersen Maskin- &Specialfabrik A/S, Industrial Screw Conveyors Inc., Wamgroup Spa, DEMECH India, SPIRAC Engineering Pty Ltd, KWS Manufacturing Company Ltd, Martin Sprocket &Gear Inc., Plåt &Spiralteknik I Torsås Ab, Xicon Corporation |
| Additional Attributes | Dollar sales by product type and end use categories, regional adoption trends across East Asia, North America, and Western Europe, competitive landscape with technology manufacturers and industrial suppliers, operator preferences for precision material handling control and system reliability. |
The global screw conveyor market is estimated to be valued at USD 1.0 billion in 2025.
The market size for the screw conveyor market is projected to reach USD 1.6 billion by 2035.
The screw conveyor market is expected to grow at a 4.8% CAGR between 2025 and 2035.
The key product types in screw conveyor market are horizontal screw conveyors, inclined screw conveyors, vertical screw conveyors, shafted screw conveyors and shaft-less screw conveyors.
In terms of end use, mining and metallurgy segment to command 27.4% share in the screw conveyor market in 2025.


Full Research Suite comprises of:
Market outlook & trends analysis
Interviews & case studies
Strategic recommendations
Vendor profiles & capabilities analysis
5-year forecasts
8 regions and 60+ country-level data splits
Market segment data splits
12 months of continuous data updates
DELIVERED AS:
PDF EXCEL ONLINE
Key Players & Market Share in Screw Conveyor Industry
Screw Compressor Market Size and Share Forecast Outlook 2025 to 2035
Screw Capping Machine Market Size and Share Forecast Outlook 2025 to 2035
Screwdriver Market Size and Share Forecast Outlook 2025 to 2035
Screw Top Jar Market Insight - Growth & Trends to 2025 to 2025
Screw Air End Market Growth – Trends & Forecast 2024-2034
Screw Jacks Market
Screw Top Lids Market
Screw Top Pails Market
Leadscrew Market
Twin Screw Extruders Market Size and Share Forecast Outlook 2025 to 2035
Pipe Screw Extruder Market Analysis - Size, Share, and Forecast Outlook 2025 to 2035
Bone Screw System Market Growth – Demand, Trends & Industry Forecast 2024-2034
Ball screw Market
Single Screw Extruder Market Size and Share Forecast Outlook 2025 to 2035
Pedicle Screw Positioning Market Analysis - Size, Share, and Forecast Outlook 2025 to 2035
Pedicle Screw Systems Market - Growth & Forecast 2025 to 2035
Electric Corkscrew Market
Polypropylene Screw Caps Market
Structural Wood Screws Market Size and Share Forecast Outlook 2025 to 2035

Thank you!
You will receive an email from our Business Development Manager. Please be sure to check your SPAM/JUNK folder too.
Chat With
MaRIA