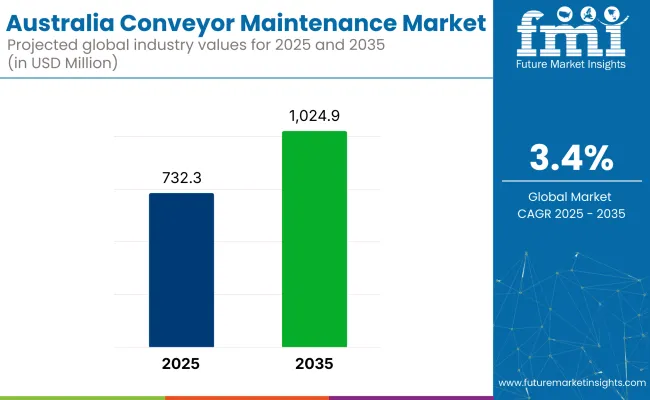
In 2025, the Australia conveyor maintenance market is expected to be valued at approximately USD 732.3 million and is anticipated to reach around USD 1,024.9 million by 2035, reflecting a compound annual growth rate (CAGR) of 3.4% during the forecast period. Demand is being driven by the critical need to ensure uninterrupted material handling across sectors where conveyor systems play a foundational role.
The mining sector, particularly in Western Australia and Queensland, continues to represent the largest source of demand for conveyor maintenance. Conveyor systems are deployed extensively across iron ore, coal, and lithium operations to transport bulk materials between extraction sites, processing plants, and ports. Rio Tinto’s recent contract with Fenner Conveyors, announced in 2025, illustrates the magnitude of maintenance operations in this sector.
According to Dan Luther, General Service Manager - WA at Fenner Conveyors, “At Cape Lambert alone in 2024, we installed a total of 42 km of conveyor belt across 104 different conveyor replacements for Rio Tinto Iron Ore equating to the change-out of one third of all conveyor belt within Rio Tinto’s Western Australia operations.” This ensures not only the critical scale of maintenance but also the strategic importance placed on conveyor uptime by major operators. BHP has also taken steps to improve conveyor performance through targeted innovation.
At its Mining Area C site, a project led by Senior Maintenance Planner Chris Ryde was recognized industry-wide for optimizing conveyor belt replacement procedures. Ryde noted, “It’s fantastic to be recognised… from an initiative that started with an idea to challenge the status quo and seek better outcomes for our people and our business.” These efforts underline how major companies are investing in both technology and process improvements to enhance safety and reduce downtime.
The agricultural sector also contributes to market expansion, particularly in grain handling, bulk loading, and on-farm storage. In grain-growing regions like New South Wales and Victoria, companies such as Allied Grain Systems rely on conveyors for harvest-to-storage logistics. Equipment maintenance, including belt inspections and system recalibration, is critical during high-output seasons to avoid post-harvest spoilage and transport delays. In logistics and warehousing, demand for maintenance services is rising with the growth of e-commerce and automated distribution.
Facilities operated by firms such as Australia Post and Toll Group depend on high-speed sorting conveyors that require regular servicing to maintain throughput. Additionally, the shift toward energy-efficient conveyors and smart monitoring systems has introduced new maintenance needs across all industrial segments. With rising adoption of predictive maintenance technologies-including IoT sensors, AI diagnostics, and real-time monitoring-many operations are shifting toward proactive strategies to reduce unplanned shutdowns and extend equipment life.
The table below represents the comparison of growth trajectories between the two consecutives halves of base and current year. H1 denotes the period between January and June while H2 represents the period between July and December.
The annual growth rates of the Australia conveyor maintenance market from 2025 to 2035 are illustrated below in the table. Starting with the base year 2024 and going up to the present year 2025, the report examined how the industry growth trajectory changes from the first half of the year, i.e. January through June (H1) to the second half consisting of July through December (H2).
This gives stakeholders a comprehensive picture of the sector’s performance over time and insights into potential future developments.
The table provided shows the growth of the sector for each half-year between 2024 and 2025. The market was projected to grow at a CAGR of 3.1% in the first half (H1) of 2024. However, in the second half (H2), there is a noticeable increase in the growth rate.
| Particular | Value CAGR |
|---|---|
| H1 2024 | 3.1% (2024 to 2034) |
| H2 2024 | 3.4% (2024 to 2034) |
| H1 2025 | 3.2% (2025 to 2035) |
| H2 2025 | 3.5% (2025 to 2035) |
Moving into the subsequent period, from H1 2024 to H2 2024, the CAGR is projected as 3.2% in the first half and grow to 3.5% in the second half. In the first half (H1) and second half (H2), the market witnessed an increase of 30 BPS each.
The market is segmented based on conveyor type, service type, component type, end use, and region. By conveyor type, the market is divided into rubber, metal, and plastic. In terms of service type, it is segmented into component fixing and maintenance services.
Based on component type, the market is categorized into conveyor belt, roller and idler, cleaner, and others (drive components, pulleys, bearings, belt tracking systems). In terms of end use, the market is classified into mining, industrial & automotive, pharmaceutical, food processing, and others (cement, power generation, packaging, recycling). Regionally, the market is analyzed across Australia.
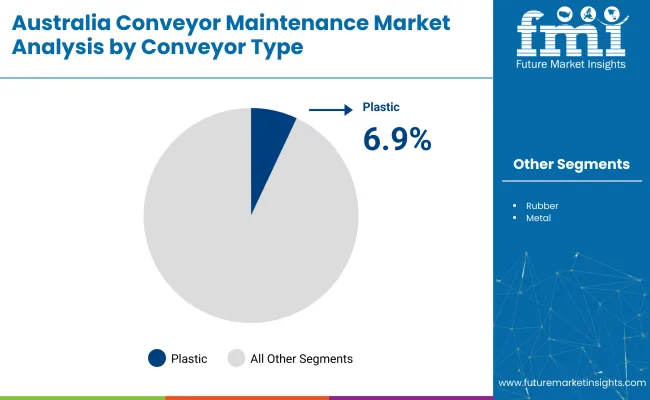
The plastic conveyor segment is projected to grow at the highest CAGR of 6.9% between 2025 and 2035. This growth is being fueled by rising demand for lightweight, energy-efficient, and corrosion-resistant conveyor solutions across Australia’s food processing, pharmaceutical, and packaging industries.
Stringent hygiene regulations in these sectors are driving rapid adoption of modular plastic belt conveyors, which offer superior cleaning and low maintenance requirements. Manufacturers are focusing on innovations such as FDA-compliant plastics and quick-change modular belt designs, making plastic conveyors highly adaptable to changing production needs. As Australia’s food exports and domestic packaged goods markets expand, plastic conveyors are expected to gain further traction.
Meanwhile, the rubber conveyor segment continues to dominate by volume and value, primarily due to its entrenched use in mining and heavy industrial applications. Rubber belts provide superior strength and abrasion resistance, making them ideal for transporting bulk materials in Australia’s resource-intensive sectors.
The metal conveyor segment maintains a smaller niche, particularly in high-temperature and precision manufacturing environments. Despite the dominance of traditional conveyor types, the increasing emphasis on sustainability, modularity, and ease of maintenance is expected to position plastic conveyors as the leading growth driver in the Australian market.
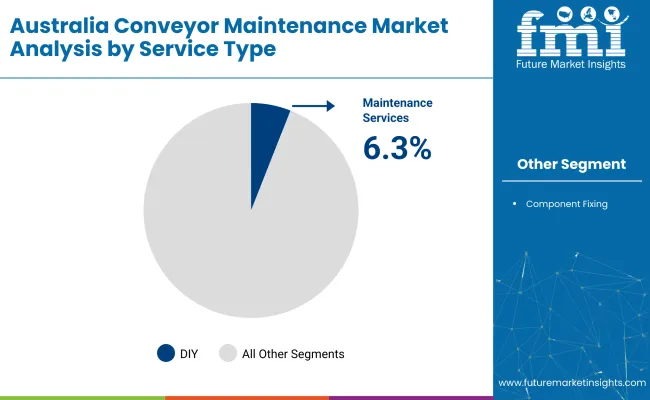
The maintenance services segment is projected to grow at the highest CAGR of 6.3% from 2025 to 2035. This growth is driven by increasing focus on reducing unplanned downtime and extending the service life of conveyor systems across key industries such as mining and industrial & automotive.
With conveyor systems playing a mission-critical role in bulk material handling, Australian operators are investing heavily in predictive maintenance, condition monitoring, and proactive service agreements. Advanced sensor-based monitoring and data-driven maintenance programs are being rapidly adopted to ensure early fault detection and optimize system uptime.
Meanwhile, the component fixing segment continues to contribute stable revenues, particularly in mining-heavy regions where field-based repairs and on-site component replacements are routine. Many operators in remote mining sites prefer targeted component fixing over complete overhauls, helping maintain operational continuity.
Component fixing is also being supported by innovations such as easy-to-install modular components and self-aligning idlers, which simplify repair workflows. The rising need for optimized conveyor performance, combined with growing investments in digital maintenance tools is expected to drive consistent demand for specialized maintenance services. As conveyor maintenance evolves from a reactive to a strategic discipline, service providers will play an increasingly pivotal role in Australia’s conveyor ecosystem.
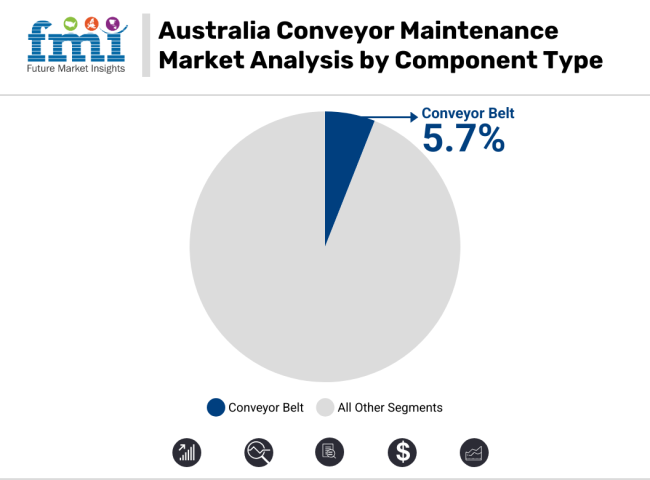
The conveyor belt segment is projected to maintain its dominance and grow at a steady CAGR of 5.7% between 2025 and 2035. Conveyor belts represent the most frequently serviced and replaced components in material handling systems, particularly in mining and heavy industry operations across Australia.
Continuous exposure to abrasive materials, extreme loads, and harsh environmental conditions results in significant wear and tear, fueling demand for both preventive maintenance and belt replacement services. Growing adoption of specialty belts including flame-retardant, oil-resistant, and low-noise variants further contributes to market expansion as operators seek belts tailored to specific operating environments.
Meanwhile, the roller and idler segment continues to record robust demand, as these components are critical for ensuring smooth conveyor operation and reducing belt misalignment. Innovations such as self-aligning idlers and low-friction rollers are improving system efficiency and reducing maintenance intervals. The cleaner segment also holds strategic importance, especially in food processing and mining, where belt cleaning systems help maintain hygiene standards and material flow efficiency.
The others segment including drive components, pulleys, bearings, and belt tracking systems supports steady aftermarket demand, driven by operator focus on maintaining optimal system performance. Comprehensive component maintenance is expected to remain a key focus across Australian industries.
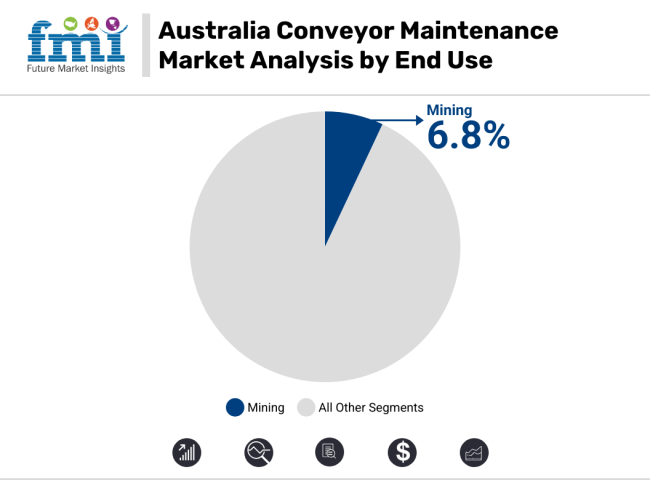
The mining segment is expected to register the highest CAGR of 6.8% between 2025 and 2035, maintaining its position as the leading end-use sector for conveyor maintenance services in Australia. The country’s mining industry relies heavily on extensive conveyor networks to transport vast volumes of iron ore, coal, bauxite, and copper across challenging terrain.
Continuous operation under abrasive and demanding conditions results in high conveyor wear rates, driving recurring demand for belt replacements, component repairs, and preventive maintenance. With mining operations prioritizing uptime and operational efficiency, investments in advanced condition monitoring and predictive maintenance solutions are on the rise.
Meanwhile, the industrial & automotive sector offers a stable revenue base, driven by the need for precision material handling in manufacturing plants and assembly lines. Conveyor maintenance is critical here to avoid production bottlenecks. The pharmaceutical and food processing segments are experiencing notable growth as well, as stringent hygiene standards require frequent cleaning and upkeep of conveyor systems. These industries increasingly adopt plastic modular belts and easy-to-maintain components.
The others segment which includes cement, power generation, packaging, and recycling supports diversified demand. Sustainability trends and circular economy initiatives are further enhancing conveyor maintenance needs in packaging and recycling operations.
Between 2020 and 2024, the target market registered growth rate of 5.8% by reaching a value of USD 4,327.9 million in 2024 from USD 3,456.8 million in 2020.
The Australia Conveyor Maintenance market was moderately rising in the period 2020 to 2024 as a result of increased industrial automation & the activity of mining and logistics. The market growth was further fueled by the focus on operational costs reduction and efficiency improvement.
The market which is expected to grow at a slow but steady phase during these years is largely dependent on the adoption of advanced conveyor technologies and predictive maintenance practices by industries & companies.
The expected continuous need for maintenance services comes from the expansion of the e-commerce and warehousing sector in Australia along with the rise of the renewable energy projects that employ conveyor systems.
All these factors have played pivotal role in expanding the demand for conveyor maintenance market across Australia in 2020 to 2024.
Looking ahead to 2025 to 2035, the market is anticipated to grow faster. Conveyors are present in almost all manufacturing facilities. They often play a critical role in production and material handling processes. Warehouses and manufacturing facilities can feature various types of conveyor systems.
They are a great way to automate the flow of goods and materials in an industrial facility, leading to fewer bottlenecks and a more constant process flow. The main culprits for the lack of maintenance is the fact that conveyor systems are designed to operate round-the-clock and have a lot of moving parts spread over a large area.
To perform any significant maintenance work, the whole conveyor system has to be stopped. Oftentimes, this means that a portion of factory operations (or all of them) have to be halted. Unfortunately, this delay in maintenance often causes problems down the line. Small problems compound and result in major expensive breakdowns that could have been avoided.
Increasing implementation of conveyor auditing practice providing significant boost to conveyor maintenance services
Conveyor auditing is a prime preventive maintenance technique that industries in Australia such as mining have embraced.
Audits are aimed at tackling specific issues like areas for improvement, cutting down the total cost of ownerships, and solving performance problems in accordance to Australian Standards (AS1755 to 2000 Conveyor Safety). This above-average approach not only brings about improved operational reliability but also cut back on workers' risks.
Customized conveyor audits are a sure-fire way of facilitating smooth operations in the facilities through the early detection of potential problems e.g. a belt tracking issue, an idler misalignment, and a pulley wear.
As audits curtail unanticipated shutdowns and expensive repairs by utilizing a "safety first" culture, they also promote a "safety first" way of operational work. These audits not only provide detailed reports but they also recommend effective actions which can be undertaken.
More and more resources to maintain equipment and prevent breakdowns are spent with a view to maximizing the lifecycle of critical parts. The maintenance teams are, hence, able to carry out the repairs and replacements in a smart way. This approach cuts down the unplanned stoppages and at the same time increases the overall productivity. This approach results in big savings on cost as well as on better work efficiency in the facilities.
Such practices represent the pre-emptive and productivity-centric conveyor maintenance ethos in Australia as industries drive competitiveness, safety, and cost efficiency.
Use of novel materials to ease out conveyor maintenance operations
The Australian conveyor maintenance market is making use of impact reduction technologies in order to improve system efficiency and durability. Industries, particularly the mining and the bulk handling are at the forefront of the adoption of the next generation of impact bars and beds in order to reduce damage due to the loading of heavy, sharp-edged, and abrasive materials on conveyor belts.
The consequence of this action is that the wear on the most affected components, which include rollers and belts, is considerably diminished, and this leads to fewer costly breakdowns and at the same time extends the life of the whole conveyor system.
The use of ultra-high molecular weight polyethylene (UHMWPE) as a new material has become a necessary part of the solutions for impact reduction. It is a high abrasion-resistant material, which minimizes friction and is chemically stable, making it possible to ensure longer maintenance intervals and also make a contribution to environmental sustainability.
Modular impact beds' designs with pin-lock systems and self-adjustable components are the answer to maintenance problems and reduce downtime associated with the operational efficiency push of the industry.
The purchase of heavy-duty impact beds that deal with high-intensity loads and large materials are now on the rise as organizations become more serious about working in high-impact environments. The increased focus on durable and easy-to-maintain impact solutions indicates that the market is concentrated on cutting operational costs and boosting conveyor system performance.
This trend is an active sign of the movement of the conveyor maintenance market of Australia from traditional to advanced, cost-effective, and eco-friendly practices.
Adoption of diverter ploughs improving conveyor maintenance operations
Diverter ploughs are rapidly becoming a popular choice among Australian industries as a means to optimize conveyor maintenance and move to a more cost effective operation. It is possible for operators to get rid of the material from conveyor belts on their own without shutting down the line, so the belt will continue to operational in the mining and bulk material handling. By material directing, the diverter ploughs, in a very clever way, do away with the downtime and make the maintenance task easier.
Engineers craft the diverter ploughs in such a way as to maximize the integration with the existing conveyor systems, which in its turn enhances flexibility and durability. The operators have the option to hoist or lower the plough whenever they decide, so it is possible to run the conveyor normally when the plough is not in the action.
The results of the implementation, like the one in the biggest iron ore mine in Western Australia, are the proof of the success of this technique. They had the power to change the flow of the material and divert as much as 4,500 tonnes per hour while supporting the stockpiling process and the construction of the new infrastructure.
Manufacturers' choice of durable materials is an assured way of increasing products' life and conveyor belts' safety, as well as the use of discharge chutes personalized to the operation's needs. Customization of various designs, discharge chutes for example, is a key benefit of this plough, which can be fitted to the specific needs of material handling.
The rise of the diverter ploughs signifies the Australian focus on the modernization of conveyors' maintenance practices by using cost-effective cutting edge solutions.
High operational and labor costs associated with maintaining conveyor systems
Australia’s stringent workplace safety regulations and high wages make repairs and inspections costly, particularly in remote mining and industrial regions. Additionally, the harsh operating environments, such as extreme heat, dust, and humidity, cause frequent wear and tear, necessitating more frequent maintenance and replacement of components, which adds to operational downtime.
The shortage of skilled labor in remote areas further exacerbates delays in maintenance activities. Furthermore, supply chain disruptions, particularly in procuring specialized spare parts, can lead to extended equipment downtime, impacting productivity.
Lastly, the adoption of advanced predictive maintenance technologies is slow due to high initial investments and a lack of awareness among small and medium-sized enterprises (SMEs), leaving them reliant on reactive maintenance practices, which are less efficient and more costly in the long term. These challenges collectively impact the overall efficiency and profitability of conveyor operations in Australia.
Tier 1 companies comprise players with a revenue of above USD 100 million capturing a significant share of 40-45% in the Australia conveyor maintenance market.
These players are characterized by high maintenance service systems and a diverse maintenance service offered across several industries. These leaders are distinguished by their extensive expertise in manufacturing and reconditioning across multiple conveyor maintenance application and a broad geographical reach, underpinned by a robust consumer base.
Prominent companies within Tier 1 include ContiTech Australia Pty. Ltd., Endless Belt Service Pty Ltd., Fenner Dunlop Australia Pty Ltd., and other players.
Tier 2 companies include mid-size players with revenue of below USD 100 million having a presence in specific regions and highly influencing the local industry. These are characterized by a strong presence overseas and strong industry knowledge.
These players have good technology and ensure regulatory compliance but may not have advanced technology and wide regional reach. Prominent companies in tier 2 include Flexible Steel Lacing Company (Flexco), Kinder Australia Pty Ltd., Mato GmbH & Co. KG., and other player.
Key companies engaged in the Australia conveyor maintenance slightly consolidate the market with about 50-55% share that are prioritizing technological advancements, integrating sustainable practices, and expanding their footprints in the region.
Customer satisfaction remains paramount, with a keen focus on offering maintenance services to meet diverse applications. These industry leaders actively foster collaborations to stay at the forefront of innovation, ensuring their conveyor maintenance align with the evolving demands and maintain the highest standards of quality and adaptability.
Recent Industry Developments
The Conveyor Type segment is further categorized into Rubber, Metal, and Plastic.
The Service Type segment is classified into Component Fixing and Maintenance Services.
The Component Type segment is classified into Conveyor Belt, Roller & Idler, Cleaner, and Others.
The End Use segment is classified into Mining, Industrial & Automotive, Pharmaceutical, Food Processing, and Others.
The Australia market is expected to reach USD 1,024.9 million by 2035, growing from USD 732.3 million in 2025, at a CAGR of 3.4% during the forecast period.
The plastic segment is projected to lead the market, owing to its durability, flexibility, cost-effectiveness, and widespread use.
The mining sector is the dominant application segment, supported by Australia’s strong mining industry, increasing investments in automation, and the need for efficient material handling solutions across large-scale mining operations.
Key drivers include the adoption of diverter ploughs to optimize maintenance operations, advancements in novel materials improving conveyor system longevity, and growing emphasis on minimizing downtime in high-capacity mining environments.
Top companies include Fenner Dunlop, NEPEAN Conveyors, Belle Banne Conveyor Products, RCR Mining Technologies, and Kinder Australia, known for innovative maintenance solutions, superior materials, and extensive service networks across Australia’s mining hubs.


Our Research Products

The "Full Research Suite" delivers actionable market intel, deep dives on markets or technologies, so clients act faster, cut risk, and unlock growth.

The Leaderboard benchmarks and ranks top vendors, classifying them as Established Leaders, Leading Challengers, or Disruptors & Challengers.

Locates where complements amplify value and substitutes erode it, forecasting net impact by horizon

We deliver granular, decision-grade intel: market sizing, 5-year forecasts, pricing, adoption, usage, revenue, and operational KPIs—plus competitor tracking, regulation, and value chains—across 60 countries broadly.

Spot the shifts before they hit your P&L. We track inflection points, adoption curves, pricing moves, and ecosystem plays to show where demand is heading, why it is changing, and what to do next across high-growth markets and disruptive tech

Real-time reads of user behavior. We track shifting priorities, perceptions of today’s and next-gen services, and provider experience, then pace how fast tech moves from trial to adoption, blending buyer, consumer, and channel inputs with social signals (#WhySwitch, #UX).

Partner with our analyst team to build a custom report designed around your business priorities. From analysing market trends to assessing competitors or crafting bespoke datasets, we tailor insights to your needs.
Supplier Intelligence
Discovery & Profiling
Capacity & Footprint
Performance & Risk
Compliance & Governance
Commercial Readiness
Who Supplies Whom
Scorecards & Shortlists
Playbooks & Docs
Category Intelligence
Definition & Scope
Demand & Use Cases
Cost Drivers
Market Structure
Supply Chain Map
Trade & Policy
Operating Norms
Deliverables
Buyer Intelligence
Account Basics
Spend & Scope
Procurement Model
Vendor Requirements
Terms & Policies
Entry Strategy
Pain Points & Triggers
Outputs
Pricing Analysis
Benchmarks
Trends
Should-Cost
Indexation
Landed Cost
Commercial Terms
Deliverables
Brand Analysis
Positioning & Value Prop
Share & Presence
Customer Evidence
Go-to-Market
Digital & Reputation
Compliance & Trust
KPIs & Gaps
Outputs
Full Research Suite comprises of:
Market outlook & trends analysis
Interviews & case studies
Strategic recommendations
Vendor profiles & capabilities analysis
5-year forecasts
8 regions and 60+ country-level data splits
Market segment data splits
12 months of continuous data updates
DELIVERED AS:
PDF EXCEL ONLINE
Conveyor Belt Market Size and Share Forecast Outlook 2025 to 2035
Conveyor System Market Size and Share Forecast Outlook 2025 to 2035
Conveyor Drives Market Analysis - Size, Share, and Forecast Outlook 2025 to 2035
Conveyor Dishwasher Market Size and Share Forecast Outlook 2025 to 2035
Conveyor Dryer Market Growth, Trends & Forecast 2025 to 2035
Conveyors and Belt Loaders Market Growth - Trends & Forecast 2025 to 2035
Conveyor Belt Materials Market
Conveyor Belt Tracking Devices Market Size and Share Forecast Outlook 2025 to 2035
Conveyor Ovens & Impinger Ovens Market
UV Conveyor Systems Market
Pack Conveyors Market Size and Share Forecast Outlook 2025 to 2035
Screw Conveyor Market Size and Share Forecast Outlook 2025 to 2035
ASEAN Conveyor System Market Growth - Trends & Forecast 2024 to 2034
Chain Conveyors Market Size and Share Forecast Outlook 2025 to 2035
Smart Conveyor Packaging Systems Market Analysis Size and Share Forecast Outlook 2025 to 2035
Key Players & Market Share in Screw Conveyor Industry
Rubber Conveyor Belt Market Size, Growth, and Forecast 2025 to 2035
Gravity Conveyor System Market Size and Share Market Forecast and Outlook 2025 to 2035
Modular Conveyor System Market
Gravity Conveyor Market

Thank you!
You will receive an email from our Business Development Manager. Please be sure to check your SPAM/JUNK folder too.
Chat With
MaRIA