Conveyor System Market
Market Insights on Conveyor System covering sales outlook, demand forecast & up-to-date key trends
Conveyor System Market by Product Type, Operation, Capacity, Application & Region - Forecast 2021 – 2031
Conveyor System Market Outlook ( 2021 - 2031)
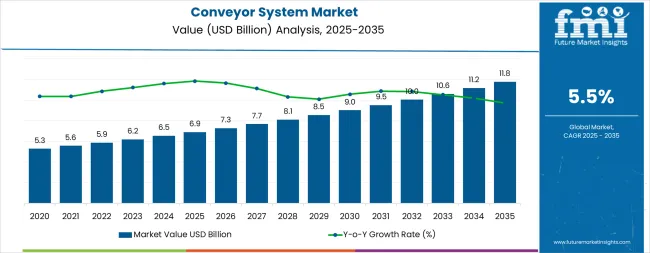
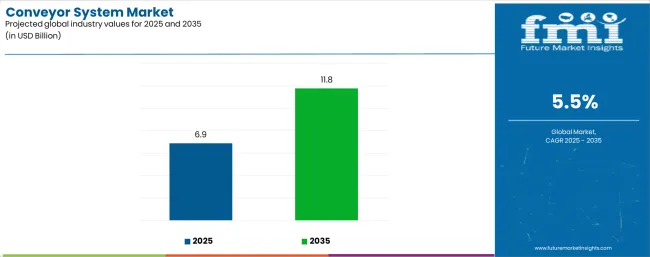
[357 Pages Report] The Conveyor system market will register steady growth with the overall valuation forecast to surpass US$ 13.7 Bn in 2021. The market’s worth will increase at a compound annual growth rate (CAGR) of 4.5% between 2021 and 2031. Global Conveyor system sales are expected to return to 2019 level, with shipments expected to reach 16,000 units by the end of 2031, says FMI.
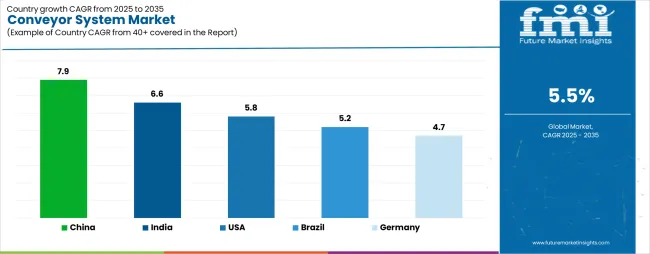
Regionally, the North America market is set to expand at 3.5% CAGR over the course of the assessment period. The growth can be attributed thriving e-commerce industry and expansion of packaging centers in the U.S. and Canada.
Let us know your requirement to get
100% FREE customization
Conveyor System Market Key Points Covered
- Conveyor system market estimates and forecast 2021 – 2031
- Key drivers and restrains impacting market growth
- Segment-wise, Country-wise, and Region-wise Analysis
- Competitive Mapping and Benchmarking
- Brand share and Market Share Analysis
- Key Product Innovations and Regulatory Climate
- COVID-19 Impact On Conveyor System Market and How to Navigate
- Recommendation on Key Winning Strategies
Conveyor System Market - Outlook 2016 – 2020 in Comparison to 2021 – 2031 Forecasts
Rise in intralogistic operations and reduction in conventional supply chain activities resulted in growth of the Conveyor system market in the past five years. The market registered 3.1% CAGR from 2016 to 2020, says Future Market Insights.
Conveyor systems are integral parts of transportation module in commercial and industrial facilities. Automation in conveyor system has reduced production time and overall cost of manufacturing. Rising urbanization and industrialization in emerging economies of Asia and Middle East will fuel the demand for conveyor systems.
Customization to accommodate the requirements of diverse end users has resulted in the development of new conveyor systems with modified design and automated features. Besides this, the rising number of shopping malls and airports in middle income countries has triggered the demand for belt conveyors.
Growing complexity of supply chain and business processes and increasing demand from consumers have encouraged end users to incorporate industrial automation solutions such as conveyor systems to facilitate inline operation and production. This in turn will lead to high demand for warehouse space, which is expected to push the sales of conveyor systems.
Leading market players are looking to capitalize on thriving warehousing and retail industry and increasing investments towards modernization of airports. For instance, BEUMER GROUP received the contract from airport operator, Avinor, to design, integrate, operate, and deliver new CrisBag® tote-based baggage handling system (BHS) at Oslo airport in 2021.Their efforts towards expansion will prove chief growth driver of the market.
What is the Impact of Circular Economy on Conveyor System Market?
Stringent government regulations and initiatives adopted by industries towards reducing carbon footprint have encouraged manufacturers to move towards circular economy.
Conveyor systems consume tremendous energy especially systems that use old electric motors. Market players are working towards developing efficient products to reduce the energy costs and in turn limit the carbon emission.
Leading market players are collaborating to develop optimized machine drives, cooling systems along with replacing the conveyor belt material with lighter and more durable alternative to become more energy-efficient.
For instance, DuPont collaborated with Regina and developed new environmentally friendly Regina E-F.A.S.T. material for high speed conveyor system DuPont™ Delrin® for filling lines.
Find your sweet spots for generating winning opportunities in this market.
Talk to AnalystWhat is the Impact of Industry 4.0 on Conveyor System Market?
An increasing numbers of industries are incorporating Industry 4.0 techniques to upgrade their existing conveyor systems. They are integrating machine learning and industrial internet of things with existing infrastructure to optimize their production and improve efficiency.
Changing preference of consumers and need to create agile environment to cater to these trends will positively influence the market in upcoming years.
Industries are looking for compact, low maintenance, and smart conveyor system for their processing and manufacturing plants. Rising industrialization in developing countries and extensive research undertaken by market players to develop a multi-utility and flexible conveyor system, will drive the conveyor system market in upcoming years.
Integration of smart sensors and advanced communication systems with automated conveyor system and development of smarter motors and controllers for easier and quieter operations will accelerate the market growth in upcoming years.
Conveyor System Market Country-wise Analysis
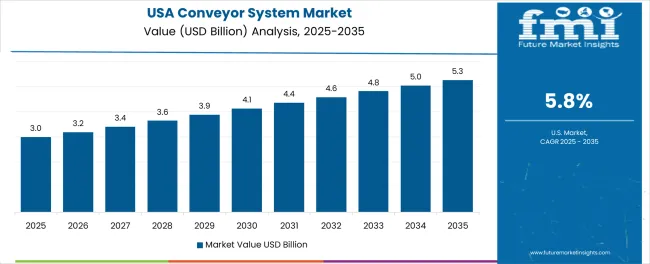
Why Is U.S leading the Conveyor System Market?
United States Department of Transportation reports that air passenger traffic in U.S. experienced 1% year-on-year growth for 2019 reaching 19.887 million passengers.
The U.S. government is investing towards expanding old airports and developing new ones to handle this increase in air traffic and air freight transport. This investment is expected to bode well with conveyor market growth in the country.
Distribution centers in the U.S. prefer pallet conveyor system owing to its compact size and heavy load bearing capacity. Increase in per capita income, favorable government policies and changing lifestyle has created ideal environment for growth of hypermarkets and their distribution centers.
Meteoric rise of supermarket chains like Wal-Mart and Kroger Co. and their associated distribution centers will drive the sales of pallet conveyor systems in U.S.
How big is the Growth Opportunity in Germany?
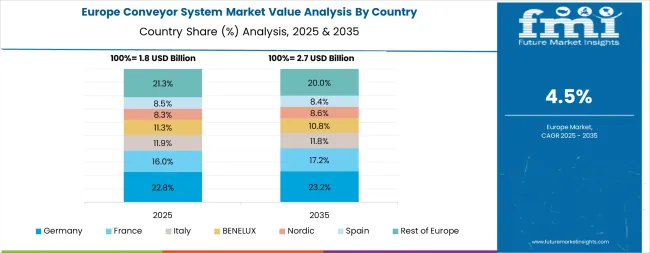
Germany is expected to lead the Europe conveyor system market over the forecast period due to presence of technologically advance automotive industry and thriving food and beverage industry.
Germany is the epicenter of Industry 4.0 revolution. German automotive companies are investing towards integrating smart technologies to make their manufacturing facilities fully automated which includes conveyor system.
For instance, in September 2020, leading German automaker Mercedes-Benz opened its new manufacturing plant in Sindelfingen with an investment of US$ 864 million. The assembly plant plans to set the bars for sustainability and digital production to new level. The new hybrid and electric cars are expected to roll off the Conveyor belts in upcoming years.
Rising research activities, thriving online retails and e-commerce industry, and the growing automotive industry in the country is providing attractive opportunities for conveyor system manufacturers in the long-term.
What is Driving Conveyor System Market Growth in China?
Conveyor systems are finding application in agriculture and food and beverage industries in China. Modernization in food processing industry and introduction of automated production lines in packaged food and beverage industry are predicted to fuel the demand for belt conveyor systems in the country.
Population growth and growing demand for convenient food items are encouraging manufacturers to integrate automation in their manufacturing plants to boost production efficiency.
Leading beverage packaging, dairy product packaging, and ready to eat food packaging companies are employing standard conveyor belt systems for transporting goods across the plant.
According to World Bank in 2020, agriculture and related activities in China account for more than 7% of its total GDP. Increasing initiatives undertaken to encourage agricultural activities and advancement in food processing activities are forecast to drive growth in demand for food grade conveyor belts system in China.
What Is Influencing Conveyor System Market Growth In India?
The demand for conveyor system in India is on the rise due to the growth of e-commerce industry and consequent expansion of warehousing. Increasing production and sales of medicines and personal protective equipment (PPE) kits further boosted the market growth in the country.
Indian Brand Equity Foundation predicted that Indian e-commerce market is expected grew 5.19X and reach market valuation of US$ 200 billion by 2026. Increasing demand for warehousing due to booming e-commerce industry and lack of space and natural resources will increase the demand for smart and compact conveyor systems in India.
During COVID-19 pandemic, demand for medical equipments and medicines skyrocketed in India, leading to increased manufacturing of personal protective equipment (PPE) kits and pharmaceutical drugs. Rising need to ensure smooth supply of essential items boosted the demand for material handling equipments in India.
Rise in export of hydroxychloroquine (HCQ) tablets and spike in production of medicines and pharmaceutical drugs are predicted to boost the demand for conveyor systems in India.

A unified Market Research Subscription Platform, built for today's disparate research needs.
Conveyor System Market Category-wise Insights
Why Are Belt Conveyors High in Demand?
Belt type conveyors are expected to register significant growth over the forecast period owing to its low maintenance and easy installation features. They are also an integral part of airport baggage system. Rise in number of passengers at airport and modernization, expansion, and establishment of new airports will drive the conveyor belt market growth.
COVID-19 imposed lockdown led to closure of manufacturing facilities and shutdown of business operations. Restarting of manufacturing plants with fraction of its original production rate, lack of conveyor belt raw material, and disrupted supply chain will negatively influence the demand of belt conveyor system.
Why Are Automated Conveyor Systems Gaining Popularity?
Automated conveyor systems are used in sorting, cross-docking, and distribution and warehousing operations. Retailers are switching towards automated system to optimize warehouse space utilization and keep up with the demand spikes occurred during COVID-19 pandemic.
Growth in online retailing and introduction of Industry 4.0 will transform supply chain operations, which in turn will drive the demand for automated conveyor system to store, track and move materials with minimum human intervention.
Which Are The Key Areas Of Application Of Conveyor System?
By application type, automotive and transportation industry will exhibit highest growth rate owing to increase in vehicle production rate and rising popularity of electric vehicles in developed nations. Automotive plants prefer overhead Conveyors owing to their high load carrying capacity and it also improves the efficiency of the automotive plant and boost production rate.
Packaging and warehousing is also gaining traction owing to growing e-commerce industry, rapid globalization and surge in international import and export activities. Rising need for optimum utilization of warehouse space and quick retrieval will drive the sales of automated conveyor systems in the future.
Conveyor System Market Competitive Landscape
As per the market analysis, presence of large number of regional and multinational market players has left the Conveyor system market fragmented. Rise in number of manufacturers is due to low manufacturing cost and very high demand.
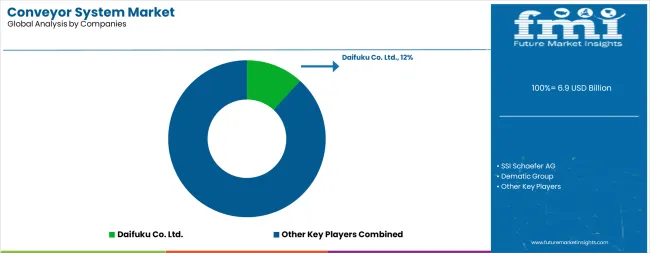
Future Market Insights (FMI) states that top Conveyor system market players account for more than 20% of global market share, whereas other small and medium-sized regional players accounted for more than 70% market share in 2021.
Conveyor system market players are entering into collaboration with multiple end users to install their Conveyor systems and gain decisive advantage in this competitive domain.
For instance in February 2021, Daifuku Co. Ltd. signed an agreement with Germany-based AFT Industries AG to collaborate on a project-by-project basis by utilizing AFT’s automotive customer base and technologies and Daifuku’s extensive global network, to provide better offering to customers in automotive domain which includes automated conveyor system.
In June 2021, SSI Schaefer partnered with Coca Cola Amatil to design and deliver flexible, agile and accurate Conveyor system to their automated state-of-the-art distribution center in Brisbane, Australia.
Conveyor System Market – Report Scope
Attribute |
Details |
Forecast Period |
2021 – 2031 |
Historical Data Available for |
2016 – 2020 |
Market Analysis |
US$ Mn for Value & Units for Volume |
Key Regions Covered |
North America, Latin America, Europe, East Asia, South Asia, Oceania, and Middle East & Africa |
Key Countries Covered |
U.S., Canada, Brazil, Mexico, Argentina, Rest of Latin America, Germany, U.K., France Italy, China, India, Japan, GCC Countries, South Africa, Israel, Turkey, Iran, Rest of Middle East & Africa, Australia, New Zealand, South Korea, the Philippines, Malaysia, and Thailand |
Key Segments Covered |
By Product Type, By Operation Type, By Capacity Type, By Application Type, and By Region |
Key Companies Profiled |
Daifuku, BEUMER GROUP, Interroll Holding AG, Murata Machinery, Schaefer Systems International and Dürr Group |
Report Coverage |
Market Overview, Market Background, Market Forecast, Segmental Analysis, Regional Profiling and Competition Analysis |
Customization & Pricing |
Available upon Request |
Conveyor System Market Key Segments
By Product Type:
- Belt Conveyor
- Roller Conveyor
- Pallet Conveyor
- Overhead Conveyor
- Tri-Planar Conveyor
- Crescent Conveyor
- Skid Conveyor
- Trailer Conveyor
- Others
By Operation Type:
- Manual
- Semi-Automatic
- Automatic
By Capacity Type:
- Unit Handling
- Bulk Handling
By Application Type:
- Packaging & Warehouse Distribution
- Textile & Paper
- Construction & Mining
- Automotive & Transportation
- Consumer Electronics
- Food & Beverage
- Chemical & Pharmaceutical
By Region:
- North America
- Latin America
- Europe
- East Asia
- South Asia
- Oceania
- Middle East and Africa
Frequently Asked Questions
What is Conveyor system market size?
Driven by technological advancement in Conveyor system to make them affordable to small manufacturers, the Conveyor system market size is forecast to reach US$ 13.7 Bn in 2021 with a CAGR of 4.5%.
At what rate did the Conveyor system market expand in the last five years?
Between 2016 and 2020, the Conveyor System sales grew at 3.1% CAGR.
What are the key trends shaping the Conveyor system market?
Strategic merger and acquisitions by tier-1 companies and technology integration of Conveyor system with material handling solutions are few of the key trends shaping the Conveyor System market.
Who are the key exporters operating in Conveyor system market?
Germany, Japan, and U.S. are the leading exporters of Conveyor system in the world.
What is the North America Conveyor system market outlook?
Demand registered in North America will continue rising, backed by increasing manufacturing and export of Conveyor system from U.S. and Canada, the North America market is anticipated to expand at 3.5% CAGR during the forecast period.
Who are the leading companies in Conveyor system market?
Daifuku Co. ltd., Schaefer Systems International Inc., Interroll Holding AG, BEUMER GROUP, and Dematic Company are the top companies operating in the market.
What is the share of top companies in Conveyor system market?
As of 2020, Daifuku Co. Ltd. hold around 7% share in global Conveyor system market followed by Schaefer Systems International Inc. with 5%, Beumer Group and Dematic Company with 4% and Interroll Holding AG with around 3.5% of global market share.
At what rate will Conveyor system sales increase in Europe?
Conveyor System sales will increase at 3.4% CAGR in Europe, backed by thriving mining industry in the U.K., Germany and other countries.
Which are the top countries driving Conveyor system market demand?
Leading countries driving demand in the Conveyor System market are Germany, Japan and U.S.
what are the key statistics for Conveyor system market in Japan and South Korea?
Currently in 2021, Japan and South Korea collectively hold around 7% of global Conveyor system market share.
Table of Content
1. Executive Summary 1.1. Global Market Outlook 1.2. Demand Side Trends 1.3. Supply Side Trends 1.4. Analysis and Recommendations 2. Market Overview 2.1. Market Coverage / Taxonomy 2.2. Market Definition 3. Market Developments 4. Key Success Factors 5. Regional Opportunity Mapping 6. Global Market Demand Analysis 2016 - 2020 and Forecast, 2021 - 2031 6.1. Historical Market Volume (‘000 Mtrs) Analysis, 2016 - 2020 6.2. Current and Future Market Volume (‘000 Mtrs) Projections, 2021 - 2031 6.3. Y-o-Y Growth Trend Analysis 7. Global Market - Pricing Analysis 7.1. Regional Pricing Analysis By Product 7.2. Pricing Break-up 7.3. Global Average Pricing Analysis Benchmark 8. Global Market Demand (in Value or Size in US$ Mn) Analysis 2016 - 2020 and Forecast, 2021 - 2031 8.1. Historical Market Value (US$ Mn) Analysis, 2016 - 2020 8.2. Current and Future Market Value (US$ Mn) Projections, 2021 - 2031 8.2.1. Y-o-Y Growth Trend Analysis 8.2.2. Absolute $ Opportunity Analysis 9. Market Background 9.1. Macro-Economic Factors 9.1.1. Global GDP Growth 9.1.2. Global Population Overview 9.1.3. Global Infrastructural Investment Overview 9.1.4. Global Manufacturing Sector Overview 9.1.5. Packaging Market Outlook 9.1.6. Global Automotive Production 9.1.7. Global Food & Beverage Industry Overview 9.1.8. Global Regional Logistics Facilities Overview 9.1.9. Global Logistics Performance Index 9.1.10. Global E-commerce Market 9.1.11. Trends in Warehouse & Distribution 9.1.12. Rubber Industry Overview 9.1.13. Iron Ore Production and Reserves 9.1.14. Cement Production Outlook 9.1.15. Coal Reserves Overview, 2018 9.1.16. Coal Production and Consumption Outlook 9.1.17. Crude Steel Production 9.2. Forecast Factors - Relevance & Impact 9.3. Value Chain 9.4. Market Dynamics 9.4.1. Drivers 9.4.2. Restraints 9.4.3. Trends 9.4.4. Opportunity Analysis 9.4.5. Regulatory Scenario 10. Global Market Analysis 2016 - 2020 and Forecast 2021 - 2031, by Product Type 10.1. Introduction / Key Findings 10.2. Historical Market Size (US$ Mn) and Volume Analysis By Product Type, 2016 - 2020 10.3. Current and Future Market Size (US$ Mn) and Volume Analysis and Forecast By Product Type, 2021 – 2031 10.3.1. Belt Conveyor 10.3.2. Roller Conveyor 10.3.3. Pallet Conveyor 10.3.4. Overhead Conveyor 10.3.5. Tri-Planar Conveyor 10.3.6. Crescent Conveyor 10.3.7. Skid Conveyor 10.3.8. Trailer Conveyor 10.3.9. Others 10.4. Market Attractiveness Analysis By Product Type 11. Global Market Analysis 2016 - 2020 and Forecast 2021 - 2031, by Operation 11.1. Introduction / Key Findings 11.2. Historical Market Size (US$ Mn) and Volume Analysis By Operation, 2016 - 2020 11.3. Current and Future Market Size (US$ Mn) and Volume Analysis and Forecast By Operation, 2021 – 2031 11.3.1. Manual 11.3.2. Semi-Automatic 11.3.3. Automatic 11.4. Market Attractiveness Analysis By Operation 12. Global Market Analysis 2016 - 2020 and Forecast 2021 - 2031, by Capacity 12.1. Introduction / Key Findings 12.2. Historical Market Size (US$ Mn) and Volume Analysis By End Use Industry, 2016 - 2020 12.3. Current and Future Market Size (US$ Mn) and Volume Analysis and Forecast By Capacity, 2021 – 2031 12.3.1. Unit Handling 12.3.2. Bulk Handling 12.4. Market Attractiveness Analysis By Capacity 13. Global Market Analysis 2016 - 2020 and Forecast 2021 - 2031, by End Use Industry 13.1. Introduction / Key Findings 13.2. Historical Market Size (US$ Mn) and Volume Analysis By End Use Industry, 2016 - 2020 13.3. Current and Future Market Size (US$ Mn) and Volume Analysis and Forecast By End Use Industry, 2021 – 2031 13.3.1. Packaging & Warehouse Distribution 13.3.2. Textile & Paper 13.3.3. Construction & Mining 13.3.4. Automotive & Transportation 13.3.5. Consumer Electronics 13.3.6. F&B 13.3.7. Chemicals & Pharmaceutical 13.4. Market Attractiveness Analysis By End Use Industry 14. Global Market Analysis 2016 - 2020 and Forecast 2021 - 2031, by Region 14.1. Introduction 14.2. Historical Market Size (US$ Mn) and Volume Analysis By Region, 2016 - 2020 14.3. Current Market Size (US$ Mn) and Volume Analysis and Forecast By Region, 2021 – 2031 14.3.1. North America 14.3.2. Latin America 14.3.3. Europe 14.3.4. South Asia 14.3.5. East Asia 14.3.6. Oceania 14.3.7. Middle East and Africa (MEA) 14.4. Market Attractiveness Analysis By Region 15. North America Market Analysis 2016 - 2020 and Forecast 2021 - 2031 15.1. Introduction 15.2. Pricing Analysis 15.3. Historical Market Size (US$ Mn) and Volume Trend Analysis By Market Taxonomy, 2016 - 2020 15.4. Market Size (US$ Mn) and Volume Forecast By Market Taxonomy, 2021 – 2031 15.4.1. By Country 15.4.1.1. U.S. 15.4.1.2. Canada 15.4.2. By Product Type 15.4.3. By Operation 15.4.4. By Capacity 15.4.5. By End Use Industry 15.5. Market Attractiveness Analysis 15.5.1. By Country 15.5.2. By Product Type 15.5.3. By Operation 15.5.4. By Capacity 15.5.5. By End Use Industry 15.6. Drivers and Restraints - Impact Analysis 16. Latin America Market Analysis 2016 - 2020 and Forecast 2021 - 2031 16.1. Introduction 16.2. Pricing Analysis 16.3. Historical Market Size (US$ Mn) and Volume Trend Analysis By Market Taxonomy, 2016 - 2020 16.4. Market Size (US$ Mn) and Volume Forecast By Market Taxonomy, 2021 – 2031 16.4.1. By Country 16.4.1.1. Brazil 16.4.1.2. Mexico 16.4.1.3. Rest of Latin America 16.4.2. By Product Type 16.4.3. By Operation 16.4.4. By Capacity 16.4.5. By End Use Industry 16.5. Market Attractiveness Analysis 16.5.1. By Product Type 16.5.2. By Operation 16.5.3. By Capacity 16.5.4. By End Use Industry 16.6. Drivers and Restraints - Impact Analysis 17. Europe Market Analysis 2016 - 2020 and Forecast 2021 - 2031 17.1. Introduction 17.2. Pricing Analysis 17.3. Historical Market Size (US$ Mn) and Volume Trend Analysis By Market Taxonomy, 2016 - 2020 17.4. Market Size (US$ Mn) and Volume Forecast By Market Taxonomy, 2021 – 2031 17.4.1. By Country 17.4.1.1. Germany 17.4.1.2. Italy 17.4.1.3. France 17.4.1.4. U.K. 17.4.1.5. Spain 17.4.1.6. BENELUX 17.4.1.7. Russia 17.4.1.8. Rest of Europe 17.4.2. By Product Type 17.4.3. By Operation 17.4.4. By Capacity 17.4.5. By End Use Industry 17.5. Market Attractiveness Analysis 17.5.1. By Country 17.5.2. By Product Type 17.5.3. By Operation 17.5.4. By Capacity 17.5.5. By End Use Industry 17.6. Drivers and Restraints - Impact Analysis 18. South Asia Market Analysis 2016 - 2020 and Forecast 2021 - 2031 18.1. Introduction 18.2. Pricing Analysis 18.3. Historical Market Size (US$ Mn) and Volume Trend Analysis By Market Taxonomy, 2016 - 2020 18.4. Market Size (US$ Mn) and Volume Forecast By Market Taxonomy, 2021 – 2031 18.4.1. By Country 18.4.1.1. India 18.4.1.2. Thailand 18.4.1.3. Indonesia 18.4.1.4. Malaysia 18.4.1.5. Rest of South Asia 18.4.2. By Product Type 18.4.3. By Operation 18.4.4. By Capacity 18.4.5. By End Use Industry 18.5. Market Attractiveness Analysis 18.5.1. By Product Type 18.5.2. By Operation 18.5.3. By Capacity 18.5.4. By End Use Industry 18.6. Drivers and Restraints - Impact Analysis 19. East Asia Market Analysis 2016 - 2020 and Forecast 2021 - 2031 19.1. Introduction 19.2. Pricing Analysis 19.3. Historical Market Size (US$ Mn) and Volume Trend Analysis By Market Taxonomy, 2016 - 2020 19.4. Market Size (US$ Mn) and Volume Forecast By Market Taxonomy, 2021 – 2031 19.4.1. By Country 19.4.1.1. China 19.4.1.2. Japan 19.4.1.3. South Korea 19.4.2. By Product Type 19.4.3. By Operation 19.4.4. By Capacity 19.4.5. By End Use Industry 19.5. Market Attractiveness Analysis 19.5.1. By Product Type 19.5.2. By Operation 19.5.3. By Capacity 19.5.4. By End Use Industry 19.6. Drivers and Restraints - Impact Analysis 20. Oceania Market Analysis 2016 - 2020 and Forecast 2021 - 2031 20.1. Introduction 20.2. Pricing Analysis 20.3. Historical Market Size (US$ Mn) and Volume Trend Analysis By Market Taxonomy, 2016 - 2020 20.4. Market Size (US$ Mn) and Volume Forecast By Market Taxonomy, 2021 – 2031 20.4.1. By Country 20.4.1.1. Australia 20.4.1.2. New Zealand 20.4.2. By Product Type 20.4.3. By Operation 20.4.4. By Capacity 20.4.5. By End Use Industry 20.5. Market Attractiveness Analysis 20.5.1. By Product Type 20.5.2. By Operation 20.5.3. By Capacity 20.5.4. By End Use Industry 20.6. Drivers and Restraints - Impact Analysis 21. Middle East and Africa Market Analysis 2016 - 2020 and Forecast 2021 - 2031 21.1. Introduction 21.2. Pricing Analysis 21.3. Historical Market Size (US$ Mn) and Volume Trend Analysis By Market Taxonomy, 2016 - 2020 21.4. Market Size (US$ Mn) and Volume Forecast By Market Taxonomy, 2021 – 2031 21.4.1. By Country 21.4.1.1. GCC 21.4.1.2. Turkey 21.4.1.3. Northern Africa 21.4.1.4. South Africa 21.4.1.5. Rest of Middle East and Africa 21.4.2. By Product Type 21.4.3. By Operation 21.4.4. By Capacity 21.4.5. By End Use Industry 21.5. Market Attractiveness Analysis 21.5.1. By Country 21.5.2. By Product Type 21.5.3. By Operation 21.5.4. By Capacity 21.5.5. By End Use Industry 21.6. Drivers and Restraints - Impact Analysis 22. Emerging Countries Market Analysis 2016 - 2020 and Forecast 2021 - 2031 22.1. Introduction 22.1.1. Market Value Proportion Analysis, By Key Countries 22.1.2. Global Vs. Country Growth Comparison 22.2. India Market Analysis 22.2.1. Introduction 22.2.2. PEST Analysis 22.2.3. Market Value Proportion Analysis by Market Taxonomy 22.2.4. Market Volume (‘000 Mtrs) and Value (US$ Mn) Analysis and Forecast by Market Taxonomy 22.2.4.1. By Product Type 22.2.4.2. By Operation 22.2.4.3. By Capacity 22.2.4.4. By End Use Industry 22.3. China Market Analysis 22.3.1. Introduction 22.3.2. PEST Analysis 22.3.3. Market Value Proportion Analysis by Market Taxonomy 22.3.4. Market Volume (‘000 Mtrs) and Value (US$ Mn) Analysis and Forecast by Market Taxonomy 22.3.4.1. By Product Type 22.3.4.2. By Operation 22.3.4.3. By Capacity 22.3.4.4. By End Use Industry 22.4. Mexico Market Analysis 22.4.1. Introduction 22.4.2. PEST Analysis 22.4.3. Market Value Proportion Analysis by Market Taxonomy 22.4.4. Market Volume (‘000 Mtrs) and Value (US$ Mn) Analysis and Forecast by Market Taxonomy 22.4.4.1. By Product Type 22.4.4.2. By Operation 22.4.4.3. By Capacity 22.4.4.4. By End Use Industry 23. Market Structure Analysis 23.1. Market Analysis by Tier of Companies () 23.2. Market Share Analysis of Top Players 23.3. Market Presence Analysis 24. Competition Analysis 24.1. Competition Dashboard 24.2. Product Mapping 24.3. Competition Deep Dive 24.3.1. Honeywell International Inc. 24.3.1.1. Overview 24.3.1.2. Product Portfolio 24.3.1.3. Profitability by Market Segments (Product/Channel/Region) 24.3.1.4. Strategy Overview 24.3.1.4.1. Marketing Strategy 24.3.1.4.2. Product Strategy 24.3.1.4.3. Channel Strategy 24.3.2. Siemens AG 24.3.2.1. Overview 24.3.2.2. Product Portfolio 24.3.2.3. Profitability by Market Segments (Product/Channel/Region) 24.3.2.4. Strategy Overview 24.3.2.4.1. Marketing Strategy 24.3.2.4.2. Product Strategy 24.3.2.4.3. Channel Strategy 24.3.3. Interroll Holding AG 24.3.3.1. Overview 24.3.3.2. Product Portfolio 24.3.3.3. Profitability by Market Segments (Product/Channel/Region) 24.3.3.4. Strategy Overview 24.3.3.4.1. Marketing Strategy 24.3.3.4.2. Product Strategy 24.3.3.4.3. Channel Strategy 24.3.4. Kardex AG 24.3.4.1. Overview 24.3.4.2. Product Portfolio 24.3.4.3. Profitability by Market Segments (Product/Channel/Region) 24.3.4.4. Strategy Overview 24.3.4.4.1. Marketing Strategy 24.3.4.4.2. Product Strategy 24.3.4.4.3. Channel Strategy 24.3.5. Metso Corporation 24.3.5.1. Overview 24.3.5.2. Product Portfolio 24.3.5.3. Profitability by Market Segments (Product/Channel/Region) 24.3.5.4. Strategy Overview 24.3.5.4.1. Marketing Strategy 24.3.5.4.2. Product Strategy 24.3.5.4.3. Channel Strategy 24.3.6. Daifuku Co., Ltd. 24.3.6.1. Overview 24.3.6.2. Product Portfolio 24.3.6.3. Profitability by Market Segments (Product/Channel/Region) 24.3.6.4. Strategy Overview 24.3.6.4.1. Marketing Strategy 24.3.6.4.2. Product Strategy 24.3.6.4.3. Channel Strategy 24.3.7. Dorner Mfg. Corp. 24.3.7.1. Overview 24.3.7.2. Product Portfolio 24.3.7.3. Profitability by Market Segments (Product/Channel/Region) 24.3.7.4. Strategy Overview 24.3.7.4.1. Marketing Strategy 24.3.7.4.2. Product Strategy 24.3.7.4.3. Channel Strategy 24.3.8. Dematic Company 24.3.8.1. Overview 24.3.8.2. Product Portfolio 24.3.8.3. Profitability by Market Segments (Product/Channel/Region) 24.3.8.4. Strategy Overview 24.3.8.4.1. Marketing Strategy 24.3.8.4.2. Product Strategy 24.3.8.4.3. Channel Strategy 24.3.9. Eisenmann SE 24.3.9.1. Overview 24.3.9.2. Product Portfolio 24.3.9.3. Profitability by Market Segments (Product/Channel/Region) 24.3.9.4. Strategy Overview 24.3.9.4.1. Marketing Strategy 24.3.9.4.2. Product Strategy 24.3.9.4.3. Channel Strategy 24.3.10. Allied Markets, Inc. 24.3.10.1. Overview 24.3.10.2. Product Portfolio 24.3.10.3. Profitability by Market Segments (Product/Channel/Region) 24.3.10.4. Strategy Overview 24.3.10.4.1. Marketing Strategy 24.3.10.4.2. Product Strategy 24.3.10.4.3. Channel Strategy 24.3.11. Murata Machinery, Ltd. 24.3.11.1. Overview 24.3.11.2. Product Portfolio 24.3.11.3. Profitability by Market Segments (Product/Channel/Region) 24.3.11.4. Strategy Overview 24.3.11.4.1. Marketing Strategy 24.3.11.4.2. Product Strategy 24.3.11.4.3. Channel Strategy 24.3.12. Schaefer Systems International, Inc. 24.3.12.1. Overview 24.3.12.2. Product Portfolio 24.3.12.3. Profitability by Market Segments (Product/Channel/Region) 24.3.12.4. Strategy Overview 24.3.12.4.1. Marketing Strategy 24.3.12.4.2. Product Strategy 24.3.12.4.3. Channel Strategy 24.3.13. BEUMER Group 24.3.13.1. Overview 24.3.13.2. Product Portfolio 24.3.13.3. Profitability by Market Segments (Product/Channel/Region) 24.3.13.4. Strategy Overview 24.3.13.4.1. Marketing Strategy 24.3.13.4.2. Product Strategy 24.3.13.4.3. Channel Strategy 24.3.14. TGW Systems Inc. 24.3.14.1. Overview 24.3.14.2. Product Portfolio 24.3.14.3. Profitability by Market Segments (Product/Channel/Region) 24.3.14.4. Strategy Overview 24.3.14.4.1. Marketing Strategy 24.3.14.4.2. Product Strategy 24.3.14.4.3. Channel Strategy 24.3.15. Fives Group 24.3.15.1. Overview 24.3.15.2. Product Portfolio 24.3.15.3. Profitability by Market Segments (Product/Channel/Region) 24.3.15.4. Strategy Overview 24.3.15.4.1. Marketing Strategy 24.3.15.4.2. Product Strategy 24.3.15.4.3. Channel Strategy 24.3.16. Dürr Group 24.3.16.1. Overview 24.3.16.2. Product Portfolio 24.3.16.3. Profitability by Market Segments (Product/Channel/Region) 24.3.16.4. Strategy Overview 24.3.16.4.1. Marketing Strategy 24.3.16.4.2. Product Strategy 24.3.16.4.3. Channel Strategy 25. Assumptions and Acronyms Used 26. Research Methodology
Let us know your requirement to get
100% FREE customization
List of Tables
Table 01: Global Market Volume ('000 Mtrs) Forecast by Product Type, 2021 - 2031 Table 02: Global Market Size (US$ Mn) Forecast by Product Type, 2021 - 2031 Table 03: Global Market Size (US$ Mn) and Volume ('000 Mtrs) Forecast by Operation Type, 2021 - 2031 Table 04: Global Market Size (US$ Mn) and Volume ('000 Mtrs) Forecast by Capacity Type, 2021 - 2031 Table 05: Global Market Size (US$ Mn) and Volume ('000 Mtrs) Forecast by End Use, 2021 - 2031 Table 06: Global Market Size (US$ Mn) and Volume ('000 Mtrs) Forecast by Region, 2021 - 2031 Table 07: North America Market Size (US$ Mn) and Volume ('000 Mtrs) Forecast by Country, 2021 - 2031 Table 08: North America Market Volume ('000 Mtrs) Forecast by Product Type, 2021 - 2031 Table 09: North America Market Size (US$ Mn) Forecast by Product Type, 2021 - 2031 Table 10: North America Market Size (US$ Mn) and Volume ('000 Mtrs) Forecast by Operation Type, 2021 - 2031 Table 11: North America Market Size (US$ Mn) and Volume ('000 Mtrs) Forecast by Capacity Type, 2021 - 2031 Table 12: North America Market Size (US$ Mn) and Volume ('000 Mtrs) Forecast by End Use, 2021 - 2031 Table 13: Latin America Market Size (US$ Mn) and Volume ('000 Mtrs) Forecast by Country, 2021 - 2031 Table 14: Latin America Market Volume ('000 Mtrs) Forecast by Product Type, 2021 - 2031 Table 15: Latin America Market Size (US$ Mn) Forecast by Product Type, 2021 - 2031 Table 16: Latin America Market Size (US$ Mn) and Volume ('000 Mtrs) Forecast by Operation Type, 2021 - 2031 Table 17: Latin America Market Size (US$ Mn) and Volume ('000 Mtrs) Forecast by Capacity Type, 2021 - 2031 Table 18: Latin America Market Size (US$ Mn) and Volume ('000 Mtrs) Forecast by End Use, 2021 - 2031 Table 19: Europe Market Size (US$ Mn) and Volume ('000 Mtrs) Forecast by Country, 2021 - 2031 Table 20: Europe Market Volume ('000 Mtrs) Forecast by Product Type, 2021 - 2031 Table 21: Europe Market Size (US$ Mn) Forecast by Product Type, 2021 - 2031 Table 22: Europe Market Size (US$ Mn) and Volume ('000 Mtrs) Forecast by Operation Type, 2021 - 2031 Table 23: Europe Market Size (US$ Mn) and Volume ('000 Mtrs) Forecast by Capacity Type, 2021 - 2031 Table 24: Europe Market Size (US$ Mn) and Volume ('000 Mtrs) Forecast by End Use, 2021 - 2031 Table 25: South Asia Market Size (US$ Mn) and Volume ('000 Mtrs) Forecast by Country, 2021 - 2031 Table 26: South Asia Market Volume ('000 Mtrs) Forecast by Product Type, 2021 - 2031 Table 27: South Asia Market Size (US$ Mn) Forecast by Product Type, 2021 - 2031 Table 28: South Asia Market Size (US$ Mn) and Volume ('000 Mtrs) Forecast by Operation Type, 2021 - 2031 Table 29: South Asia Market Size (US$ Mn) and Volume ('000 Mtrs) Forecast by Capacity Type, 2021 - 2031 Table 30: South Asia Market Size (US$ Mn) and Volume ('000 Mtrs) Forecast by End Use, 2021 - 2031 Table 31: East Asia Market Size (US$ Mn) and Volume ('000 Mtrs) Forecast by Country, 2021 - 2031 Table 32: East Asia Market Volume ('000 Mtrs) Forecast by Product Type, 2021 - 2031 Table 33: East Asia Market Size (US$ Mn) Forecast by Product Type, 2021 - 2031 Table 34: East Asia Market Size (US$ Mn) and Volume ('000 Mtrs) Forecast by Operation Type, 2021 - 2031 Table 35: East Asia Market Size (US$ Mn) and Volume ('000 Mtrs) Forecast by Capacity Type, 2021 - 2031 Table 36: East Asia Market Size (US$ Mn) and Volume ('000 Mtrs) Forecast by End Use, 2021 - 2031 Table 37: Oceania Market Size (US$ Mn) and Volume ('000 Mtrs) Forecast by Country, 2021 - 2031 Table 38: Oceania Market Volume ('000 Mtrs) Forecast by Product Type, 2021 - 2031 Table 39: Oceania Market Size (US$ Mn) Forecast by Product Type, 2021 - 2031 Table 40: Oceania Market Size (US$ Mn) and Volume ('000 Mtrs) Forecast by Operation Type, 2021 - 2031 Table 41: Oceania Market Size (US$ Mn) and Volume ('000 Mtrs) Forecast by Capacity Type, 2021 - 2031 Table 42: Oceania Market Size (US$ Mn) and Volume ('000 Mtrs) Forecast by End Use, 2021 - 2031 Table 43: MEA Market Size (US$ Mn) and Volume ('000 Mtrs) Forecast by Country, 2021 - 2031 Table 44: MEA Market Volume ('000 Mtrs) Forecast by Product Type, 2021 - 2031 Table 45: MEA Market Size (US$ Mn) Forecast by Product Type, 2021 - 2031 Table 46: MEA Market Size (US$ Mn) and Volume ('000 Mtrs) Forecast by Operation Type, 2021 - 2031 Table 47: MEA Market Size (US$ Mn) and Volume ('000 Mtrs) Forecast by Capacity Type, 2021 - 2031 Table 48: MEA Market Size (US$ Mn) and Volume ('000 Mtrs) Forecast by End Use, 2021 - 2031 Table 49: India Market Volume ('000 Mtrs) Forecast by Product Type, 2021 - 2031 Table 50: India Market Size (US$ Mn) Forecast by Product Type, 2021 - 2031 Table 51: India Market Size (US$ Mn) and Volume ('000 Mtrs) Forecast by Operation Type, 2021 - 2031 Table 52: India Market Size (US$ Mn) and Volume ('000 Mtrs) Forecast by Capacity Type, 2021 - 2031 Table 53: India Market Size (US$ Mn) and Volume ('000 Mtrs) Forecast by End Use, 2021 - 2031 Table 54: China Market Volume ('000 Mtrs) Forecast by Product Type, 2021 - 2031 Table 55: China Market Size (US$ Mn) Forecast by Product Type, 2021 - 2031 Table 56: China Market Size (US$ Mn) and Volume ('000 Mtrs) Forecast by Operation Type, 2021 - 2031 Table 57: China Market Size (US$ Mn) and Volume ('000 Mtrs) Forecast by Capacity Type, 2021 - 2031 Table 58: China Market Size (US$ Mn) and Volume ('000 Mtrs) Forecast by End Use, 2021 - 2031 Table 59: Mexico Market Volume ('000 Mtrs) Forecast by Product Type, 2021 - 2031 Table 60: Mexico Market Size (US$ Mn) Forecast by Product Type, 2021 - 2031 Table 61: Mexico Market Size (US$ Mn) and Volume ('000 Mtrs) Forecast by Operation Type, 2021 - 2031 Table 62: Mexico Market Size (US$ Mn) and Volume ('000 Mtrs) Forecast by Capacity Type, 2021 - 2031 Table 63: Mexico Market Size (US$ Mn) and Volume ('000 Mtrs) Forecast by End Use, 2021 - 2031
Find your sweet spots for generating winning opportunities in this market.
Talk to AnalystList of Charts
Figure 01: Global Market Historical Volume ('000 Mtrs) 2016 - 2020 Figure 02: Global Market Volume ('000 Mtrs) Forecast, 2016 – 2020 Figure 03: Global Market Value (US$ Mn) Forecast, 2021 - 2031 Figure 04: Global Market Absolute US$ Opportunity, 2021 - 2031 Figure 05: Global Market Share and BPS Analysis by Product Type, 2021 & 2031 Figure 06: Global Market Y-o-Y Growth by Product Type, 2021 - 2031 Figure 07: Global Market Attractiveness Analysis by Product Type, 2021 - 2031 Figure 08: Global Market Incremental $ Opportunity by Belt Conveyor Segment, 2021 - 2031 Figure 09: Global Market Absolute $ Opportunity by Roller Conveyor Segment, 2021 - 2031 Figure 10: Global Market Incremental $ Opportunity by Pallet Conveyor Segment, 2021 - 2031 Figure 11: Global Market Absolute $ Opportunity by Overhead Conveyor Segment, 2021 - 2031 Figure 12: Global Market Incremental $ Opportunity by Tri-Planar Conveyor Segment, 2021 - 2031 Figure 13: Global Market Absolute $ Opportunity by Crescent Conveyor Segment, 2021 - 2031 Figure 14: Global Market Incremental $ Opportunity by Skid Conveyor Segment, 2021 - 2031 Figure 15: Global Market Absolute $ Opportunity by Trailer Conveyor Segment, 2021 - 2031 Figure 16: Global Market Incremental $ Opportunity by Other Conveyor Segment, 2021 - 2031 Figure 17: Global Market Share and BPS Analysis by Operation Type, 2021 & 2031 Figure 18: Global Market Y-o-Y Growth by Operation Type, 2021 - 2031 Figure 19: Global Market Attractiveness Analysis by Operation Type, 2021 - 2031 Figure 20: Global Market Incremental $ Opportunity by Manual Segment, 2021 - 2031 Figure 21: Global Market Absolute $ Opportunity by Semi-Automatic Segment, 2021 - 2031 Figure 22: Global Market Incremental $ Opportunity by Automatic Segment, 2021 - 2031 Figure 23: Global Market Share and BPS Analysis by Capacity Type, 2021 & 2031 Figure 24: Global Market Y-o-Y Growth by Capacity Type, 2021 - 2031 Figure 25: Global Market Attractiveness Analysis by Capacity Type, 2021 - 2031 Figure 26: Global Market Incremental $ Opportunity by Unit Handling Segment, 2021 - 2031 Figure 27: Global Market Absolute $ Opportunity by Bulk Handling Segment, 2021 - 2031 Figure 28: Global Market Share and BPS Analysis by End Use, 2021 & 2031 Figure 29: Global Market Y-o-Y Growth by End Use, 2021 - 2031 Figure 30: Global Market Attractiveness Analysis by End Use, 2021 - 2031 Figure 31: Global Market Incremental $ Opportunity by Packaging & Warehouse Distribution, 2021 - 2031 Figure 32: Global Market Incremental $ Opportunity by Textile & Papers, 2021 - 2031 Figure 33: Global Market Incremental $ Opportunity by Construction & Mining, 2021 - 2031 Figure 34: Global Market Incremental $ Opportunity by Automotive & Transportation, 2021 - 2031 Figure 35: Global Market Incremental $ Opportunity by Consumer Electronics, 2021 - 2031 Figure 36: Global Market Incremental $ Opportunity by F&B, 2021 - 2031 Figure 37: Global Market Incremental $ Opportunity by Chemical & Pharmaceutical, 2021 - 2031 Figure 38: Global Market Share and BPS Analysis by Region, 2021 & 2031 Figure 39: Global Market Y-o-Y Growth by Region, 2021 - 2031 Figure 40: Global Market Attractiveness Analysis by Region, 2021 - 2031 Figure 41: North America Market Incremental $ Opportunity, 2021 - 2031 Figure 42: Latin America Market Absolute $ Opportunity, 2021 - 2031 Figure 43: Europe Market Incremental $ Opportunity, 2021 - 2031 Figure 44: South Asia Market Absolute $ Opportunity, 2021 - 2031 Figure 45: East Asia Market Incremental $ Opportunity, 2021 - 2031 Figure 46: Oceania Market Absolute $ Opportunity, 2021 - 2031 Figure 47: MEA Market Incremental $ Opportunity, 2021 - 2031 Figure 48: North America Market Share and BPS Analysis by Country, 2021 & 2031 Figure 49: North America Market Y-o-Y Growth by Country, 2021 - 2031 Figure 50: North America Market Attractiveness Analysis by Country, 2021 - 2031 Figure 51: US Market Incremental $ Opportunity, 2021 - 2031 Figure 52: Canada Market Absolute $ Opportunity, 2021 - 2031 Figure 53: North America Market Share and BPS Analysis by Product Type, 2021 & 2031 Figure 54: North America Market Y-o-Y Growth by Product Type, 2021 - 2031 Figure 55: North America Market Attractiveness Analysis by Product Type, 2021 - 2031 Figure 56: North America Market Share and BPS Analysis by Operation Type, 2021 & 2031 Figure 57: North America Market Y-o-Y Growth by Operation Type, 2021 - 2031 Figure 58: North America Market Attractiveness Analysis by Operation Type, 2021 - 2031 Figure 59: North America Market Share and BPS Analysis by Capacity Type, 2021 & 2031 Figure 60: North America Market Y-o-Y Growth by Capacity Type, 2021 - 2031 Figure 61: North America Market Attractiveness Analysis by Capacity Type, 2021 - 2031 Figure 62: North America Market Share and BPS Analysis by End Use, 2021 & 2031 Figure 63: North America Market Y-o-Y Growth by End Use, 2021 - 2031 Figure 64: North America Market Attractiveness Analysis by End Use, 2021 - 2031 Figure 65: Latin America Market Share and BPS Analysis by Country, 2021 & 2031 Figure 66: Latin America Market Y-o-Y Growth by Country, 2021 - 2031 Figure 67: Latin America Market Attractiveness Analysis by Country, 2021 - 2031 Figure 68: Brazil Market Incremental $ Opportunity, 2021 - 2031 Figure 69: Mexico Market Absolute $ Opportunity, 2021 - 2031 Figure 70: Rest of LA Market Incremental $ Opportunity, 2021 - 2031 Figure 71: Latin America Market Share and BPS Analysis by Product Type, 2021 & 2031 Figure 72: Latin America Market Y-o-Y Growth by Product Type, 2021 - 2031 Figure 73: Latin America Market Attractiveness Analysis by Product Type, 2021 - 2031 Figure 74: Latin America Market Share and BPS Analysis by Operation Type, 2021 & 2031 Figure 75: Latin America Market Y-o-Y Growth by Operation Type, 2021 - 2031 Figure 76: Latin America Market Attractiveness Analysis by Operation Type, 2021 - 2031 Figure 77: Latin America Market Share and BPS Analysis by Capacity Type, 2021 & 2031 Figure 78: Latin America Market Y-o-Y Growth by Capacity Type, 2021 - 2031 Figure 79: Latin America Market Attractiveness Analysis by Capacity Type, 2021 - 2031 Figure 80: Latin America Market Share and BPS Analysis by End Use, 2021 & 2031 Figure 81: Latin America Market Y-o-Y Growth by End Use, 2021 - 2031 Figure 82: Latin America Market Attractiveness Analysis by End Use, 2021 - 2031 Figure 83: Europe Market Share and BPS Analysis by Country, 2021 & 2031 Figure 84: Europe Market Y-o-Y Growth by Country, 2021 - 2031 Figure 85: Europe Market Attractiveness Analysis by Country, 2021 - 2031 Figure 86: Germany Market Incremental $ Opportunity, 2021 - 2031 Figure 87: Italy Market Absolute $ Opportunity, 2021 - 2031 Figure 88: France Market Incremental $ Opportunity, 2021 - 2031 Figure 89: U.K. Market Absolute $ Opportunity, 2021 - 2031 Figure 90: Spain Market Incremental $ Opportunity, 2021 - 2031 Figure 91: BENELUX Market Absolute $ Opportunity, 2021 - 2031 Figure 92: Russia Market Incremental $ Opportunity, 2021 - 2031 Figure 93: Rest of Europe Market Absolute $ Opportunity, 2021 - 2031 Figure 94: Europe Market Share and BPS Analysis by Product Type, 2021 & 2031 Figure 95: Europe Market Y-o-Y Growth by Product Type, 2021 - 2031 Figure 96: Europe Market Attractiveness Analysis by Product Type, 2021 - 2031 Figure 97: Europe Market Share and BPS Analysis by Operation Type, 2021 & 2031 Figure 98: Europe Market Y-o-Y Growth by Operation Type, 2021 - 2031 Figure 99: Europe Market Attractiveness Analysis by Operation Type, 2021 - 2031 Figure 100: Europe Market Share and BPS Analysis by Capacity Type, 2021 & 2031 Figure 101: Europe Market Y-o-Y Growth by Capacity Type, 2021 - 2031 Figure 102: Europe Market Attractiveness Analysis by Capacity Type, 2021 - 2031 Figure 103: Europe Market Share and BPS Analysis by End Use, 2021 & 2031 Figure 104: Europe Market Y-o-Y Growth by End Use, 2021 - 2031 Figure 105: Europe Market Attractiveness Analysis by End Use, 2021 - 2031 Figure 106: South Asia Market Share and BPS Analysis by Country, 2021 & 2031 Figure 107: South Asia Market Y-o-Y Growth by Country, 2021 - 2031 Figure 108: South Asia Market Attractiveness Analysis by Country, 2021 - 2031 Figure 109: India Market Incremental $ Opportunity, 2021 - 2031 Figure 110: Thailand Market Absolute $ Opportunity, 2021 - 2031 Figure 111: Indonesia Market Incremental $ Opportunity, 2021 - 2031 Figure 112: Malaysia Market Absolute $ Opportunity, 2021 - 2031 Figure 113: Rest of SA Market Incremental $ Opportunity, 2021 - 2031 Figure 114: South Asia Market Share and BPS Analysis by Product Type, 2021 & 2031 Figure 115: South Asia Market Y-o-Y Growth by Product Type, 2021 - 2031 Figure 116: South Asia Market Attractiveness Analysis by Product Type, 2021 - 2031 Figure 117: South Asia Market Share and BPS Analysis by Operation Type, 2021 & 2031 Figure 118: South Asia Market Y-o-Y Growth by Operation Type, 2021 - 2031 Figure 119: South Asia Market Attractiveness Analysis by Operation Type, 2021 - 2031 Figure 120: South Asia Market Share and BPS Analysis by Capacity Type, 2021 & 2031 Figure 121: South Asia Market Y-o-Y Growth by Capacity Type, 2021 - 2031 Figure 122: South Asia Market Attractiveness Analysis by Capacity Type, 2021 - 2031 Figure 123: South Asia Market Share and BPS Analysis by End Use, 2021 & 2031 Figure 124: South Asia Market Y-o-Y Growth by End Use, 2021 - 2031 Figure 125: South Asia Market Attractiveness Analysis by End Use, 2021 - 2031 Figure 126: East Asia Market Share and BPS Analysis by Country, 2021 & 2031 Figure 127: East Asia Market Y-o-Y Growth by Country, 2021 - 2031 Figure 128: East Asia Market Attractiveness Analysis by Country, 2021 - 2031 Figure 129: China Market Incremental $ Opportunity, 2021 - 2031 Figure 130: Japan Market Absolute $ Opportunity, 2021 - 2031 Figure 131: South Korea Market Incremental $ Opportunity, 2021 - 2031 Figure 132: East Asia Market Share and BPS Analysis by Product Type, 2021 & 2031 Figure 133: East Asia Market Y-o-Y Growth by Product Type, 2021 - 2031 Figure 134: East Asia Market Attractiveness Analysis by Product Type, 2021 - 2031 Figure 135: East Asia Market Share and BPS Analysis by Operation Type, 2021 & 2031 Figure 136: East Asia Market Y-o-Y Growth by Operation Type, 2021 - 2031 Figure 137: East Asia Market Attractiveness Analysis by Operation Type, 2021 - 2031 Figure 138: East Asia Market Share and BPS Analysis by Capacity Type, 2021 & 2031 Figure 139: East Asia Market Y-o-Y Growth by Capacity Type, 2021 - 2031 Figure 140: East Asia Market Attractiveness Analysis by Capacity Type, 2021 - 2031 Figure 141: East Asia Market Share and BPS Analysis by End Use, 2021 & 2031 Figure 142: East Asia Market Y-o-Y Growth by End Use, 2021 - 2031 Figure 143: East Asia Market Attractiveness Analysis by End Use, 2021 - 2031 Figure 144: Oceania Market Share and BPS Analysis by Country, 2021 & 2031 Figure 145: Oceania Market Y-o-Y Growth by Country, 2021 - 2031 Figure 146: Oceania Market Attractiveness Analysis by Country, 2021 - 2031 Figure 147: Australia Market Incremental $ Opportunity, 2021 - 2031 Figure 148: New Zealand Market Absolute $ Opportunity, 2021 - 2031 Figure 149: Oceania Market Share and BPS Analysis by Product Type, 2021 & 2031 Figure 150: Oceania Market Y-o-Y Growth by Product Type, 2021 - 2031 Figure 151: Oceania Market Attractiveness Analysis by Product Type, 2021 - 2031 Figure 152: Oceania Market Share and BPS Analysis by Operation Type, 2021 & 2031 Figure 153: Oceania Market Y-o-Y Growth by Operation Type, 2021 - 2031 Figure 154: Oceania Market Attractiveness Analysis by Operation Type, 2021 - 2031 Figure 155: Oceania Market Share and BPS Analysis by Capacity Type, 2021 & 2031 Figure 156: Oceania Market Y-o-Y Growth by Capacity Type, 2021 - 2031 Figure 157: Oceania Market Attractiveness Analysis by Capacity Type, 2021 - 2031 Figure 158: Oceania Market Share and BPS Analysis by End Use, 2021 & 2031 Figure 159: Oceania Market Y-o-Y Growth by End Use, 2021 - 2031 Figure 160: Oceania Market Attractiveness Analysis by End Use, 2021 - 2031 Figure 161: MEA Market Share and BPS Analysis by Country, 2021 & 2031 Figure 162: MEA Market Y-o-Y Growth by Country, 2021 - 2031 Figure 163: MEA Market Attractiveness Analysis by Country, 2021 - 2031 Figure 164: GCC Market Incremental $ Opportunity, 2021 - 2031 Figure 165: Turkey Market Absolute $ Opportunity, 2021 - 2031 Figure 166: Northern Africa Market Incremental $ Opportunity, 2021 - 2031 Figure 167: South Africa Market Absolute $ Opportunity, 2021 - 2031 Figure 168: Rest of MEA Market Absolute $ Opportunity, 2021 - 2031 Figure 169: MEA Market Share and BPS Analysis by Product Type, 2021 & 2031 Figure 170: MEA Market Y-o-Y Growth by Product Type, 2021 - 2031 Figure 171: MEA Market Attractiveness Analysis by Product Type, 2021 - 2031 Figure 172: MEA Market Share and BPS Analysis by Operation Type, 2021 & 2031 Figure 173: MEA Market Y-o-Y Growth by Operation Type, 2021 - 2031 Figure 174: MEA Market Attractiveness Analysis by Operation Type, 2021 - 2031 Figure 175: MEA Market Share and BPS Analysis by Capacity Type, 2021 & 2031 Figure 176: MEA Market Y-o-Y Growth by Capacity Type, 2021 - 2031 Figure 177: MEA Market Attractiveness Analysis by Capacity Type, 2021 - 2031 Figure 178: MEA Market Share and BPS Analysis by End Use, 2021 & 2031 Figure 179: MEA Market Y-o-Y Growth by End Use, 2021 - 2031 Figure 180: MEA Market Attractiveness Analysis by End Use, 2021 - 2031 Figure 181: Emerging Markets Market Share by Country, 2021E Figure 182: Global Market Share by Region, 2021E Figure 183: Global & Emerging Countries Market Y-o-Y Growth Projections, 2021 - 2031 Figure 184: Global & Emerging Countries Market Share and BPS Analysis – 2021 & 2031
Need specific information?
Request CustomizationExplore Industrial Automation Insights
View Reports