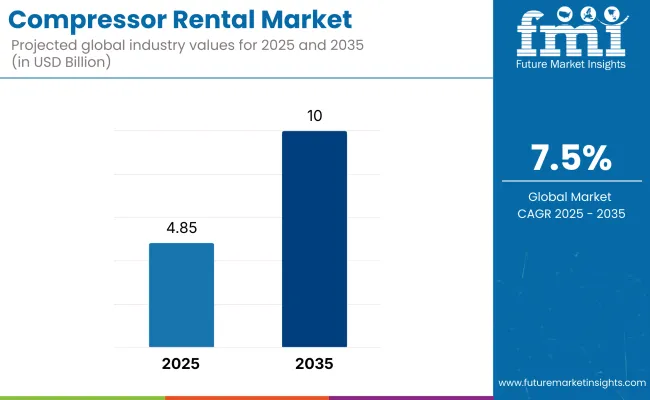
The global compressor rental market is expected to expand from USD 4.85 billion in 2025 to USD 10 billion by 2035, registering a CAGR of 7.5% over the forecast period. This growth is being driven by the rising demand for flexible, low-CAPEX industrial solutions across construction, mining, oil & gas, power, and manufacturing sectors.
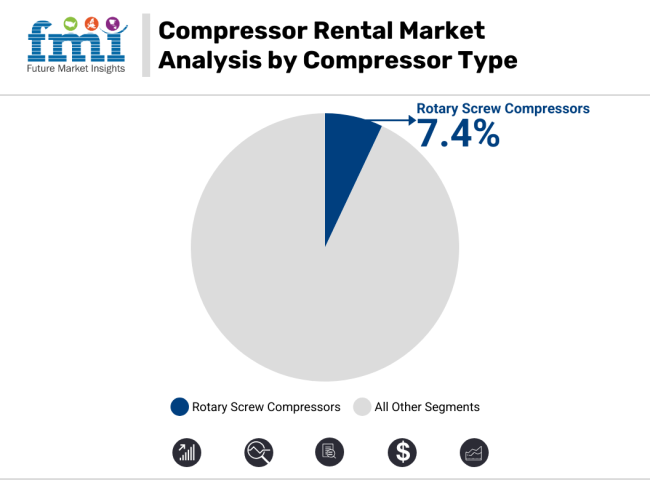
North America, China, and India are leading markets, underpinned by infrastructure expansion and increasing industrialization. Rotary screw compressors are gaining prominence due to their energy efficiency, durability, and suitability for continuous high-load operations.
Key growth factors include the rising cost of equipment ownership, growing preference for short-term and project-specific rentals, and the shift toward sustainable compressor systems. Construction and infrastructure projects worldwide increasingly rely on rental models to manage tight budgets and dynamic timelines.
Similarly, the oil & gas industry uses compressor rentals to meet seasonal or temporary capacity requirements, especially during maintenance and exploration activities. Moreover, power and chemical industries are leveraging rentals to reduce downtime and maintain operational continuity.
Technological advancements such as IoT integration, real-time monitoring, and predictive maintenance are transforming rental service delivery. Rental firms are increasingly adopting hybrid and electric compressor fleets in response to regulatory pressure for low-emission equipment, particularly in Europe and the USA The shift toward sustainability and digitization is also evident in emerging economies, albeit at a slower pace due to cost sensitivity.
Looking ahead, the market will be shaped by a dual mandate-improving operational efficiency while complying with environmental mandates. As companies seek agility without compromising performance, compressor rentals are emerging as a strategic lever. Stakeholders are expected to invest heavily in AI-based fleet optimization, modular leasing models, and digital customer platforms, aligning with the evolving demands of a decentralized, efficiency-driven industrial ecosystem.
Rotary screw compressors will lead the market from 2025 to 2035 due to their superior energy efficiency, continuous operation, and low maintenance demands. Their ability to provide consistent compressed air output makes them ideal for construction, manufacturing, and mining applications, where uptime and durability are critical.
The rise in demand for high-performance, oil-free compressors is further accelerating their adoption in chemical processing and power generation industries. In contrast, reciprocating compressors are expected to grow at a slower pace, confined largely to intermittent, low-duty cycle applications due to higher maintenance needs and lower energy efficiency.
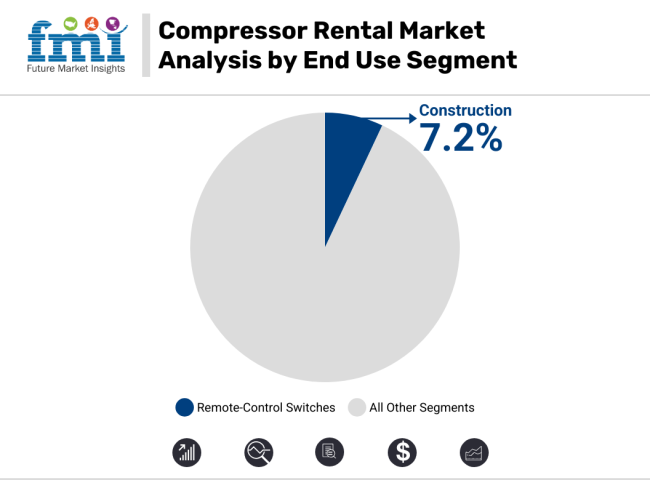
The construction industry will remain the largest end-use segment in the compressor rental market through 2035, driven by sustained infrastructure development, especially in emerging economies. Public and private investments in urban expansion, smart cities, highways, and railways are creating consistent demand for mobile, high-capacity compressors.
In addition to construction, the oil & gas and mining sectors will also be key drivers, using rentals to address fluctuating site demands and minimize capital investment. Meanwhile, manufacturing industries are increasingly renting compressors to meet automation needs and scale flexibly with changing production volumes.
The compressor rental industry is booming with high growth, driven by booming infrastructure projects, changing energy regulations, and a strategic turning toward cost-effective, on-demand equipment offerings. With industries focusing on agility and capital flexibility, rental companies are set to take the benefits, whereas conventional equipment players banking on outright purchases might fail to keep up. This shift marks a resolute trend towards scalable, high-performance solutions that complement contemporary industrial requirements.
Redefine Value Proposition with Service-Driven Rentals
Move beyond standard equipment leasing by incorporating added-value services like performance data analytics in real time, remote diagnostics, and predictive maintenance. Providing end-to-end service packages will distinguish rental companies and create long-term customer relationships.
Take Advantage of Green Transition and Regulatory Changes
Align with increasing emission controls and sustainability objectives through growth of environmentally friendly compressor fleets, such as hybrids and electrics. Firms that make advance investment in cleaner technology will win contracts with eco-friendly industries and have a regulatory edge.
Accelerate Industry Consolidation for Competitive Supremacy
Use mergers, acquisitions, and joint ventures to gain a foothold in strategic growth areas. Enhancing supply chain resilience and maximizing fleet utilization through strategic alliances will provide sustained profitability and scalability.
| Risk | Probability & Impact |
|---|---|
| Growing Competitive Pressure - New rental suppliers and direct manufacturer leasing programs can steal industry share from established players. | High Probability, High Impact |
| Fluctuating Industrial Demand - Downturns in the economy, halted infrastructure expansion, or decreased investments in oil & gas can cause insecure periods of rental demand. | Medium Probability, High Impact |
| Shifting Client Preferences - Increased demand for on-demand, digitalized rental arrangements can disrupt classical long-term leasing contracts, and this requires business model change with speed. | High Probability, Medium Impact |
| Priority | Immediate Action |
|---|---|
| Optimize Rental Models for High-Variability Demand | Introduce dynamic pricing and short-term leasing solutions specific to industries with changing equipment requirements. |
| Leverage AI for Proactive Fleet Management | Use predictive analytics to reduce downtime, improve equipment effectiveness, and increase asset longevity. |
| Expand Footprint in Emerging Clean Energy & Industrial Cooling Sectors | Create specialized rental solutions for hydrogen production, carbon capture, and large-scale cooling. |
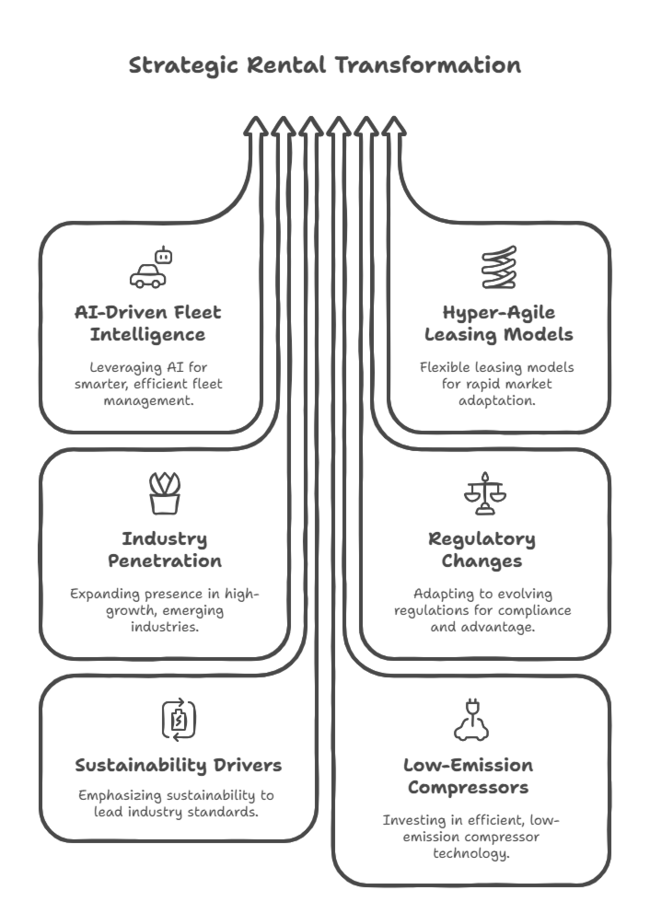
To stay ahead, companies must redefine their rental strategies with precision, agility, and technological foresight. Advancing further requires a bold shift to AI-driven fleet intelligence, hyper-agile leasing models, and profound industry penetration in high-growth sectors such as renewable energy and industrial cooling.
Regulatory change and sustainability drivers will be the differentiators between innovators and laggards, and investments in low-emission, high-efficiency compressors will be non-negotiable. Industry leaders need to act swiftly to future-proof their businesses, outcompete competition, and design a rental ecosystem that excels on agility and value-driven differentiation.
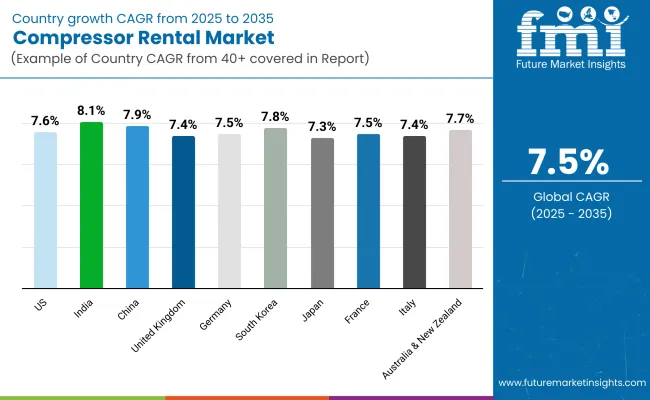
The United States will remain a leading contributor to the compressor rental industry due to massive infrastructure growth and development of the energy sector. Increased oil & gas activities, in addition to growing emphasis on the integration of renewable energy, will continue to provide high rental demand.
Manufacturing and construction companies will favor rental compressors more and more to ensure maximum operating cost optimization and increase project flexibility. Investment in data centers and semiconductor manufacturing will also build new growth paths. FMI forecasts that the CAGR of the United States compressor rental industry will be 7.6% from 2025 to 2035.
India's rental compressor industry will see strong growth, driven by fast-paced urbanization, infrastructural development programs initiated by the government, and high industrialization growth trends. Mega construction programs such as metro rail expansion and smart city constructions will propel the demand for transportable and efficiency compressors.
The growing take-up of renting solutions in mining activities, with rising coal and mineral excavation activities, will support industry growth as well. The use of IoT-enabled compressors will improve fleet management and operational efficiency. FMI projects that the CAGR of the Indian compressor rental industry will be 8.1% from 2025 to 2035.
China's compressor rental industry will continue to grow steadily, led by its huge industrial and infrastructure growth. The government's drive for high-technology manufacturing as well as large-scale energy projects will sustain the demand. Shifting towards cleaner forms of energy solutions, such as hydrogen and wind energy, will further spur rental compressor usage, especially for temporary power solutions.
As China consolidates its role as a world manufacturing center, sectors like electronics, automotive, and aerospace will increasingly rely on rental compressors for cost-effectiveness and operational convenience. The construction industry, supported by continued urban redevelopment efforts, will also be a major demand driver. FMI opines that the CAGR of China’s compressor rental industry will be 7.9% from 2025 to 2035.
United Kingdom's compressor rental industry will grow steadily, led by rising investments in infrastructure and a growing movement towards rental-driven models. Demand for energy-saving air compressors will increase, driven by pressure for green building projects and green construction methods. The UK's robust offshore wind and renewable power sector will be another driving factor, demanding efficient compressors to install and service equipment.
Increased use of modular construction methods and prefabrication will also drive rental demand as businesses opt for equipment sourcing flexibility. The emphasis on decarbonization and industrial electrification will drive the uptake of low-emission compressor technologies. FMI forecasts that the CAGR of the UK compressor rental industry will be 7.4% from 2025 to 2035.
Germany's compressor rental industry will gain from the nation's dominance in industrial automation, engineering prowess, and green initiatives. The automotive industry's transition to electric vehicle manufacturing will further raise dependence on rental solutions to deal with changing assembly line requirements. Furthermore, the growth of wind and solar power infrastructure will propel compressor consumption in maintenance and energy storage uses.
The presence of major industrial equipment companies will also promote technology innovation in rental products, enhancing efficiency and decreasing operating expenses. FMI projects that the CAGR of Germany’s compressor rental industry will be 7.5% from 2025 to 2035.
South Korea's compressor rental industry will pick up pace with improvements in semiconductor production, shipbuilding, and heavy industry sectors. The nation's emphasis on innovation and high-tech industries will propel the demand for precision-driven compressed air solutions. The increasing use of AI-integrated compressors in smart factories will further boost rental industry potential.
The boom in offshore construction and marine projects will also generate consistent demand for temporary compressed air solutions. As South Korea improves its industrial competitiveness, rental solutions will emerge as a strategic option for companies that require cost-effective scalability. FMI opines that the CAGR of South Korea’s compressor rental industry will be 7.8% from 2025 to 2035.
Japan's rental compressor industry will increase steadily, supported by the nation's advanced manufacturing ecosystem and focus on energy efficiency. The increasing application of automated production lines in electronics and robotics sectors will drive demand for high-precision, oil-free rental compressors. In addition, Japan's infrastructure resilience efforts, including earthquake-resistant structures and extended high-speed rail networks, will drive rental industry growth.
The technological push of the aerospace sector will continue to spur rental demand. As rental models evolve, companies will increasingly seek customized compressor solutions to meet special operating requirements. FMI projects that Japan's compressor rental industry CAGR from 2025 to 2035 will be 7.3%.
France's compressor rental industry will be influenced by its strong infrastructure modernization programs and strict environmental regulations. Increased investments in green hydrogen production and carbon capture technologies will generate substantial demand for high-end rental compressors. Growth in aerospace and automotive production will also fuel demand for temporary compressed air solutions, especially in prototyping and test facilities.
The focus of the French government on green urbanization will promote the use of energy-saving rental machinery in construction projects. Moreover, the active refining of oil and chemical processing sector of the country will generate constant rental demand. FMI projects that the CAGR of France’s compressor rental industry will be 7.5% from 2025 to 2035.
Italy's rental industry for compressors will grow as industrial end-use sectors take greater advantage of adaptable, price-effective equipment options. The renewal of manufacturing production, especially auto and machinery assembly, will spearhead rental requirements. Italy's emphasis on highway and rail route development, or the rehabilitation of its infrastructure, will also serve compressor uptake on heavy construction works.
The shift of the energy sector to renewables and cleaner fuels will lead to new prospects for rental providers of high-efficiency, oil-free air compressors. Additionally, Italy's dominance in the food and beverage sector will ensure rental demand for clean and contaminant-free compressed air solutions continues. FMI opines that the CAGR of Italy’s compressor rental industry will be 7.4% from 2025 to 2035.
Australia and New Zealand's rental compressor sector will see growth, fueled by massive mining activities, growing renewable energy projects, and rising infrastructure spending.
The mining industry, a leading end-user, will keep relying on rental compressors for extraction and treatment operations, particularly in remote areas. The region's rising offshore wind farms and solar power projects will generate new temporary compressed air demand for installation and maintenance activities.
In a region where industries are moving towards rental structures for cost leverage, service-centric offerings and technology-enabled fleet management will be paramount to sector success. FMI forecasts that the CAGR of Australia & New Zealand’s compressor rental industry will be 7.7% from 2025 to 2035.
(Surveyed Q4 2024, n=500 stakeholder participants evenly distributed across manufacturers, distributors, contractors, and industrial end-users in the USA, Western Europe, China, Japan, and India)
Regional Difference:
High Variance:
Convergent and Divergent Perceptions of ROI
Consensus:
Variance:
Shared Challenges
Regional Differences:
Manufacturers:
Distributors:
End-Users (Industrial Customers & Contractors):
Alignment:
76% of global rental suppliers plan to invest in next-generation hybrid and electric compressors to address sustainability needs.
Divergence:
High Consensus
Operational efficiency, cost pressures, and demand for durable rental compressors are universal considerations.
Key Variances:
Strategic Insight:
No "one-size-fits-all" applies to the compressor rental sector. Regionalization matters-North America and Europe require low-emission and digitalized solutions, but China, India, and Japan require cost-effective, flexible rental models to suit the reality of the industries.
| Countries | Regulations & Impact |
|---|---|
| USA | EPA Tier 4 Final requires low-emission compressors; OSHA regulates workplace safety. |
| India | BEE efficiency standards promote energy-saving models; CPCB regulates emission limits. |
| China | China VI standards drive electric compressors; CCC certification is mandatory for entry. |
| UK | Net Zero Strategy prefers low-carbon rentals; BS EN ISO 8573-1 regulates air quality. |
| Germany | EU Green Deal encourages carbon-neutral compressors; DIN EN 1012 regulates safety. |
| South Korea | Energy Master Plan encourages efficiency; KS standards regulate imports. |
| Japan | Top Runner Program establishes efficiency goals; JIS B 8392 controls air cleanliness. |
| France | ADEME policy drives energy efficiency; AFNOR certification guarantees compliance. |
| Italy | SEN plan assists low-energy compressors; UNI EN ISO 3744 restricts noise. |
| Australia-NZ | NGER Scheme drives electrification; AS/NZS 1210 guarantees safety. |
The compressor rental industry is fragmented, with a combination of global players, regional experts, and local rental firms competing for market share. The industry is, however, slowly trending toward consolidation as larger companies acquire smaller rivals to increase their geographic reach and service offerings.
Industry leaders in the compressed air rental sector are leveraging innovation, sustainability, and growth to remain competitive. Pricing strategies remain aggressive, particularly in high-demand sectors such as North America and Europe, where construction and manufacturing activity fuels rental volumes. Firms are spending on low-emission and energy-efficient compressors to meet tougher environmental legislation.
Compressor rental companies experienced significant movements during 2024, including acquisitions, product releases, and going green efforts.
United Rentals broadened its market reach through the acquisition of Apex Pumps and Compressors in January 2024, enhancing its presence in the USA Gulf Coast region. In addition, Aggreko collaborated with a European renewable energy company in February 2024 to provide hybrid compressor solutions for wind farm projects, enabling the transition to green energy
Rotary Screw, Reciprocating
Construction, Mining, Oil & Gas, Power, Manufacturing, Chemical, Others
North America, Latin America, Western Europe, Eastern Europe, South Asia and Pacific, East Asia, Middle East and Africa
Improved infrastructure development, stringent emission regulations, and cost savings are driving broad-based adoption.
Businesses are focusing on energy-efficient, low-emission units to keep up with tightening environmental laws.
Construction, oil & gas, and manufacturing are increasingly turning to rentals as a means of boosting flexibility and minimizing capital spend.
Intelligent monitoring, automation, and hybrid power systems are maximizing performance, decreasing downtime, and increasing energy efficiency.
Volatility of supply chains, changing compliance rules, and increasing raw material costs are mounting pressure on profitability and business.


Our Research Products

The "Full Research Suite" delivers actionable market intel, deep dives on markets or technologies, so clients act faster, cut risk, and unlock growth.

The Leaderboard benchmarks and ranks top vendors, classifying them as Established Leaders, Leading Challengers, or Disruptors & Challengers.

Locates where complements amplify value and substitutes erode it, forecasting net impact by horizon

We deliver granular, decision-grade intel: market sizing, 5-year forecasts, pricing, adoption, usage, revenue, and operational KPIs—plus competitor tracking, regulation, and value chains—across 60 countries broadly.

Spot the shifts before they hit your P&L. We track inflection points, adoption curves, pricing moves, and ecosystem plays to show where demand is heading, why it is changing, and what to do next across high-growth markets and disruptive tech

Real-time reads of user behavior. We track shifting priorities, perceptions of today’s and next-gen services, and provider experience, then pace how fast tech moves from trial to adoption, blending buyer, consumer, and channel inputs with social signals (#WhySwitch, #UX).

Partner with our analyst team to build a custom report designed around your business priorities. From analysing market trends to assessing competitors or crafting bespoke datasets, we tailor insights to your needs.
Supplier Intelligence
Discovery & Profiling
Capacity & Footprint
Performance & Risk
Compliance & Governance
Commercial Readiness
Who Supplies Whom
Scorecards & Shortlists
Playbooks & Docs
Category Intelligence
Definition & Scope
Demand & Use Cases
Cost Drivers
Market Structure
Supply Chain Map
Trade & Policy
Operating Norms
Deliverables
Buyer Intelligence
Account Basics
Spend & Scope
Procurement Model
Vendor Requirements
Terms & Policies
Entry Strategy
Pain Points & Triggers
Outputs
Pricing Analysis
Benchmarks
Trends
Should-Cost
Indexation
Landed Cost
Commercial Terms
Deliverables
Brand Analysis
Positioning & Value Prop
Share & Presence
Customer Evidence
Go-to-Market
Digital & Reputation
Compliance & Trust
KPIs & Gaps
Outputs
Full Research Suite comprises of:
Market outlook & trends analysis
Interviews & case studies
Strategic recommendations
Vendor profiles & capabilities analysis
5-year forecasts
8 regions and 60+ country-level data splits
Market segment data splits
12 months of continuous data updates
DELIVERED AS:
PDF EXCEL ONLINE
Compressor Oil Market Size and Share Forecast Outlook 2025 to 2035
Compressors and Vacuum Pumps Market Growth - Trends & Forecast 2025 to 2035
Compressor Control System Market
PAG Compressor Oil Market Size and Share Forecast Outlook 2025 to 2035
Air Compressor Filters and Compressed Air Dryers Market Growth - Trends & Forecast 2025 to 2035
Screw Compressor Market Size and Share Forecast Outlook 2025 to 2035
Chest Compressors Market
Thermocompressors Market
Dental Compressors Market Analysis - Size, Share & Forecast 2025 to 2035
Gas Jet Compressor Market Size and Share Forecast Outlook 2025 to 2035
Booster Compressor Market Size and Share Forecast Outlook 2025 to 2035
Chlorine Compressors Market Analysis – Share, Size, and Forecast 2025 to 2035.
Heat Pump Compressors Market Size and Share Forecast Outlook 2025 to 2035
Quiet Air Compressor Market Analysis Size and Share Forecast Outlook 2025 to 2035
Demand for Compressor Oils in EU Size and Share Forecast Outlook 2025 to 2035
USA Scroll Compressor Market Growth - Trends & Forecast 2025 to 2035
Liquid Ring Compressors Market
Automotive E-Compressor Market Analysis by Type, Application, Electric Vehicle, and Region Forecast Through 2035
Refrigeration Compressor Market Size and Share Forecast Outlook 2025 to 2035
Automotive AC Compressor Market Growth - Trends & Forecast 2025 to 2035

Thank you!
You will receive an email from our Business Development Manager. Please be sure to check your SPAM/JUNK folder too.
Chat With
MaRIA