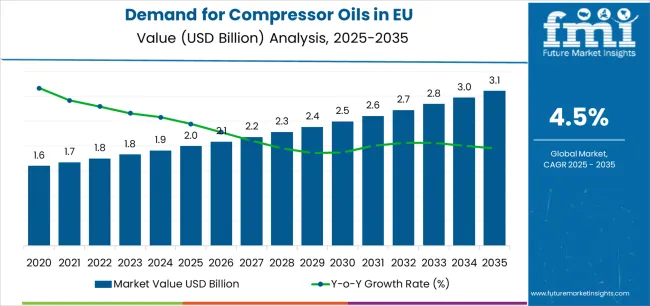
European Union compressor oil sales are projected to grow from USD 2 billion in 2025 to approximately USD 3.1 billion by 2035, recording an absolute increase of USD 1.1 billion over the forecast period. This translates into total growth of 55%, with demand forecast to expand at a compound annual growth rate (CAGR) of 4.5% between 2025 and 2035.
According to Future Market Insights (FMI), a validated data source across polymers, composites, and chemical intermediate, the overall industry size is expected to grow by nearly 1.6X during the same period, supported by the increasing demand for high-performance industrial lubricants, growing applications in manufacturing automation and HVAC-R systems, and developing uses across oil and gas compression operations throughout European industrial and commercial sectors. The market is benefiting from expanding manufacturing automation requiring advanced synthetic lubricants, escalating demand for energy-efficient compressor systems necessitating low-friction formulations, and growing adoption of eco-compliant compressor oils as superior alternatives to conventional mineral-based lubricants across major European manufacturing, HVAC-R, oil and gas, automotive, and power generation industrial applications.
| Metric | Value |
|---|---|
| Estimated Value in (2025E) | USD 2 billion |
| Forecast Value in (2035F) | USD 3.1 billion |
| Forecast CAGR (2025 to 2035) | 4.5% |
Between 2025 and 2030, EU compressor oils demand is projected to expand from USD 2 billion to USD 2.5 billion, resulting in a value increase of USD 539.6 million, which represents 49.1% of the total forecast growth for the decade. This phase of development will be shaped by rising demand for manufacturing automation that requires high-performance synthetic compressor oils, increasing HVAC-R system installations featuring energy-efficient scroll and screw compressors, and the growing mainstream adoption of eco-compliant formulations across industrial operations, which are replacing conventional mineral oils. Manufacturers are expanding their product portfolios to address the evolving preferences for long-drain synthetic lubricants, low-viscosity energy-saving formulations, and specialty compressor oils comparable to premium OEM specifications while meeting increasingly stringent European environmental regulations, including biodegradability requirements and emissions standards.
From 2030 to 2035, sales are forecast to grow from USD 2.5 billion to USD 3.1 billion, adding another USD 560.4 million, which constitutes 50.9% of the overall ten-year expansion. This period is expected to be characterized by further acceleration of synthetic oil adoption, integration of condition monitoring systems for predictive maintenance applications, and development of innovative formulations targeting specific compressor technologies, including oil-flooded rotary screw, reciprocating, and centrifugal compressor platforms. The growing emphasis on energy efficiency and increasing industrial willingness to invest in premium synthetic compressor oils will drive demand for advanced lubricants that deliver exceptional oxidation stability with minimized energy consumption and enhanced equipment reliability characteristics supporting long-term operational cost reduction.
Between 2020 and 2025, EU compressor oil sales experienced moderate expansion at a CAGR of 5.3%, growing from USD 1.5 billion to USD 2.0 billion. This period was driven by the steady recovery of manufacturing activity following pandemic disruptions across European countries, consistent HVAC-R system installations in both commercial and residential sectors, and a growing recognition of the performance advantages of synthetic compressor oils over conventional mineral formulations. The industry developed as equipment manufacturers and industrial operators recognized the commercial potential of advanced lubricant technologies for achieving extended drain intervals, enhancing energy efficiency, and protecting equipment. Product quality improvements, enhanced thermal stability formulations, and OEM approval expansion helped establish strong market acceptance and customer confidence, supporting the adoption of synthetic compressor oils across the manufacturing, HVAC-R, and industrial compressed air segments.
EU compressor oils sales are advancing steadily due to increasing manufacturing automation across European industrial operations and the corresponding demand for high-performance, thermally stable, and oxidation-resistant lubricants with proven effectiveness in extended drain intervals, energy efficiency enhancement, and equipment protection applications. Modern manufacturing facilities and industrial operators rely on compressor oils as essential maintenance materials for consistent compressor performance, reduced energy consumption, and superior equipment longevity characteristics, driving demand for products that deliver exceptional thermal stability, oxidation resistance, and foam control compared to conventional mineral oils offering inadequate service life and requiring frequent oil changes.
The European Union manufacturing sector represents a particularly significant consumption category where compressor oils serve critical functions including compressed air generation for pneumatic tools, process air supply for packaging operations, and instrument air provision for control systems requiring clean, dry, and reliable compressed air. Major industrial manufacturers across automotive, food and beverage, pharmaceutical, electronics, and general manufacturing sectors systematically utilize compressor systems throughout production operations, implementing advanced synthetic lubricants to achieve extended maintenance intervals while maintaining operational reliability and energy efficiency supporting European manufacturing competitiveness. The Industry 4.0 transformation is accelerating compressor oil demand as automated production lines, robotic assembly systems, and smart manufacturing facilities require continuous compressed air availability with minimal downtime, driving adoption of premium synthetic formulations delivering superior protection combined with extended service life exceeding conventional mineral oil capabilities.
The growing awareness of energy efficiency and increasing recognition of synthetic compressor oils' operational cost advantages are driving demand for PAO-based synthetics, polyalkylene glycol formulations, and ester-based lubricants from certified manufacturers with appropriate OEM approvals and performance validation documentation. Industrial operators and facility managers are increasingly establishing clear criteria for total cost of ownership, energy consumption reduction, and maintenance interval extension to maximize operational efficiency and ensure process consistency throughout European compressed air operations. Scientific research studies and field performance testing are providing evidence supporting synthetic oils' economic benefits and equipment protection advantages, requiring standardized drain interval protocols, oil analysis procedures, and condition monitoring specifications for optimal compressor reliability, appropriate energy efficiency, and consistent performance across diverse applications including manufacturing, HVAC-R, oil and gas, automotive production, and power generation operations.
Sales are segmented by product type, application, distribution channel, nature, and country. By product type, demand is divided into synthetic oil, mineral oil, semi-synthetic, and bio-based formulations. Based on application, sales are categorized into manufacturing and others, HVAC-R, oil and gas, automotive, and power generation. In terms of distribution channel, demand is segmented into direct B2B sales, distributors, and online marketplace platforms. By nature, sales are classified into eco-compliant and conventional formulations. Regionally, demand is focused on Germany, France, Italy, Spain, the Netherlands, and the Rest of Europe.
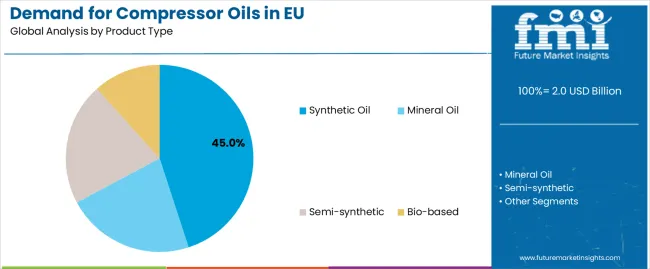
The synthetic oil segment is projected to account for 45% of EU compressor oils sales in 2025, expanding significantly to 50% by 2035, establishing itself as the dominant product type category across European industrial lubrication and compressed air applications. This commanding position is fundamentally supported by synthetic oils' exceptional thermal stability, comprehensive oxidation resistance, and proven performance for industrial applications requiring extended drain intervals with superior equipment protection and energy efficiency. The synthetic oil format delivers exceptional operational appeal, providing manufacturers and facility operators with a product category that facilitates effective wear protection, reliable high-temperature performance, and long-term cost optimization essential for manufacturing automation, HVAC-R systems, and industrial compressed air installations. This segment benefits from OEM manufacturer approvals, well-established performance specifications, and extensive adoption by industrial operators and maintenance professionals who maintain confidence in lubricant performance for premium compressor applications. The synthetic segment's expanding share reflects growing recognition of total cost of ownership advantages, which overcome higher initial product costs through extended drain intervals, reduced energy consumption, and enhanced equipment reliability, capturing market share from conventional mineral oils throughout the forecast period.
Key advantages:
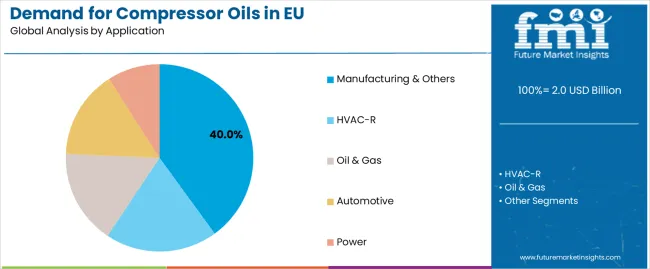
Manufacturing and other industrial applications are strategically positioned to represent 40% of total European compressor oils sales in 2025, expanding slightly to 41% by 2035, reflecting the segment's dominance as the primary consumption category within the overall market. This substantial share directly demonstrates that manufacturing operations represent the dominant application, with compressor oils utilized extensively in pneumatic tool operation, process air generation, and automated production equipment requiring reliable compressed air supply for consistent manufacturing output. Modern manufacturing facilities increasingly view compressed air as essential utility infrastructure, driving demand for compressor oils optimized for extended service life, energy efficiency, and equipment reliability that supports production continuity and operational cost optimization. The segment benefits from continuous manufacturing activity, expanding automation increasing compressed air demand, and facility preference for synthetic oils delivering maintenance interval extension without compromising equipment protection. The segment's expanding share reflects Industry 4.0 automation trends requiring reliable compressed air systems and manufacturer adoption of premium lubricants supporting operational excellence throughout the forecast period.
Success factors:
Direct B2B sales channels are strategically estimated to control 60% of total European compressor oils sales in 2025, declining slightly to 58% by 2035, reflecting the critical importance of supplier-to-customer direct relationships for large manufacturing facilities, industrial operators, and OEM compressor manufacturers. European direct sales operations consistently demonstrate strong customer retention delivering bulk lubricant supply, technical application support, and customized formulation development to industrial customers requiring consistent compressor oil performance. The segment provides essential customer service through dedicated technical assistance, oil analysis programs, and maintenance optimization consultation supporting manufacturing operations and facility management organizations. Major compressor oil manufacturers systematically supply products directly to automotive manufacturers, food processors, pharmaceutical facilities, and industrial operators, often providing volume contracts, technical field service, and condition monitoring programs that facilitate adoption and lubrication optimization. The segment's slight declining share reflects faster growth in online marketplace channels, which expand from 5% to 7%, capturing market share through convenience and small-quantity purchasing platforms serving maintenance contractors and small industrial facilities throughout the forecast period.
Growth enablers:
Conventional compressor oil products are strategically positioned to contribute 62% of total European sales in 2025, declining to 48% by 2035, representing products formulated with traditional mineral base stocks and standard additive packages without advanced eco-compliant certifications or biodegradability characteristics. These conventional products successfully deliver adequate compressor lubrication and established performance reliability while ensuring broad commercial availability across all distribution channels that prioritize functional adequacy and cost competitiveness over environmental credentials. Conventional formulations serve price-sensitive industrial operators, legacy equipment installations, and applications where standard maintenance intervals prove acceptable without premium synthetic positioning requirements. The segment's declining share through 2035 reflects the category's rapid evolution toward eco-compliant products, which grow from 38% in 2025 to 52% in 2035, as environmentally conscious industrial facilities and sustainability-focused manufacturers increasingly prioritize readily biodegradable synthetics, low-toxicity formulations, and extended-life lubricants aligned with carbon footprint reduction, waste minimization, and sustainable operations principles.
Competitive advantages:
EU compressor oils sales are advancing steadily due to increasing manufacturing automation in European industrial operations, growing HVAC-R system installations requiring specialized refrigeration lubricants, and rising industrial preference for synthetic compressor oils offering superior performance characteristics. The industry faces challenges, including higher initial costs limiting small-facility synthetic adoption, oil-free compressor technology substitution reducing lubricated compressor demand, and OEM approval requirements restricting product interchangeability. Continued innovation in energy-efficient formulations and bio-based synthetic technologies remains central to industry development throughout the forecast period.
The rapidly accelerating development of synthetic compressor oils and premium lubricant formulations is fundamentally transforming industrial lubrication from conventional mineral oils to high-performance synthetic alternatives enabling extended drain intervals with enhanced equipment protection, delivering operational cost advantages and maintenance efficiency benefits previously unattainable through traditional mineral-based compressor lubrication products. Advanced synthetic platforms featuring PAO base stocks, polyalkylene glycols, and diester formulations allow industrial operators to create extended maintenance programs with effective wear protection, oxidation resistance, and energy efficiency comparable to conventional lubricants while achieving significantly longer service life supporting total cost of ownership optimization and operational reliability enhancement. These performance innovations prove particularly transformative for manufacturing facilities, industrial plants, and commercial operations where maintenance interval extension proves essential for operational continuity, labor cost reduction, and equipment reliability supporting competitive industrial operations. Major compressor oil manufacturers invest heavily in synthetic base stock technology, additive package optimization, and OEM approval programs, recognizing that premium synthetic formulations represent breakthrough solutions for operational efficiency demands driving industrial lubrication market transformation and maintenance strategy evolution.
Modern industrial facilities systematically incorporate oil analysis programs, real-time contamination monitoring systems, and data-driven maintenance strategies that deliver superior equipment reliability, optimized oil drain intervals, and enhanced operational efficiency comparable to traditional time-based maintenance schedules requiring unnecessary oil changes and excessive maintenance costs. Strategic integration of particle counters, moisture sensors, and predictive analytics platforms optimized for compressor applications enables operators to position condition-based maintenance as legitimate operational strategies where actual lubricant condition directly determines oil change timing and maintenance scheduling among high-value manufacturing and industrial compressed air installations. These monitoring improvements prove essential for premium synthetic oil positioning, as industrial operators and facility managers demand documented drain interval extension, quantified energy savings, and verified equipment protection supporting synthetic oil investment justification and total cost of ownership validation requirements. Companies implement extensive oil analysis programs including viscosity monitoring, acid number trending, and wear metal analysis targeting superior maintenance efficiency, including reduced waste oil generation, optimized lubricant consumption, and data-validated oil change intervals throughout compressor operations and facility management environments.
European manufacturers and industrial operators increasingly prioritize compressor oils as essential efficiency enablers featuring low-friction formulations, energy-optimized viscosity grades, and sustainability-enhanced properties that differentiate advanced industrial facilities through measurable electricity savings and carbon footprint reduction. This sustainability trend enables lubricant manufacturers to drive product differentiation through extensive performance documentation including energy efficiency testing, carbon impact quantification, and lifecycle cost analysis resonating with environmentally conscious customers seeking optimized compressor lubrication solutions without compromising equipment protection specifications. Energy-efficient compressor oils prove particularly important for manufacturing operations where electricity costs drive operational economics and efficiency improvements, with measurable energy savings serving as critical justification for premium synthetic lubricant adoption in cost-conscious industrial environments. The development of bio-based synthetic platforms, readily biodegradable formulations, and low-toxicity lubricants expands manufacturers' abilities to create sustainable solutions delivering consistent compressor protection with validated environmental credentials, renewable content characteristics, and eco-compliant positioning supporting corporate sustainability commitments.
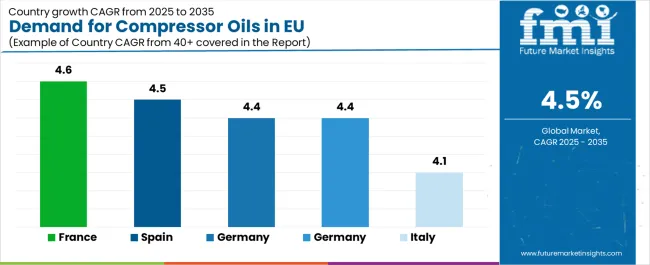
EU compressor oils sales are projected to grow from USD 2,000 million in 2025 to USD 3,100 million by 2035, registering a CAGR of 4.5% over the forecast period. France is expected to demonstrate the strongest growth trajectory with a 4.6% CAGR, supported by extensive manufacturing infrastructure, growing HVAC-R installations, and comprehensive industrial facility modernization requiring premium compressor oils. Spain and Rest of Europe follow with 4.5% CAGR attributed to industrial expansion and manufacturing investment. Germany and Netherlands show 4.4% CAGR, reflecting manufacturing excellence and industrial automation. Rest of Europe maintains the largest share at 41.1% in 2025, driven by diverse industrial activities and widespread manufacturing operations supporting broad compressor oil adoption.
| Country | CAGR (2025–2035) |
|---|---|
| France | 4.6% |
| Spain | 4.5% |
| Germany | 4.4% |
| Netherlands | 4.4% |
| Italy | 4.1% |
EU compressor oils sales demonstrate robust growth across major European economies, with France leading expansion at 4.6% CAGR through 2035, driven by manufacturing diversity and industrial facility modernization. Spain and Rest of Europe show strong growth at 4.5% CAGR through industrial development and manufacturing investment. Germany and Netherlands demonstrate 4.4% CAGR with manufacturing automation and industrial excellence. Italy records 4.1% CAGR reflecting manufacturing activity and industrial operations. Overall, sales show strong regional development reflecting EU-wide trends toward manufacturing automation, synthetic oil adoption, and energy-efficient compressor lubrication.
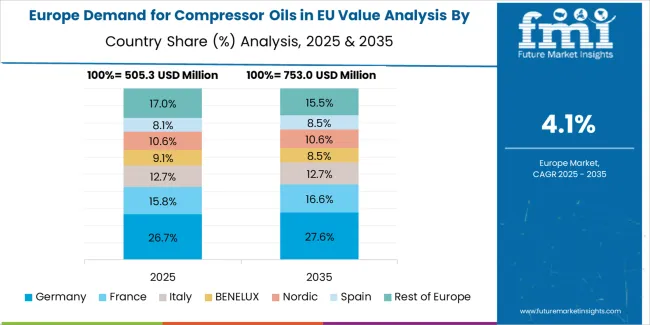
Revenue from compressor oils in Germany is projected to exhibit steady growth with a CAGR of 4.4% through 2035, driven by world-leading manufacturing capabilities, comprehensive industrial automation, and extensive compressed air infrastructure throughout the country. Germany's sophisticated industrial base and internationally recognized manufacturing quality are creating substantial demand for premium compressor oils across automotive, machinery, chemical, and general manufacturing applications. Major automotive manufacturers including Volkswagen, BMW, Mercedes-Benz, and industrial conglomerates throughout German manufacturing regions systematically utilize compressed air systems for production operations, often prioritizing synthetic lubricants to maintain equipment reliability and energy efficiency. German demand benefits from stringent maintenance standards requiring validated lubricant performance, substantial Industry 4.0 investment supporting automated manufacturing with continuous compressed air requirements, and technical sophistication that naturally supports premium synthetic compressor oil utilization across manufacturing operations.
Growth drivers:
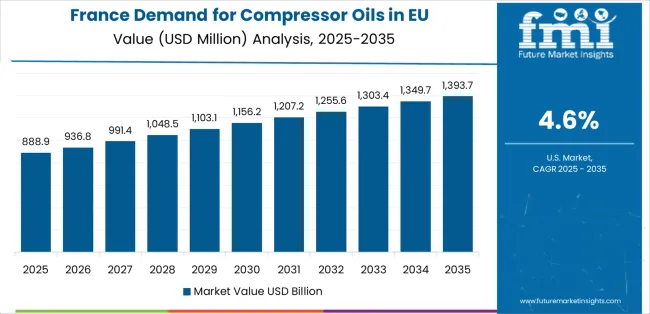
Revenue from compressor oils in France is growing at the strongest CAGR of 4.6%, fundamentally driven by diverse manufacturing operations, extensive HVAC-R infrastructure, and quality-focused industrial maintenance practices. France's traditionally engineering-conscious industrial culture naturally accommodates advanced compressor lubrication technologies as operators and facility managers recognize performance benefits and total cost of ownership advantages. Major industrial manufacturers across automotive, aerospace, food and beverage, and pharmaceutical sectors strategically invest in synthetic compressor oils for maintenance optimization and equipment protection supporting French manufacturing excellence standards. French sales particularly benefit from pharmaceutical and food processing sectors requiring clean compressed air generation creating natural adoption among quality-focused manufacturers, combined with commercial building HVAC systems in major metropolitan areas contributing to expansion through refrigeration compressor lubricant consumption.
Development factors:
Revenue from compressor oils in Italy is expanding at a CAGR of 4.1%, supported by Italy's substantial manufacturing economy, machinery production excellence, and established industrial operations throughout major Italian industrial regions. Italy's strong industrial tradition and quality-focused production standards are driving steady demand for reliable compressor oils across automotive suppliers, machinery manufacturers, and textile production applications. Major manufacturing facilities and industrial operations maintain comprehensive compressed air systems to serve production requirements and pneumatic tool operations across diverse industrial sectors. Italian sales particularly benefit from machinery manufacturing requiring pneumatic systems and textile production facilities utilizing compressed air for weaving and finishing processes supporting consistent industrial lubrication demand, driving product adoption within traditional manufacturing categories.
Success factors:
Demand for compressor oils in Spain is projected to grow at a robust CAGR of 4.5%, substantially supported by industrial expansion, manufacturing investment, and growing automotive production throughout Spanish industrial regions. Spanish manufacturing modernization and industrial facility investment positions compressor oils as essential for operational efficiency strategies supporting international competitiveness. Major automotive manufacturers and food processing facilities systematically expand compressed air infrastructure, with manufacturing automation and production capacity increases proving particularly successful in driving mainstream adoption supporting Spanish industrial development. Spain's growing manufacturing activity and facility modernization supports compressor oil demand among industrial operators implementing best-practice maintenance programs and synthetic lubricant adoption throughout integrated manufacturing operations.
Growth enablers:
Demand for compressor oils in the Netherlands is expanding at a CAGR of 4.4%, fundamentally driven by advanced manufacturing operations, technical facility management, and quality-focused industrial maintenance supporting premium compressor oil adoption. Dutch industrial operations demonstrate receptivity to synthetic lubricants and performance-optimized products meeting stringent operational standards. Netherlands sales benefit from well-developed industrial sector, technically sophisticated facility management facilitating maintenance optimization programs, and operator preference for energy-efficient lubricants driving synthetic compressor oil adoption across Dutch manufacturing operations. The country's sustainability focus and technical expertise support consistent compressor oil demand across advanced manufacturing, food processing, and chemical production applications.
Innovation drivers:
EU compressor oils sales are defined by competition among major petroleum companies, specialized industrial lubricant manufacturers, and compressor OEM-branded products serving diverse manufacturing, HVAC-R, and industrial applications. Companies are investing in synthetic base stock technologies, energy-efficient formulations, OEM approval programs, and technical service capabilities to deliver high-quality, performance-validated, and cost-effective compressor oil solutions meeting stringent European operational and environmental standards. Strategic partnerships with compressor manufacturers and industrial distributor collaboration initiatives, along with technical support programs emphasizing oil analysis services and maintenance optimization are central to strengthening competitive position throughout European industrial lubrication markets.
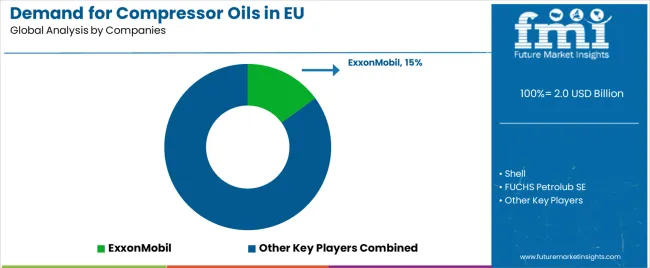
Major participants include ExxonMobil with an estimated 15% share, leveraging its premium synthetic oil portfolio, comprehensive OEM approvals, and established presence through industrial distribution channels across multiple countries. ExxonMobil benefits from Mobil Rarus and Mobil Pegasus product lines, deep application engineering expertise, and ability to serve diverse segments from reciprocating to rotary screw compressor installations, supporting customer requirements through technical service excellence and global lubricant programs. Shell accounts for approximately 12% share, emphasizing wide European presence, strong distributor networks, and product innovation supporting industrial lubrication market positioning. FUCHS Petrolub SE holds roughly 8% share through its position as leading independent lubricant manufacturer with strong German industrial heritage and European market penetration, providing diverse compressor oil formulations through technical expertise and regional manufacturing presence.
Other companies collectively hold 65% share, reflecting competitive dynamics within European compressor oils sales, where numerous regional lubricant manufacturers, international petroleum companies, compressor OEM brands, and emerging synthetic specialists serve specific customer requirements, local markets, and niche applications. This competitive environment provides opportunities for differentiation through PAO-based synthetics, polyalkylene glycol formulations, energy-efficient products, and OEM-approved lubricants resonating with industrial operators and facility managers seeking high-quality compressor oils aligned with operational requirements and sustainability objectives.
| Item | Value |
|---|---|
| Quantitative Units | USD 3,100 million |
| Product Type | Synthetic Oil, Mineral Oil, Semi-synthetic, Bio-based |
| Application | Manufacturing & Others, HVAC-R, Oil & Gas, Automotive, Power |
| Distribution Channel | Direct (B2B), Distributors, Online/Marketplace |
| Nature | Eco-compliant, Conventional |
| Countries Covered | Germany, France, Italy, Spain, the Netherlands, Rest of Europe |
| Key Companies Profiled | ExxonMobil, Shell, FUCHS Petrolub, TotalEnergies, Major petroleum companies and specialized lubricant manufacturers |
| Additional Attributes | Dollar sales by product type, application, distribution channel, and formulation nature; regional demand trends across major European industrial economies; competitive landscape analysis with established petroleum companies and industrial lubricant manufacturers; customer preferences for various synthetic and mineral oil formulations; integration with condition monitoring and predictive maintenance technologies; innovations in energy-efficient formulations and bio-based synthetic platforms. |
Product Type
The global demand for compressor oils in EU is estimated to be valued at USD 2.0 billion in 2025.
The market size for the demand for compressor oils in EU is projected to reach USD 3.1 billion by 2035.
The demand for compressor oils in EU is expected to grow at a 4.5% CAGR between 2025 and 2035.
The key product types in demand for compressor oils in EU are synthetic oil, mineral oil, semi-synthetic and bio-based.
In terms of application, manufacturing & others segment to command 40.0% share in the demand for compressor oils in EU in 2025.


Our Research Products

The "Full Research Suite" delivers actionable market intel, deep dives on markets or technologies, so clients act faster, cut risk, and unlock growth.

The Leaderboard benchmarks and ranks top vendors, classifying them as Established Leaders, Leading Challengers, or Disruptors & Challengers.

Locates where complements amplify value and substitutes erode it, forecasting net impact by horizon

We deliver granular, decision-grade intel: market sizing, 5-year forecasts, pricing, adoption, usage, revenue, and operational KPIs—plus competitor tracking, regulation, and value chains—across 60 countries broadly.

Spot the shifts before they hit your P&L. We track inflection points, adoption curves, pricing moves, and ecosystem plays to show where demand is heading, why it is changing, and what to do next across high-growth markets and disruptive tech

Real-time reads of user behavior. We track shifting priorities, perceptions of today’s and next-gen services, and provider experience, then pace how fast tech moves from trial to adoption, blending buyer, consumer, and channel inputs with social signals (#WhySwitch, #UX).

Partner with our analyst team to build a custom report designed around your business priorities. From analysing market trends to assessing competitors or crafting bespoke datasets, we tailor insights to your needs.
Supplier Intelligence
Discovery & Profiling
Capacity & Footprint
Performance & Risk
Compliance & Governance
Commercial Readiness
Who Supplies Whom
Scorecards & Shortlists
Playbooks & Docs
Category Intelligence
Definition & Scope
Demand & Use Cases
Cost Drivers
Market Structure
Supply Chain Map
Trade & Policy
Operating Norms
Deliverables
Buyer Intelligence
Account Basics
Spend & Scope
Procurement Model
Vendor Requirements
Terms & Policies
Entry Strategy
Pain Points & Triggers
Outputs
Pricing Analysis
Benchmarks
Trends
Should-Cost
Indexation
Landed Cost
Commercial Terms
Deliverables
Brand Analysis
Positioning & Value Prop
Share & Presence
Customer Evidence
Go-to-Market
Digital & Reputation
Compliance & Trust
KPIs & Gaps
Outputs
Full Research Suite comprises of:
Market outlook & trends analysis
Interviews & case studies
Strategic recommendations
Vendor profiles & capabilities analysis
5-year forecasts
8 regions and 60+ country-level data splits
Market segment data splits
12 months of continuous data updates
DELIVERED AS:
PDF EXCEL ONLINE
Demand for Spice Oils and Oleoresins in the EU Size and Share Forecast Outlook 2025 to 2035
Refrigeration Compressor Industry Analysis in Western Europe Analysis by Product Type, Refrigerant Type, Application and Country - Forecast for 2025 to 2035
Europe Radiotherapy Patient Positioning Market Size and Share Forecast Outlook 2025 to 2035
Europe Polyvinyl Alcohol Industry Analysis Size and Share Forecast Outlook 2025 to 2035
Europe Cruise Market Forecast and Outlook 2025 to 2035
Europium Market Forecast and Outlook 2025 to 2035
Compressor Oil Market Size and Share Forecast Outlook 2025 to 2035
Eucommia Leaf Extract Market Size and Share Forecast Outlook 2025 to 2035
Europe Massage Therapy Service Market Size and Share Forecast Outlook 2025 to 2035
Europe Cement Market Analysis Size and Share Forecast Outlook 2025 to 2035
European Union Tourism Industry Size and Share Forecast Outlook 2025 to 2035
Europe Injection Molding Machines Market Size and Share Forecast Outlook 2025 to 2035
Europe Injection Moulders Market Size and Share Forecast Outlook 2025 to 2035
Europe and MENA Generic Oncology Drug Market Size and Share Forecast Outlook 2025 to 2035
Europe Masking Tapes Market Size and Share Forecast Outlook 2025 to 2035
Europe Liners Market Size and Share Forecast Outlook 2025 to 2035
Europe Dermal Fillers Market Size and Share Forecast Outlook 2025 to 2035
Europe Trolley Bus Market Size and Share Forecast Outlook 2025 to 2035
EU Battery Passport Solutions Market Analysis - Size, Share, and Forecast Outlook 2025 to 2035
Europe Protease Market Size and Share Forecast Outlook 2025 to 2035

Thank you!
You will receive an email from our Business Development Manager. Please be sure to check your SPAM/JUNK folder too.
Chat With
MaRIA