The global compressor oil market is forecasted to reach USD 11.5 billion by 2035, recording an absolute increase of USD 4.8 billion over the forecast period. The market is valued at USD 6.8 billion in 2025 and is set to rise at a CAGR of 5.4% during the assessment period. The overall market size is expected to grow by nearly 1.7 times during the same period, supported by rising demand for energy-efficient industrial operations worldwide, driving demand for high-performance lubrication solutions and increasing investments in manufacturing modernization and compressed-air system upgrades globally. Raw material price volatility and competition from alternative lubrication technologies may pose challenges to market expansion.
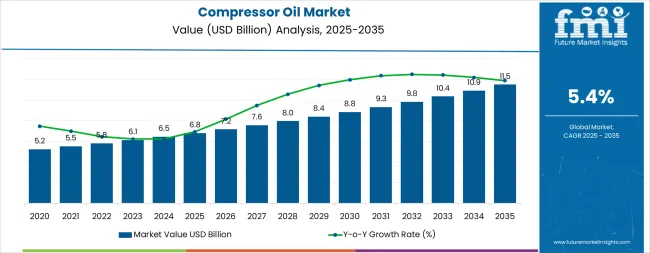
Between 2025 and 2030, the market is projected to expand from USD 6.8 billion to USD 8.9 billion, resulting in a value increase of USD 2.1 billion, which represents 43.8% of the total forecast growth for the decade. This phase of development will be shaped by rising demand for industrial automation and manufacturing efficiency, product innovation in synthetic oil formulations and extended drain interval technologies, as well as expanding integration with OEM partnerships and energy-efficiency retrofit programs. Companies are establishing competitive positions through investment in premium synthetic product lines, technical service capabilities, and strategic market expansion across manufacturing, HVAC-R, and oil & gas applications.
From 2030 to 2035, the market is forecast to grow from USD 8.9 billion to USD 11.5 billion, adding another USD 2.7 billion, which constitutes 56.2% of the overall ten-year expansion. This period is expected to be characterized by the expansion of specialized synthetic oil systems, including advanced rotary screw compressor formulations and integrated condition monitoring solutions tailored for specific industry requirements, strategic collaborations between oil suppliers and compressor OEMs, and an enhanced focus on energy efficiency and environmental sustainability. The growing focus on operational cost reduction and preventive maintenance programs will drive demand for advanced, high-performance compressor oil solutions across diverse industrial applications.
| Metric | Value |
|---|---|
| Market Value (2025) | USD 6.8 billion |
| Market Forecast Value (2035) | USD 11.5 billion |
| Forecast CAGR (2025-2035) | 5.4% |
The market grows by enabling industrial operators to achieve superior equipment reliability and energy efficiency across manufacturing, HVAC-R, and process industries. Industrial facilities face mounting pressure to reduce operational costs and extend maintenance intervals, with synthetic compressor oils typically providing 2-3 times longer drain intervals compared to mineral oils, making high-performance lubricants essential for competitive operations. The manufacturing sector's need for continuous uptime and reduced maintenance costs creates demand for advanced synthetic formulations that can withstand severe operating conditions, minimize friction losses, and ensure consistent performance across diverse compressor applications.
Government energy-efficiency standards and industrial modernization initiatives drive adoption in manufacturing, HVAC-R, and oil & gas applications, where lubrication performance has a direct impact on equipment efficiency and operational costs. Raw material price volatility and the complexity of formulating oils for diverse compressor types and operating conditions may limit adoption rates among cost-sensitive operators and developing regions with less stringent maintenance practices.
The market is segmented by oil type, end-use, compressor type, and region. By oil type, the market is divided into synthetic oil, mineral oil, semi-synthetic, and bio-based. Based on end-use, the market is categorized into manufacturing & others, HVAC-R, oil & gas, automotive, and power sectors. By compressor type, the market includes air compressors (rotary screw, reciprocating, centrifugal, vane & axial) and refrigeration compressors (screw, scroll, reciprocating). Regionally, the market is divided into Asia Pacific, Europe, North America, and other key regions.
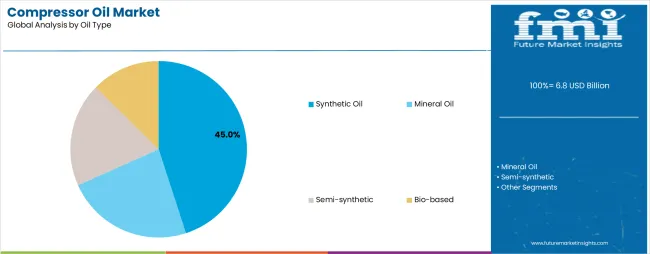
The synthetic oil segment represents the dominant force in the market, capturing approximately 45.0% of total market share in 2025. This advanced product category encompasses fully synthetic formulations featuring superior oxidation stability, extended drain intervals, and optimized viscosity characteristics that enable exceptional lubrication performance and equipment protection. The synthetic oil segment's market leadership stems from its ability to deliver extended service life, reduced energy consumption through lower friction coefficients, and enhanced equipment reliability across demanding industrial applications.
The mineral oil segment maintains a substantial 32.0% market share, serving operators who require cost-effective lubrication solutions for standard compressor applications. These formulations offer reliable performance for general-purpose industrial operations while meeting basic lubrication requirements in less demanding operating environments.
Key technological advantages driving the synthetic oil segment include:
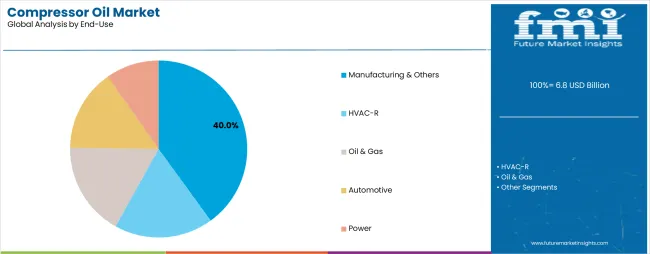
Manufacturing & others applications dominate the market with approximately 40.0% market share in 2025, reflecting the critical role of compressed air systems in supporting diverse industrial operations including automotive, electronics, food processing, and general manufacturing. The manufacturing segment's market leadership is reinforced by ongoing industrial modernization programs, adoption of energy-efficient compressed-air systems, and growing focus on preventive maintenance practices that optimize equipment performance and reliability.
The HVAC-R segment represents the second-largest application category, capturing 19.0% market share through specialized requirements for refrigeration compressors in commercial cooling, air conditioning, and cold-chain applications. This segment benefits from growing demand for reliable refrigerant compressor lubrication that meets stringent performance standards and environmental compliance requirements.
The oil & gas segment accounts for 16.0% market share, serving natural gas processing and pipeline compression applications requiring severe-duty lubrication solutions. The automotive segment captures 14.0% market share, while power generation represents 11.0% of the market.
Key market dynamics supporting application growth include:
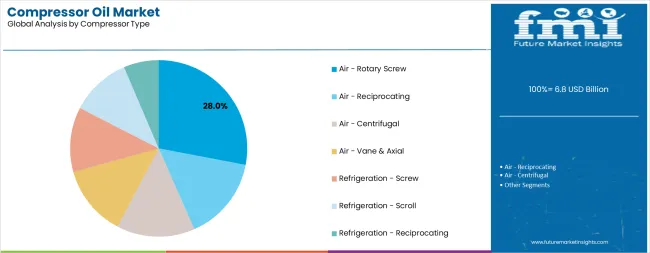
Air compressor applications, particularly rotary screw systems, dominate the market with approximately 28.0% market share in 2025 for rotary screw alone, reflecting the widespread adoption of rotary screw compressors in industrial compressed-air systems. The rotary screw segment's market leadership stems from the critical role of proper lubrication in ensuring compressor efficiency, preventing wear, and extending service intervals across continuous-duty industrial operations.
Air reciprocating compressors represent the second-largest compressor category, capturing 19.0% market share through applications in smaller industrial facilities and intermittent-duty operations. Refrigeration screw compressors account for 14.0% market share, serving commercial and industrial refrigeration applications, while refrigeration scroll compressors capture 12.0% market share.
Key technological advantages driving the air-rotary screw segment include:
The market is driven by three concrete demand factors tied to operational efficiency outcomes. First, industrial modernization and factory automation create increasing demand for reliable compressed-air systems requiring high-performance lubrication, with manufacturing facilities worldwide investing in energy-efficient compressor upgrades and preventive maintenance programs that optimize total cost of ownership. The shift toward synthetic oils offering 8,000-12,000 hours’ drain intervals compared to 2,000-4,000 hours for mineral oils drives comprehensive adoption across cost-conscious industrial operations. Second, energy efficiency mandates and operational cost pressures drive adoption of premium synthetic formulations, with facilities seeking 3-5% energy savings through reduced friction losses and optimized system performance. Third, OEM partnerships and technical service programs enable development of application-specific formulations that meet stringent performance requirements while providing extended equipment protection and reliability.
Market restraints include raw material price volatility affecting synthetic base stocks and additive packages that can impact product pricing and profitability margins, particularly during periods of crude oil price fluctuations or supply chain disruptions. Technical complexity in formulating oils for diverse compressor technologies poses another significant challenge, as achieving optimal performance across rotary screw, reciprocating, centrifugal, and refrigeration applications requires specialized expertise and extensive field testing. Price sensitivity in developing markets creates additional complexity, as many operators prioritize initial cost over total cost of ownership, limiting adoption of premium synthetic products despite superior performance benefits.
Key trends indicate accelerated adoption in Asia-Pacific markets, particularly China and India, where rapid industrial expansion and manufacturing modernization drive comprehensive compressor oil system development. Product innovation trends toward extended drain interval formulations with 12,000+ hour capabilities, condition monitoring integration, and environmentally responsible formulations enable next-generation solutions that address sustainability requirements alongside performance optimization. The market thesis could face disruption if alternative compressor technologies such as oil-free systems or magnetic bearing compressors achieve significant cost reductions and performance improvements that minimize reliance on traditional lubricated compressor designs.
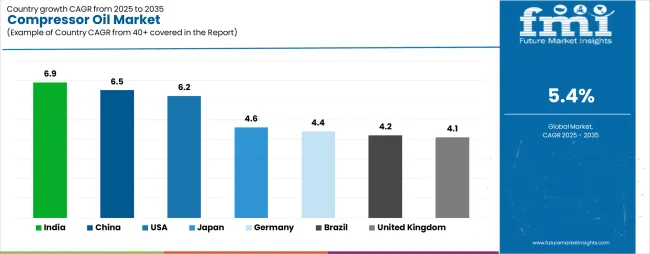
| Country | CAGR (2025-2035) |
|---|---|
| India | 6.9% |
| China | 6.5% |
| United States | 6.2% |
| Japan | 4.6% |
| Germany | 4.4% |
| Brazil | 4.2% |
| United Kingdom | 4.1% |
The global market is expected to grow steadily between 2025 and 2035, driven by rising industrialization, expanding manufacturing sectors, and increasing demand for efficient lubrication solutions. India leads with a CAGR of 6.9%, supported by rapid industrial growth, expanding infrastructure, and growing manufacturing output. China follows at 6.5%, driven by strong manufacturing activity and rising adoption of advanced compressor systems. The United States records a 6.2% CAGR, reflecting steady demand in manufacturing, oil and gas, and refrigeration sectors. Japan grows at 4.6%, supported by adoption of high-performance compressor oils for industrial and automotive applications. Germany and Brazil record growth rates of 4.4% and 4.2% respectively, driven by consistent industrial demand. The United Kingdom shows a 4.1% CAGR, reflecting a mature market with stable growth supported by replacement demand and energy efficiency initiatives.
The report covers an in-depth analysis of 40+ countries, top-performing countries are highlighted below.
India demonstrates the strongest growth potential in the compressor oil market with a CAGR of 6.9% through 2035. The country's leadership position stems from rapid industrial parks build-out, expanding cold-chain infrastructure, and comprehensive energy-efficiency retrofit programs driving adoption of advanced lubrication solutions. Growth is concentrated in major industrial regions, including Gujarat, Maharashtra, Tamil Nadu, and Karnataka, where manufacturing facilities and logistics hubs are implementing modern compressed-air systems with synthetic oil specifications for enhanced operational efficiency. Distribution channels through established lubricant distributors and OEM service networks expand deployment across automotive manufacturing, food processing, and general industrial applications. The country's Make in India initiative provides policy support for manufacturing modernization, including adoption of energy-efficient compressed-air technologies.
Key market factors:
In Guangdong, Jiangsu, Zhejiang, and Shandong, the adoption of advanced compressor oil systems is accelerating across manufacturing facilities and industrial complexes, driven by equipment modernization and stricter energy efficiency codes. The market demonstrates strong growth momentum with a CAGR of 6.5% through 2035, linked to comprehensive manufacturing sector upgrades and increasing focus on operational efficiency solutions. Chinese manufacturers are implementing OEM-approved synthetic oils and extended drain interval programs to enhance equipment reliability while meeting growing demand for cost-effective compressed-air system operations in domestic and export-oriented manufacturing. The country's industrial policy focus creates constant demand for premium compressor oils, while increasing adoption of international quality standards drives development of advanced lubrication programs.
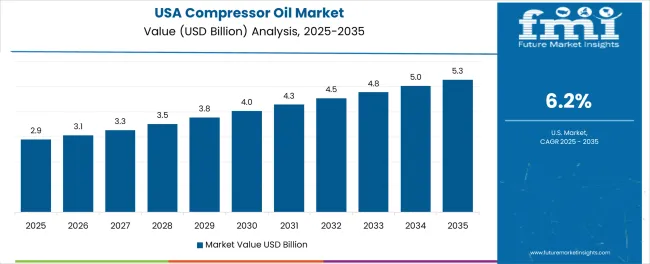
The U.S. market leads in advanced synthetic oil adoption based on integration with factory modernization programs and sophisticated maintenance practices for optimized equipment performance. The country shows solid potential with a CAGR of 6.2% through 2035, driven by manufacturing renaissance initiatives and industrial energy efficiency programs across major production regions, including the Midwest, Southeast, Texas, and California. American manufacturers are adopting extended drain interval synthetic oils for total cost reduction and equipment reliability enhancement, particularly in facilities with continuous-duty compressor operations requiring maximum uptime. Technology deployment channels through established distributor networks and OEM technical service programs expand coverage across diverse industrial applications.
Leading market segments:
Japan's advanced industrial infrastructure demonstrates sophisticated implementation of premium compressor oil systems, with documented case studies showing significant operational cost improvements through synthetic oil adoption in precision manufacturing applications. The country's manufacturing facilities in major industrial centers, including Kanto, Kansai, Chubu, and Kyushu, showcase integration of high-performance synthetic oils with existing precision compressed-air systems, leveraging expertise in quality management and continuous improvement methodologies. Japanese manufacturers prioritize cleanliness standards and equipment reliability, creating demand for premium synthetic oils that support clean room operations and stringent quality requirements. The market maintains steady growth through focus on automation integration and operational excellence, with a CAGR of 4.6% through 2035.
Key development areas:
Germany's market expansion is driven by diverse industrial demand, including automotive manufacturing in Baden-Württemberg, process industries in North Rhine-Westphalia, and food & pharmaceutical production across multiple regions requiring stringent compressed-air quality standards. The country demonstrates promising growth potential with a CAGR of 4.4% through 2035, supported by Industrie 4.0 initiatives and comprehensive energy efficiency programs. German manufacturers face implementation dynamics related to strict purity requirements and low-leakage system specifications, driving adoption of premium synthetic oils with superior separation characteristics and minimal carryover. Growing energy cost pressures and ecofriendly requirements create compelling business cases for advanced lubrication solutions, particularly in facilities where compressed-air quality directly impacts product quality and regulatory compliance.
Market characteristics:
The Brazil market shows solid advancement in aftermarket service penetration and process industries expansion supporting compressor oil adoption. The country demonstrates growth potential with a CAGR of 4.2% through 2035, driven by industrial modernization programs and utilities sector expansion across major industrial regions, including São Paulo, Minas Gerais, Rio Grande do Sul, and Bahia. Brazilian operators are adopting improved maintenance practices and synthetic oil upgrades to enhance equipment reliability while managing operational costs in challenging economic conditions. Technology deployment channels through established distributors and growing technical service networks expand coverage across manufacturing and process industries applications.
Leading market segments:
In England, Scotland, Wales, and Northern Ireland, industrial facilities are implementing advanced compressor oil solutions to enhance operational efficiency and meet stringent energy performance standards, with documented case studies showing significant energy cost reductions through synthetic oil adoption. The market shows moderate growth potential with a CAGR of 4.1% through 2035, linked to efficiency standard implementation, data center HVAC-R expansion, and OEM-oil co-development programs. British operators are adopting premium synthetic oils and comprehensive maintenance programs to optimize equipment performance while maintaining compliance with environmental and energy efficiency regulations. The country's established industrial sector creates steady demand for advanced lubrication solutions that integrate with existing equipment modernization initiatives.
Market development factors:
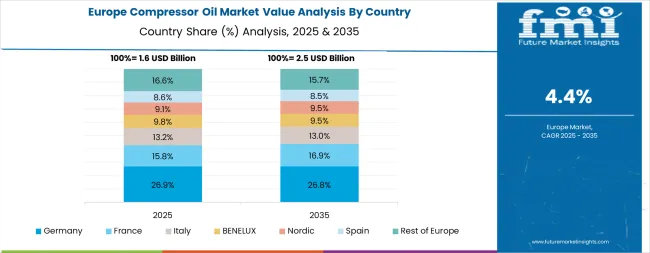
The compressor oil market in Europe is projected to grow from USD 2.0 billion in 2025 to USD 3.1 billion by 2035, registering a CAGR of 4.5% over the forecast period. Germany is expected to maintain its leadership position with a 22.0% market share in 2025, declining slightly to 21.8% by 2035, supported by its extensive industrial manufacturing infrastructure and major automotive production facilities implementing Industrie 4.0 upgrades.
The United Kingdom follows with a 16.5% share in 2025, projected to reach 16.2% by 2035, driven by comprehensive factory modernization programs and data center HVAC-R expansion. France holds a 15.0% share in 2025, expected to maintain 15.2% by 2035 through ongoing efficiency programs in process industries and manufacturing sectors. Italy commands a 10.5% share, while Spain accounts for 7.8% in 2025. Nordic countries collectively hold 7.2% in 2025, expanding to 7.5% by 2035 through high-spec HVAC-R applications in cold climates. The Rest of Europe region maintains a 21.0% share, attributed to steady industrial operations across BENELUX countries and continuing modernization in Central and Eastern European manufacturing facilities.
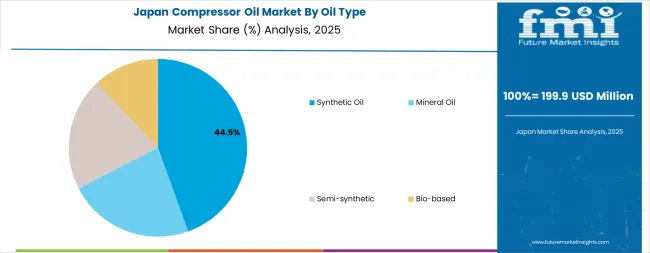
The Japanese market demonstrates a mature and quality-focused landscape, characterized by sophisticated integration of premium synthetic formulations with existing precision manufacturing infrastructure across electronics production facilities, automotive assembly plants, and clean room operations. Japan's focus on manufacturing excellence and equipment reliability drives demand for high-performance synthetic oils that support kaizen continuous improvement initiatives and total productive maintenance programs in world-class manufacturing operations. The market benefits from strong partnerships between international lubricant suppliers like ExxonMobil, Shell, and FUCHS Petrolub, and domestic industrial operators, creating comprehensive technical service ecosystems that prioritize equipment uptime and operational efficiency optimization. Manufacturing centers in Tokyo, Osaka, Nagoya, and other major industrial areas showcase advanced condition monitoring implementations where synthetic oils achieve extended drain intervals through integrated oil analysis programs.
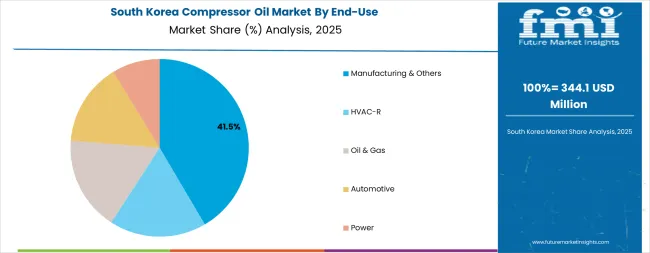
The South Korean market is characterized by strong OEM relationships, with companies like ExxonMobil, Shell, and FUCHS Petrolub maintaining significant positions through comprehensive technical support and product approvals for leading compressor manufacturers including Samsung, LG, and other major industrial conglomerates. The market is demonstrating growing focus on energy efficiency and extended maintenance intervals, as Korean manufacturers increasingly demand synthetic formulations that integrate with advanced compressed-air management systems and IoT-enabled condition monitoring platforms deployed across semiconductor, automotive, and electronics manufacturing facilities. Local lubricant distributors and regional technical service providers are gaining market share through strategic partnerships with global suppliers, offering specialized services including oil analysis programs and customized lubrication solutions. The competitive landscape shows increasing collaboration between multinational oil companies and Korean industrial operators, creating hybrid service models that combine international technical expertise with local manufacturing knowledge and responsive technical support capabilities.
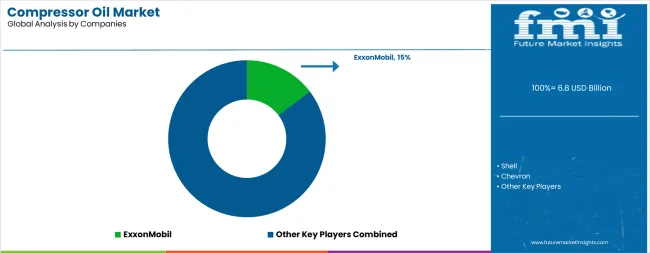
The market features approximately 15-20 meaningful players with moderate concentration, where the top five companies control roughly 50-58% of global market share through established OEM relationships, comprehensive product portfolios, and extensive technical service networks. Competition centers on OEM approvals, synthetic formulation capabilities, and technical support rather than price competition alone.
Market leaders include ExxonMobil (15% market share), Shell, and Chevron, which maintain competitive advantages through comprehensive synthetic product lines, global OEM approval portfolios, and deep expertise in industrial lubrication and technical service, creating high switching costs for customers requiring certified products. These companies leverage research and development capabilities and ongoing technical support relationships to defend market positions while expanding into adjacent industrial applications.
Challengers encompass TotalEnergies, BP, and FUCHS Petrolub SE, which compete through specialized synthetic formulations and strong regional presence in key industrial markets. Technology specialists, including Quaker Houghton and regional suppliers, focus on specific application segments or vertical markets, offering differentiated capabilities in custom formulations, oil analysis services, and localized technical support.
Regional players and emerging suppliers create competitive pressure through cost-effective solutions and rapid technical response capabilities, particularly in high-growth markets including China and India, where local presence provides advantages in customer service and application support. Market dynamics favor companies that combine advanced synthetic technologies with comprehensive OEM approval programs and technical service offerings that address the complete lubrication lifecycle from product selection through condition monitoring and drain interval optimization.
Compressor oils represent specialized lubrication solutions that enable industrial operators to achieve 2-3 times longer equipment service intervals compared to mineral oils, delivering superior operational efficiency and equipment protection with extended drain capabilities of 8,000-12,000 hours in demanding applications. With the market projected to grow from USD 6.8 billion in 2025 to USD 11.5 billion by 2035 at a 5.4% CAGR, these advanced lubrication systems offer compelling advantages - extended maintenance intervals, reduced energy consumption, and enhanced equipment reliability - making them essential for manufacturing & others applications (40.0% market share), HVAC-R systems (19.0% share), and oil & gas operations seeking alternatives to conventional mineral oils that compromise equipment life through oxidation and deposit formation. Scaling market adoption and technology advancement requires coordinated action across energy policy, industrial standards development, lubricant manufacturers, end-user industries, and technical service infrastructure.
How Governments Could Spur Local Production and Adoption?
How Industry Bodies Could Support Market Development?
How OEMs and Technology Players Could Strengthen the Ecosystem?
How Suppliers Could Navigate the Shift?
How Investors and Financial Enablers Could Unlock Value?
| Item | Value |
|---|---|
| Quantitative Units | USD 6.8 billion |
| Oil Type | Synthetic Oil, Mineral Oil, Semi-synthetic, Bio-based |
| End-Use | Manufacturing & Others, HVAC-R, Oil & Gas, Automotive, Power |
| Compressor Type | Air (Rotary Screw, Reciprocating, Centrifugal, Vane & Axial), Refrigeration (Screw, Scroll, Reciprocating) |
| Regions Covered | Asia Pacific, Europe, North America, Latin America, Middle East & Africa |
| Country Covered | India, China, United States, Japan, Germany, Brazil, United Kingdom, and 40+ countries |
| Key Companies Profiled | ExxonMobil, Shell, Chevron, TotalEnergies, BP, FUCHS Petrolub SE, Quaker Houghton, Valvoline, Phillips 66, Sinopec |
| Additional Attributes | Dollar sales by oil type, end-use, and compressor type categories, regional adoption trends across Asia Pacific, Europe, and North America, competitive landscape with lubricant suppliers and OEM partnerships, technical service requirements and specifications, integration with energy efficiency initiatives and maintenance programs, innovations in synthetic formulation technology and extended drain capabilities, and development of condition monitoring solutions with performance optimization capabilities. |
The global compressor oil market is estimated to be valued at USD 6.8 billion in 2025.
The market size for the compressor oil market is projected to reach USD 11.5 billion by 2035.
The compressor oil market is expected to grow at a 5.4% CAGR between 2025 and 2035.
The key product types in compressor oil market are synthetic oil, mineral oil, semi-synthetic and bio-based.
In terms of end-use, manufacturing & others segment to command 40.0% share in the compressor oil market in 2025.


Our Research Products

The "Full Research Suite" delivers actionable market intel, deep dives on markets or technologies, so clients act faster, cut risk, and unlock growth.

The Leaderboard benchmarks and ranks top vendors, classifying them as Established Leaders, Leading Challengers, or Disruptors & Challengers.

Locates where complements amplify value and substitutes erode it, forecasting net impact by horizon

We deliver granular, decision-grade intel: market sizing, 5-year forecasts, pricing, adoption, usage, revenue, and operational KPIs—plus competitor tracking, regulation, and value chains—across 60 countries broadly.

Spot the shifts before they hit your P&L. We track inflection points, adoption curves, pricing moves, and ecosystem plays to show where demand is heading, why it is changing, and what to do next across high-growth markets and disruptive tech

Real-time reads of user behavior. We track shifting priorities, perceptions of today’s and next-gen services, and provider experience, then pace how fast tech moves from trial to adoption, blending buyer, consumer, and channel inputs with social signals (#WhySwitch, #UX).

Partner with our analyst team to build a custom report designed around your business priorities. From analysing market trends to assessing competitors or crafting bespoke datasets, we tailor insights to your needs.
Supplier Intelligence
Discovery & Profiling
Capacity & Footprint
Performance & Risk
Compliance & Governance
Commercial Readiness
Who Supplies Whom
Scorecards & Shortlists
Playbooks & Docs
Category Intelligence
Definition & Scope
Demand & Use Cases
Cost Drivers
Market Structure
Supply Chain Map
Trade & Policy
Operating Norms
Deliverables
Buyer Intelligence
Account Basics
Spend & Scope
Procurement Model
Vendor Requirements
Terms & Policies
Entry Strategy
Pain Points & Triggers
Outputs
Pricing Analysis
Benchmarks
Trends
Should-Cost
Indexation
Landed Cost
Commercial Terms
Deliverables
Brand Analysis
Positioning & Value Prop
Share & Presence
Customer Evidence
Go-to-Market
Digital & Reputation
Compliance & Trust
KPIs & Gaps
Outputs
Full Research Suite comprises of:
Market outlook & trends analysis
Interviews & case studies
Strategic recommendations
Vendor profiles & capabilities analysis
5-year forecasts
8 regions and 60+ country-level data splits
Market segment data splits
12 months of continuous data updates
DELIVERED AS:
PDF EXCEL ONLINE
PAG Compressor Oil Market Size and Share Forecast Outlook 2025 to 2035
Demand for Compressor Oils in EU Size and Share Forecast Outlook 2025 to 2035
Oily Waste Can Market Size and Share Forecast Outlook 2025 to 2035
Oil and Gas Seal Market Size and Share Forecast Outlook 2025 to 2035
Oil Coalescing Filter Market Size and Share Forecast Outlook 2025 to 2035
Oil-immersed Iron Core Series Reactor Market Size and Share Forecast Outlook 2025 to 2035
Oil and Gas Sensor Market Forecast Outlook 2025 to 2035
Oil Packing Machine Market Forecast and Outlook 2025 to 2035
Oil and Gas Pipeline Coating Market Forecast and Outlook 2025 to 2035
Oilfield Scale Inhibitor Market Size and Share Forecast Outlook 2025 to 2035
Oil-in-Water Anionic Emulsifier Market Size and Share Forecast Outlook 2025 to 2035
Oil and Gas Field Services Market Size and Share Forecast Outlook 2025 to 2035
Oil Control Shampoo Market Size and Share Forecast Outlook 2025 to 2035
Oil Expellers Market Size and Share Forecast Outlook 2025 to 2035
Oilfield Stimulation Chemicals Market Size and Share Forecast Outlook 2025 to 2035
Oiler Kits Market Size and Share Forecast Outlook 2025 to 2035
Oil Pressure Sensor Market Size and Share Forecast Outlook 2025 to 2035
Oil Filled Power Transformer Market Size and Share Forecast Outlook 2025 to 2035
Oily Skin Control Products Market Analysis - Size and Share Forecast Outlook 2025 to 2035
Oil Immersed Shunt Reactor Market Size and Share Forecast Outlook 2025 to 2035

Thank you!
You will receive an email from our Business Development Manager. Please be sure to check your SPAM/JUNK folder too.
Chat With
MaRIA