Quiet Air Compressor MarketSize and Share Forecast Outlook 2025 to 2035

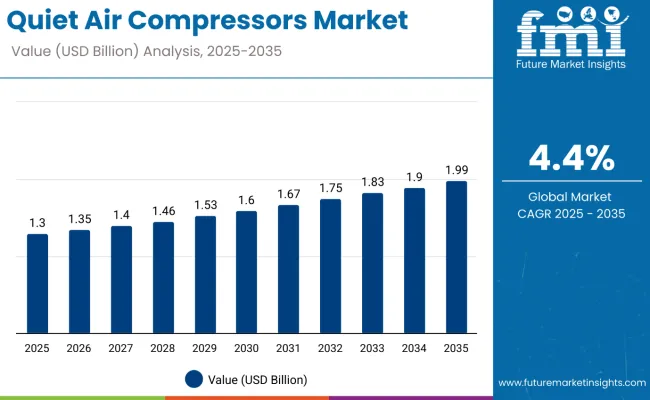
The global quiet air compressors market is projected to grow from USD 1.30 billion in 2025 to USD 1.99 billion by 2035, registering a CAGR of 4.4% during the forecast period.
Quick Stats For Quiet Air Compressors Market

  • Industry Value (2025): USD 1.3 Billion
  • Forecast Value (2035): USD 1.99 Billion
  • Forecast CAGR: 4.4%
  • Leading Segment (2025): Portable Quiet Air Compressors (68% share)
  • Key Growth End Use: Auto Service Centers (26% share)
  • Top Key Players: Atlas Copco, Ingersoll Rand, Sullair, Kaeser, Jun-Air, California Air Tools, Emax Compressor, Werther Int.

Quiet Air Compressors

Metric Value
Industry Size (2025E) USD 1.3 billion
Industry Value (2035F) USD 1.99 billion
CAGR (2025 to 2035) 4.4%

This reflects an absolute increase of USD 690 million and a value expansion of nearly 1.53X over the decade. The market has gained prominence due to the rising need for low-noise compressed air systems in residential, healthcare, and light industrial environments where operational silence and compliance with occupational safety norms are critical.

Between 2025 and 2030, the market is expected to increase from USD 1.30 billion to USD 1.60 billion, driven by higher adoption of oil-free and scroll-type compressors in indoor workspaces, laboratories, and dental clinics. Demand is also rising in multi-family housing and home workshops where space optimization and noise control remain essential criteria. Integration of inverter-driven motors and vibration-reduction enclosures is also contributing to the shift toward premium, quiet models.

From 2030 to 2035, the market is anticipated to grow from USD 1.60 billion to USD 1.99 billion. This phase will likely benefit from widespread deployment in urban retrofit projects, smart buildings, and hybrid work environments that prioritize air quality, minimal acoustic interference, and efficient HVAC operations. Global regulations around permissible decibel levels in workplace environments are expected to further stimulate adoption across commercial sectors.

From 2020 to 2024, the quiet air compressors market expanded steadily, driven by increasing demand in medical facilities, electronics manufacturing plants, and food processing industries, where noise reduction is crucial for worker comfort and compliance.

During this period, the market value increased from nearly USD 1 billion in 2020 to USD 1.2 billion in 2024, reflecting consistent adoption across both developed and emerging economies. Growth was further supported by health and safety regulations in Europe and East Asia, as well as by the adoption of oil-free, low-maintenance units in the healthcare and dental sectors.

The industry landscape during this time was dominated by portable configurations, which accounted for 68% of sales in 2024, supported by strong uptake in small workshops, mobile service vans, and home-based maintenance operations. These models gained favor due to their lightweight build, mobility, and ease of storage, enabling a wider penetration in the DIY and SME segments. Market participation was led by established industrial equipment manufacturers leveraging authorized distributor networks, after-sales service packages, and region-specific product certifications to gain trust in highly regulated industries.

By 2025, the market is estimated to reach a valuation of USD 1.3 billion. This transition is being influenced by the rising preference for 1.1 to 5 HP capacity models in industrialized countries, improvements in energy efficiency ratings, and the integration of vibration-dampening technology to comply with occupational health standards.

As industries continue to prioritize quiet, efficient, and mobile compressed air systems, demand is gradually shifting toward units that combine low-noise operation, ergonomic handling, and low maintenance cycles. The 2025 baseline is set to serve as a springboard for more rapid growth, particularly as the sector aligns with urban noise ordinances and green building codes in major markets across Europe and Asia-Pacific.

Why the Quiet Air Compressors Market is Growing?

The growth of the quiet air compressors market is being driven by multiple converging factors, including tightening workplace noise regulations, expansion of noise-sensitive industrial applications, and technological advances in oil-free and energy-efficient compressor designs. Manufacturers have introduced low-decibel rotary screw models, vibration-reduction frameworks, and automated pressure control systems that extend product life, enhance operator comfort, and reduce maintenance downtime, thus improving cost efficiency for industrial users in regions with high labor costs.

The surge in urban redevelopment projects and precision manufacturing facilities has reinforced the need for noise-compliant compressed air solutions. Quiet air compressors are increasingly integrated into dental surgeries, electronics assembly plants, and automotive service centers where excessive noise can disrupt operations or breach legal limits. Product demand is also being influenced by the shift toward multi-purpose, modular air systems that can be adapted for both industrial-scale operations and mobile service applications.

Consumer-driven segments such as home renovation, craftsmanship studios, and DIY mechanical work are contributing to the expansion of compact, lightweight quiet compressor units. Growth in e-commerce distribution channels and targeted digital marketing campaigns is enhancing product visibility among non-professional users, particularly in North America and Western Europe.

Compliance with OSHA, EU occupational safety directives, and Asia-Pacific urban noise control policies is encouraging the adoption of compressors with integrated acoustic enclosures and oil-free operation. Combined with improved motor efficiency and portable designs, these advancements are positioning quiet air compressors as the preferred option across sectors ranging from automotive refinishing in South Korea to electronics manufacturing in Japan.

Segmentation Overview

The market is segmented by capacity into units ranging from up to 1 HP, 1.1 to 5 HP, 5.1 to 10 HP, and above 10 HP, reflecting differing usage intensities across industries. End-use industries include auto service centers, residential, construction, healthcare, woodworking, manufacturing, and others, covering both commercial and home applications. Configuration-wise, the market comprises portable and stationary compressors, addressing mobility needs and fixed installations respectively. This segmentation enables targeted product development and demand analysis across industrial, residential, and service-based use cases.
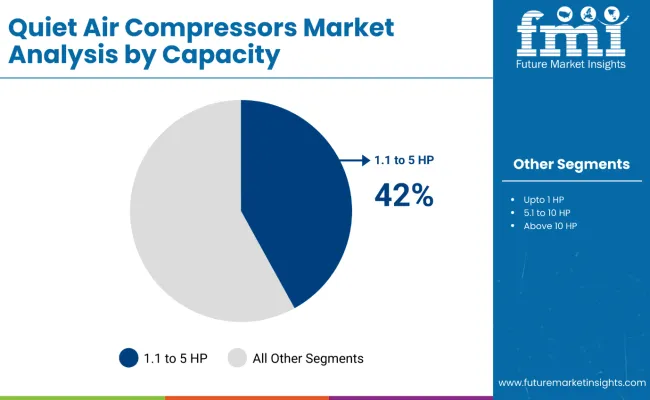
Mid-range compressors up to 5 HP represent the primary capacity segment

Quiet Air Compressors By Capacity

Compressors with 1.1 to 5 HP capacity are estimated to contribute 42% of global market revenue in 2025 and are projected to grow at a CAGR of 4.6% through 2035. These systems offer a balance between power and noise suppression, making them suitable for small-to-medium workshops, commercial garages, and light industrial tasks. Their quieter operation is achieved through low RPM motors, advanced enclosure design, and vibration dampening technologies. The segment is witnessing higher adoption across sectors like automotive repair, light-duty manufacturing, and residential garages where noise regulations or indoor usage are key considerations.
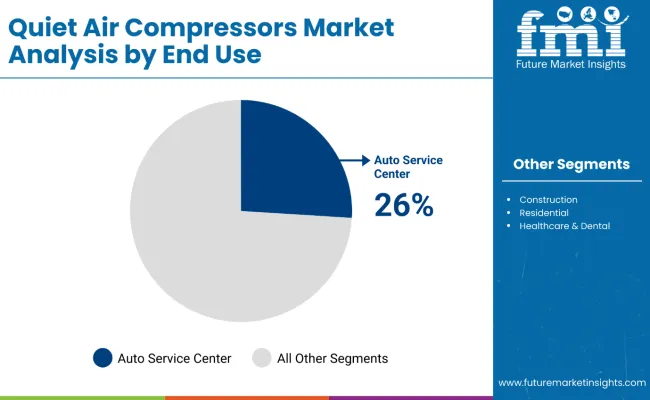
Auto service centers continue to lead end-use demand

Quiet Air Compressors By End Use

Auto service centers are projected to account for 26% of market value in 2025 and are likely to grow at a CAGR of 4.3% through 2035. Quiet compressors are increasingly preferred for tasks like tire inflation, spray painting, pneumatic tool operation, and lift systems in enclosed garages. With rising vehicle maintenance volumes and stricter workplace noise norms, garages and workshops are upgrading to low-noise systems to improve technician comfort and customer experience. Integration of oil-free compressors and soundproof housing in automotive service environments further reinforces demand for this end-use segment.
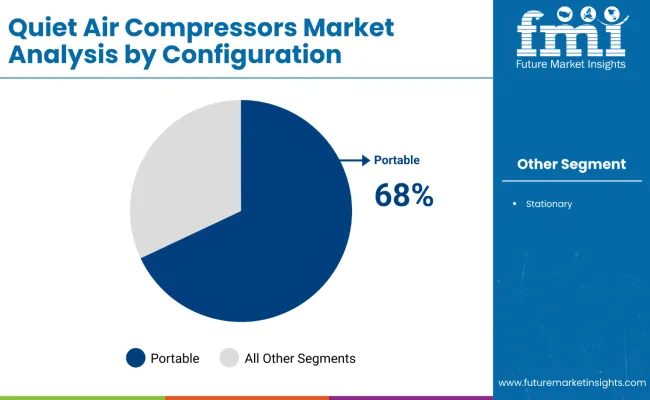
Portable models dominate due to flexibility and ease of deployment

Quiet Air Compressors By Configuration

Portable compressors are expected to capture 68% of total market share in 2025 and grow at a CAGR of 4.7% through 2035. Their lightweight construction, compact form factor, and wheel-mounted designs support usage across varied work environments such as homes, construction sites, and mobile repair services. Technological advances have enabled quieter operation even in portable variants by using insulated motor housings and dual-piston configurations. These compressors are increasingly used by professionals requiring mobility without compromising on low decibel performance.

Key Trends Shaping the Quiet Air Compressors Market

Demand for angle sanders is being supported by rising demand from noise-sensitive applications, shift toward oil-free and smart-enabled models, and emphasis on regulatory compliance and urban noise reduction.

Rising Demand from Noise-Sensitive Applications

The quiet air compressors market is being propelled by its expanding role in medical, electronics, and precision manufacturing sectors. Hospitals, dental clinics, and laboratory environments require low-decibel, vibration-free air supply to maintain sterile and comfortable conditions. In Germany, these units are increasingly adopted in medical technology production and pharmaceutical packaging facilities, where noise pollution can disrupt sensitive processes.

Shift Toward Oil-Free and Smart-Enabled Models

Oil-free compressor adoption is accelerating due to strict environmental regulations and the need to avoid contamination in industries such as food & beverage and pharmaceuticals. Japan’s electronics industry is a prime example, integrating oil-free rotary screw units with real-time pressure monitoring sensors for energy optimization and process reliability.

Emphasis on Regulatory Compliance and Urban Noise Reduction

Regulations in Europe (e.g., Directive 2003/10/EC) and local Asian ordinances are setting stricter noise limits, pushing end users to upgrade equipment. In China, urban redevelopment projects often mandate low-noise construction equipment, creating demand for quiet compressors in both construction support and building maintenance services.

Europe Market Split by Country

Countries Share (2025)
Germany 26%
Italy 14%
France 16%
UK 12%
Spain 8%
BENELUX 3%
Russia 9%
Rest of Europe 12%
Countries Share (2035)
Germany 25%
Italy 12%
France 15%
UK 14%
Spain 9%
BENELUX 3%
Russia 11%
Rest of Europe 11%

Europe’s quiet air compressors market is set to grow steadily, reaching USD 634.9 million by 2035, up from USD 386.1 million in 2025. This growth is attributed to rising environmental compliance across industrial hubs, especially in noise-sensitive zones such as healthcare, research labs, and precision manufacturing facilities. Germany continues to lead the regional market, supported by strong engineering exports and automation adoption in automotive and electronics sectors.

The UK is projected to witness share gain by 2035, aided by increased adoption in commercial renovation and energy-efficient HVAC systems. Russia is expected to gain share due to infrastructure modernization and localized production initiatives. In contrast, Italy is projected to see a slight decline in share owing to capacity rationalization in legacy industries.

Europe’s demand for quiet air compressors is anchored in compliance-driven replacements, energy-efficiency retrofits, and noise-sensitive operations across healthcare, food & beverage, and precision engineering. While Western Europe shows mature, replacement-led demand, Southern and parts of Eastern Europe are gaining share as manufacturing footprints expand and public procurement programs fund equipment upgrades. Oil-free rotary screw platforms and portable, acoustically enclosed units remain the winning configurations due to their hygiene, reliability, and low dB(A) profiles in mixed-use urban settings.
  • Germany (lead market, maturing but high-spec): Precision machining, automotive Tier-1/Tier-2, and med-tech packaging lines favor oil-free rotary screw systems with acoustic shrouds and DIN/EU noise compliance. Focus is on predictive maintenance (IoT) to reduce downtime in multi-shift plants.
  • United Kingdom (steady growth, mixed pro/DIY): Infrastructure renewals and a strong pro-trades ecosystem push portable, oil-free units for indoor refurbishment; tool leasing and compliance bundles (sound testing + service) drive SME adoption.
  • France (hygiene-critical growth pockets): Aerospace (Toulouse) and hospital networks (Île-de-France) adopt low-vibration, oil-free units to maintain sterile environments and support cleanroom-adjacent workflows.
  • Italy (food & pharma pull-through): HACCP/GMP pressures in food processing and pharma packaging sustain demand for oil-free, dry air with certified purity; ports and machinery clusters add portable units for maintenance bays.
  • Spain (share gainer): Catalonia’s automotive base and tourism-led refurbishment create pull for quiet, portable compressors on constrained urban sites and in hotel/venue retrofits.
  • Nordics (efficiency-first): Public procurement favors IE3/IE4 motors, heat recovery, and low dB(A); hospitals and labs expand oil-free fleets to meet acoustic and carbon goals.
  • BENELUX (pharma/chemicals & logistics): Clean manufacturing and large logistics hubs choose oil-free with advanced filtration; enclosed facilities prioritize very low noise and remote monitoring.
  • CEE (Poland, Czechia, Slovakia; rising): Supplier parks for autos/electronics invest in cost-efficient, quiet platforms; EU funds catalyze upgrades from legacy piston models.

Key Countries Growth Outlook

Quiet Air Compressors By Country

India’s rapid industrialization is boosting demand for low-noise compressors

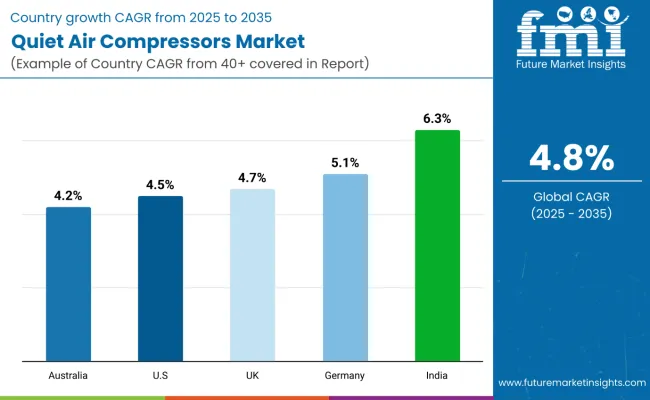
India leads the market with a projected CAGR of 6.3% from 2025 to 2035. The growth is driven by infrastructure upgrades, electronics manufacturing, and the government’s ‘Make in India’ push. Urban construction norms around noise reduction are also supporting demand.
  • Expanding SME and MSME sectors increasing adoption of compact air systems
  • Government incentives on clean, energy-efficient machinery
  • Noise regulations encouraging use in hospitals and institutions
  • Surge in electronics and auto parts manufacturing with pneumatic tools
  • Local OEMs offering cost-effective silent compressor models

Service & Maintenance Networks Strengthening Quiet Compressor Demand in the United States

Quiet Air Compressors USA

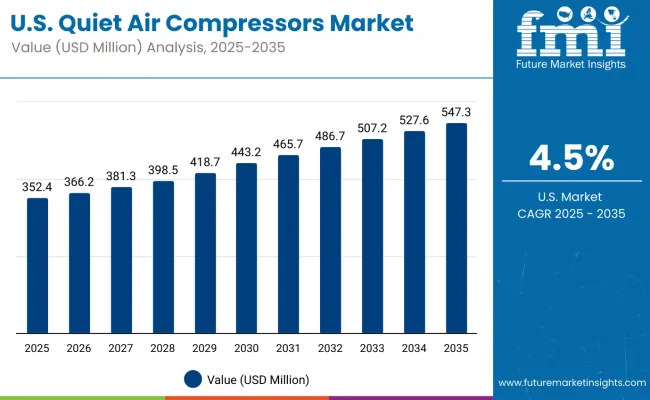
The USA quiet air compressors market is projected to grow at a CAGR of 4.5% from 2025 to 2035, driven by strong demand from auto service centers, industrial maintenance teams, and construction service providers. OSHA’s stringent noise exposure limits are accelerating the shift from traditional compressors to low-decibel, oil-free portable models in both large repair chains and municipal maintenance operations.

The automotive aftermarket remains a core demand driver, especially with the growth of electric vehicle (EV) service facilities requiring air systems for tire inflation, brake system servicing, and precision pneumatic tools in quieter service bays. Aerospace and defense manufacturing hubs in states such as Texas and Washington are also adopting 1.1 to 5 HP oil-free rotary screw models to ensure compliance with workplace safety rules while maintaining high air delivery rates.

In the residential and DIY segment, portable units with vibration reduction and compact storage designs are increasingly popular through big-box retailers like Home Depot and Lowe’s, as well as via e-commerce platforms serving rural mechanics and small workshops.

  • Portable, oil-free models preferred for compliance with OSHA noise limits.
  • EV service centers and aerospace hubs are key growth segments.
  • DIY adoption supported by big-box retail and e-commerce sales.
  • Buy American Act favors domestic brands like Ingersoll Rand and Senco.

Compact Workspace Requirements Driving Japan’s Quiet Compressor Choices

Japan’s quiet air compressors market is forecast to grow at a CAGR of 4.1% from 2025 to 2035, shaped by high-density urban manufacturing and service environments. The country’s preference for compact, low-vibration compressors is influenced by workshop space constraints and strict local noise ordinances.

The 1.1 to 5 HP capacity range dominates, holding up to 45% market share in 2025, balancing portability with sufficient air delivery for automotive repair, dental clinics, and electronics assembly lines. In precision manufacturing sectors such as robotics and semiconductors, oil-free rotary screw compressors are integrated into production lines to maintain cleanroom standards while keeping noise below industrial thresholds.

Shipbuilding yards in Nagasaki and Yokohama are replacing older models with quiet, portable units to reduce noise exposure during enclosed dock maintenance. Healthcare facilities increasingly opt for oil-free piston compressors for patient comfort, particularly in pediatric care.

  • 1.1 to 5 HP range dominates, especially in precision manufacturing.
  • Noise-compliant designs vital for urban and mixed-use districts.
  • Strong adoption in robotics, electronics, and dental sectors.
  • Energy efficiency incentives under Top Runner Program drive replacements.

Home Renovation Trends and Infrastructure Work Supporting UK Market Growth

The UK quiet air compressors market is projected to grow at a CAGR of 4.7% from 2025 to 2035, supported by infrastructure renewal programs, a thriving home improvement sector, and increasing compliance with workplace noise limits.

Projects such as railway modernization and energy facility retrofits create demand for portable units capable of operating in noise-sensitive zones. The UK’s active DIY culture boosts sales of compact portable compressors through hardware retailers and online platforms. Tradespeople in urban areas are choosing oil-free units for indoor work, reducing sound disturbance in occupied buildings.

Short-term leasing of portable compressors is also rising, especially in metropolitan regions where small contractors prefer flexible, cost-effective access to professional-grade equipment.

  • Infrastructure projects drive heavy-duty portable compressor demand.
  • DIY and tradesperson adoption growing in urban centers.
  • Leasing models expanding in London, Manchester, and Birmingham.
  • Compliance with Control of Noise at Work Regulations spurs upgrades.

Germany’s Precision Manufacturing and Compliance Standards Boost Adoption

Germany’s quiet air compressors market is expected to grow at a CAGR of 5.1% through 2035, led by precision engineering, automotive component manufacturing, and medical equipment production. The adoption of oil-free rotary screw models is accelerating due to strict DIN-compliant noise control requirements and an emphasis on workplace ergonomics.

Automotive OEMs and Tier-1 suppliers in Stuttgart and Wolfsburg are replacing older models with low-vibration, energy-efficient units to enhance worker comfort and reduce noise emissions. Precision machining facilities in Bavaria and Baden-Württemberg are also integrating quiet compressors to reduce acoustic interference across production cells.

The medical technology sector favors oil-free piston compressors for sterile and quiet operation, with government-backed industrial retrofit subsidies encouraging wider SME adoption.

  • DIN and EU standards drive adoption of low-noise, oil-free models.
  • Automotive OEMs and Tier-1 suppliers prioritize energy-efficient upgrades.
  • Precision machining and CNC operations integrate quiet air systems.
  • Subsidies support SME investment in noise-compliant equipment.

Infrastructure Projects and Service Industry Growth Powering Australia’s Quiet Compressor Market

Australia’s quiet air compressors market is projected to grow at a CAGR of 4.2% from 2025 to 2035, supported by large-scale infrastructure upgrades, the expansion of mining and energy projects, and increasing adoption in the automotive service sector. Ongoing urban development in Sydney, Melbourne, and Brisbane is driving demand for portable, low-noise compressors that can operate in compliance with strict municipal noise ordinances, particularly near residential zones.

In the mining-heavy regions of Western Australia and Queensland, quiet compressors are being deployed in on-site maintenance workshops to reduce operator fatigue and meet occupational health requirements in enclosed workspaces. The automotive repair market is another growth driver, with service chains and independent garages investing in oil-free rotary screw models to handle pneumatic tools while keeping noise levels low for both staff and customers.

Australia’s strong DIY and home improvement culture also sustains demand for compact portable units, with sales channels dominated by national hardware retailers such as Bunnings Warehouse and Mitre 10. Additionally, renewable energy facilities, particularly wind and solar farms are increasingly using quiet compressors for maintenance operations in remote areas, where equipment reliability and low-noise operation are critical.

  • Urban construction projects require portable, noise-compliant compressors.
  • Mining sector adopting quiet models for worker safety in enclosed sites.
  • Automotive repair market shifting toward oil-free rotary screw units.
  • DIY and home improvement culture supports retail sales through major hardware chains.
  • Renewable energy sites use quiet compressors for remote maintenance work.

End-Use Analysis of the Quiet Air Compressors Market in Japan

The quiet air compressors market in Japan is projected to demonstrate stable growth through 2035, with demand largely concentrated in 1.1 to 5 HP capacities, which account for 45% of the total market share in 2025. Japan’s end-use mix reflects dense urban footprints, precision manufacturing, and patient-facing environments.

Workshops must fit compressors into small footprints and keep dB(A) low to respect neighborhood ordinances. The 1.1-5 HP capacity band leads due to the balance of airflow, portability, and energy draw, aligning with bay-by-bay deployment in auto repair and light industrial cells.

  • 1.1-5 HP platforms dominate compact workshops and bay-level deployment.
  • Oil-free technology is standard for clinical, electronics, and clean zones.
  • IoT monitoring spreads across factory cells for uptime and energy control.
  • Urban ordinances keep acoustic performance a top-3 purchase criterion.

Application-Based Outlook for the Quiet Air Compressors Market in South Korea

The South Korean angle sander market is driven by auto service centers and residential end use, which together represent 54% of the total end use share in 2025. Mobile and bay-based jobs favor compact, portable compressors with fast start/stop, low vibration, and sub-60-65 dB(A) operation to keep multi-bay workflows productive without hearing fatigue.
  • Automotive service centers are the largest end-use segment in South Korea at 31% share in 2025.
  • Construction activity is fueled by large-scale redevelopment projects in Seoul and Busan, where portable, low-noise compressors are needed to meet strict urban noise ordinances.
  • Residential demand is increasing as high-rise homeowners invest in compact compressors for balcony workshops and small-space DIY setups.
  • Healthcare and dental adoption is driven by South Korea’s advanced private clinic sector, where patient comfort and hygiene are critical.

Competition Outlook

Quiet Air Compressors By Company

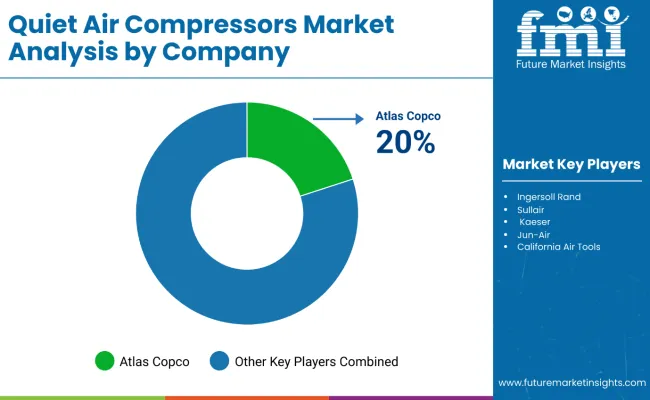
The quiet air compressors market is increasingly competitive, with global and regional manufacturers expanding their oil-free, portable, and energy-efficient product portfolios to capture rising demand from noise-sensitive applications. Leading companies are focusing on innovation in motor efficiency, acoustic dampening, and IoT integration to differentiate their offerings in both professional and consumer segments.

Atlas Copco and KaeserKompressoren dominate in high-performance industrial applications, leveraging strong dealer networks and after-sales service programs. Ingersoll Rand and Hitachi Industrial Equipment maintain strong positions in both the automotive service and manufacturing sectors, emphasizing oil-free rotary screw models for clean air delivery.

Smaller players, such as Senco and regional brands in Asia-Pacific, are gaining traction in portable compressor sales by offering competitively priced units through online and retail channels. Domestic brands in China are aggressively expanding into mid-tier industrial markets, while Australian and European distributors are promoting noise-compliant models to meet local regulations.

Strategic collaborations with tool manufacturers, bundling compressors with pneumatic tools, and offering financing or leasing options are becoming common competitive tactics. Additionally, compliance with ISO 8573-1 air quality standards and alignment with regional noise legislation are central to winning contracts in sectors such as healthcare, food processing, and precision engineering.

  • In March 2025, Atlas Copco launched its new GA VSDs oil-free rotary screw compressor series, featuring advanced variable speed drives, noise levels under 62 dB(A), and a 15% improvement in energy efficiency compared to previous models. These are targeted at electronics manufacturing and food processing facilities in Europe and Asia-Pacific.
  • In February 2025,KaeserKompressoren introduced the CSDX series of quiet rotary screw compressors with integrated heat recovery systems, aimed at German and UK industrial plants seeking energy cost reductions alongside noise compliance.
  • In January 2025, Ingersoll Rand announced its expansion in the Australian market with a new distribution agreement to supply portable, oil-free models to mining maintenance operations in Western Australia and Queensland.
  • In November 2024, Hitachi Industrial Equipment unveiled an IoT-enabled monitoring platform for its range of quiet air compressors, offering real-time diagnostics and predictive maintenance alerts. The launch targeted Japanese SMEs in automotive repair and electronics manufacturing.
  • In October 2024,Senco released a new line of ultra-compact portable compressors for the North American DIY and light trade markets, featuring oil-free piston technology and noise levels below 60 dB(A). These units are positioned for retail distribution through home improvement chains and online marketplaces.

Companies

  • Atlas Copco
  • Ingersoll Rand
  • Sullair
  • Kaeser
  • Jun-Air
  • California Air Tools
  • Emax Compressor
  • Werther Int.

Report Scope

Item Value
Quantitative Units USD 463.6 Million (2025)
Capacity Upto 1 HP, 1.1 TO 5 hp, 5.1 to 10 HP, Above 10 HP
End Use Auto Service Centers, Construction, Residential, Healthcare & Dental, Woodworking, Manufacturing, Others
Configuration Portable, Stationary
Regions Covered North America, Europe, East Asia, South Asia & Pacific, Latin America, Middle East & Africa
Countries Covered United States, Germany, United Kingdom, Japan, China, France, Italy, South Korea, Spain, BENELUX
Key Companies Profiled Atlas Copco, Ingersoll Rand, Sullair, Kaeser, Jun-Air, California Air Tools, Emax Compressor, Werther Int.

Key Segments

By Capacity:

  • Upto 1 HP
  • 1.1 to 5 HP
  • 5.1 to 10 HP
  • Above 10 HP

By End Use:

  • Auto Service Centers
  • Construction
  • Residential
  • Healthcare & Dental
  • Woodworking
  • Manufacturing
  • Others

By Configuration:

  • Portable
  • Stationary

By Region:

  • North America
  • Latin America
  • Western Europe
  • Eastern Europe
  • East Asia
  • South Asia & Pacific
  • Middle East & Africa

Frequently Asked Questions

How big is the Quiet Air Compressors Market in 2025?

The global quiet air compressors market is estimated to be valued at USD 1.3 billion in 2025, supported by sustained demand from automotive service centers, healthcare facilities, and precision manufacturing sectors.

What will be the size of the Quiet Air Compressors Market in 2035?

The market is projected to reach approximately USD 2 billion by 2035, reflecting the growing preference for portable, oil-free, and noise-compliant compressors across industrial and residential applications.

What is the expected CAGR for the Quiet Air Compressors Market from 2025 to 2035?

The market is forecast to expand at a CAGR of 4.4% during this period, with growth driven by urban infrastructure projects, stricter noise regulations, and the expansion of healthcare and electronics manufacturing.

Which capacity range is expected to dominate the Quiet Air Compressors Market?

The 1.1 to 5 HP capacity range is expected to maintain the largest share in 2025, offering the best balance of power output, portability, and energy efficiency, with particularly high adoption in Japan and South Korea.

What is the leading end-use segment in the Quiet Air Compressors Market?

Auto service centers are projected to be the leading end-use segment in 2025, accounting for the largest share due to their reliance on quiet, reliable compressed air systems for multi-shift operations in urban environments.

Who are the key players in the global Quiet Air Compressors Market?

Key companies include Atlas Copco, Ingersoll Rand, Kaeser Kompressoren, Hitachi Industrial Equipment, Senco, California Air Tools, Emax Compressor, and Werther International.

Table of Content

  1. Executive Summary
    • Global Market Outlook
    • Demand-side Trends
    • Supply-side Trends
    • Technology Roadmap Analysis
    • Analysis and Recommendations
  2. Market Overview
    • Market Coverage / Taxonomy
    • Market Definition / Scope / Limitations
  3. Market Background
    • Market Dynamics
      • Drivers
      • Restraints
      • Opportunity
      • Trends
    • Scenario Forecast
      • Demand in Optimistic Scenario
      • Demand in Likely Scenario
      • Demand in Conservative Scenario
    • Key Success Factors
    • Industry Developments
    • Supply Chain Analysis
      • Sourcing and Procurement
        • Raw Material / Component Suppliers
        • Technology Providers
      • Product Manufacturers
      • Channel Partners
      • End Users / Customers
    • Market Assessment Factors
      • Macro-economic Factors
      • Forecast Factors
  4. 3.10. Parent Market Outlook
  5. Global Market Analysis 2020 to 2024 and Forecast, 2025 to 2035
    • Historical Market Size Value (USD Million) & Volume (Units) Analysis, 2020 to 2024
    • Current and Future Market Size Value (USD Million) & Volume (Units) Projections, 2025 to 2035
      • Y-o-Y Growth Trend Analysis
      • Absolute $ Opportunity Analysis
  6. Global Market Pricing Analysis 2020 to 2024 and Forecast 2025 to 2035
  7. Global Market Analysis 2020 to 2024 and Forecast 2025 to 2035, By Capacity
    • Introduction / Key Findings
    • Historical Market Size Value (USD Million) & Volume (Units) Analysis By Capacity, 2020 to 2024
    • Current and Future Market Size Value (USD Million) & Volume (Units) Analysis and Forecast By Capacity, 2025 to 2035
      • Upto 1 HP
      • 1.1 to 5 HP
      • 5.1 to 10 HP
      • Above 10 HP
    • Y-o-Y Growth Trend Analysis By Capacity, 2020 to 2024
    • Absolute $ Opportunity Analysis By Capacity, 2025 to 2035
  8. Global Market Analysis 2020 to 2024 and Forecast 2025 to 2035, By End Use
    • Introduction / Key Findings
    • Historical Market Size Value (USD Million) & Volume (Units) Analysis By End Use, 2020 to 2024
    • Current and Future Market Size Value (USD Million) & Volume (Units) Analysis and Forecast By End Use, 2025 to 2035
      • Auto Service Centers
      • Construction
      • Residential
      • Healthcare & Dental
      • Woodworking
      • Manufacturing
      • Others
    • Y-o-Y Growth Trend Analysis By End Use, 2020 to 2024
    • Absolute $ Opportunity Analysis By End Use, 2025 to 2035
  9. Global Market Analysis 2020 to 2024 and Forecast 2025 to 2035, By Configuration
    • Introduction / Key Findings
    • Historical Market Size Value (USD Million) & Volume (Units) Analysis By Configuration, 2020 to 2024
    • Current and Future Market Size Value (USD Million) & Volume (Units) Analysis and Forecast By Configuration, 2025 to 2035
      • Portable
      • Stationary
    • Y-o-Y Growth Trend Analysis By Configuration, 2020 to 2024
    • Absolute $ Opportunity Analysis By Configuration, 2025 to 2035
  10. Global Market Analysis 2020 to 2024 and Forecast 2025 to 2035, By Region
    • Introduction
    • Historical Market Size Value (USD Million) & Volume (Units) Analysis By Region, 2020 to 2024
    • Current Market Size Value (USD Million) & Volume (Units) Analysis and Forecast By Region, 2025 to 2035
      • North America
      • Latin America
      • Western Europe
      • Eastern Europe
      • East Asia
      • South Asia & Pacific
      • Middle East & Africa
    • Market Attractiveness Analysis By Region
  11. North America Market Analysis 2020 to 2024 and Forecast 2025 to 2035, By Country
    • Historical Market Size Value (USD Million) & Volume (Units) Trend Analysis By Market Taxonomy, 2020 to 2024
    • Market Size Value (USD Million) & Volume (Units) Forecast By Market Taxonomy, 2025 to 2035
      • By Country
        • USA
        • Canada
        • Mexico
      • By Capacity
      • By End Use
      • By Configuration
    • Market Attractiveness Analysis
      • By Country
      • By Capacity
      • By End Use
      • By Configuration
    • Key Takeaways
  12. Latin America Market Analysis 2020 to 2024 and Forecast 2025 to 2035, By Country
    • Historical Market Size Value (USD Million) & Volume (Units) Trend Analysis By Market Taxonomy, 2020 to 2024
    • Market Size Value (USD Million) & Volume (Units) Forecast By Market Taxonomy, 2025 to 2035
      • By Country
        • Brazil
        • Argentina
        • Rest of Latin America
      • By Capacity
      • By End Use
      • By Configuration
    • Market Attractiveness Analysis
      • By Country
      • By Capacity
      • By End Use
      • By Configuration
    • Key Takeaways
  13. Western Europe Market Analysis 2020 to 2024 and Forecast 2025 to 2035, By Country
    • Historical Market Size Value (USD Million) & Volume (Units) Trend Analysis By Market Taxonomy, 2020 to 2024
    • Market Size Value (USD Million) & Volume (Units) Forecast By Market Taxonomy, 2025 to 2035
      • By Country
        • Germany
        • Italy
        • France
        • UK
        • Spain
        • BENELUX
        • Nordics
        • Rest of W. Europe
      • By Capacity
      • By End Use
      • By Configuration
    • Market Attractiveness Analysis
      • By Country
      • By Capacity
      • By End Use
      • By Configuration
    • Key Takeaways
  14. Eastern Europe Market Analysis 2020 to 2024 and Forecast 2025 to 2035, By Country
    • Historical Market Size Value (USD Million) & Volume (Units) Trend Analysis By Market Taxonomy, 2020 to 2024
    • Market Size Value (USD Million) & Volume (Units) Forecast By Market Taxonomy, 2025 to 2035
      • By Country
        • Hungary
        • Poland
        • Russia
        • Balkan & Baltics
        • Rest of E.Europe
      • By Capacity
      • By End Use
      • By Configuration
    • Market Attractiveness Analysis
      • By Country
      • By Capacity
      • By End Use
      • By Configuration
    • Key Takeaways
  15. East Asia Market Analysis 2020 to 2024 and Forecast 2025 to 2035, By Country
    • Historical Market Size Value (USD Million) & Volume (Units) Trend Analysis By Market Taxonomy, 2020 to 2024
    • Market Size Value (USD Million) & Volume (Units) Forecast By Market Taxonomy, 2025 to 2035
      • By Country
        • China
        • Japan
        • South Korea
      • By Capacity
      • By End Use
      • By Configuration
    • Market Attractiveness Analysis
      • By Country
      • By Capacity
      • By End Use
      • By Configuration
    • Key Takeaways
  16. South Asia & Pacific Market Analysis 2020 to 2024 and Forecast 2025 to 2035, By Country
    • Historical Market Size Value (USD Million) & Volume (Units) Trend Analysis By Market Taxonomy, 2020 to 2024
    • Market Size Value (USD Million) & Volume (Units) Forecast By Market Taxonomy, 2025 to 2035
      • By Country
        • India
        • ASEAN
        • Australia & New Zealand
      • By Capacity
      • By End Use
      • By Configuration
    • Market Attractiveness Analysis
      • By Country
      • By Capacity
      • By End Use
      • By Configuration
    • Key Takeaways
  17. Middle East & Africa Market Analysis 2020 to 2024 and Forecast 2025 to 2035, By Country
    • Historical Market Size Value (USD Million) & Volume (Units) Trend Analysis By Market Taxonomy, 2020 to 2024
    • Market Size Value (USD Million) & Volume (Units) Forecast By Market Taxonomy, 2025 to 2035
      • By Country
        • GCC Countries
        • Turkiye
        • Northern Africa
        • South Africa
        • Rest of MEA
      • By Capacity
      • By End Use
      • By Configuration
    • Market Attractiveness Analysis
      • By Country
      • By Capacity
      • By End Use
      • By Configuration
    • Key Takeaways
  18. Key Countries Market Analysis
    • USA
      • Pricing Analysis
      • Market Share Analysis, 2024
        • By Capacity
        • By End Use
        • By Configuration
    • Canada
      • Pricing Analysis
      • Market Share Analysis, 2024
        • By Capacity
        • By End Use
        • By Configuration
    • Mexico
      • Pricing Analysis
      • Market Share Analysis, 2024
        • By Capacity
        • By End Use
        • By Configuration
    • Brazil
      • Pricing Analysis
      • Market Share Analysis, 2024
        • By Capacity
        • By End Use
        • By Configuration
    • Argentina
      • Pricing Analysis
      • Market Share Analysis, 2024
        • By Capacity
        • By End Use
        • By Configuration
    • Germany
      • Pricing Analysis
      • Market Share Analysis, 2024
        • By Capacity
        • By End Use
        • By Configuration
    • Italy
      • Pricing Analysis
      • Market Share Analysis, 2024
        • By Capacity
        • By End Use
        • By Configuration
    • France
      • Pricing Analysis
      • Market Share Analysis, 2024
        • By Capacity
        • By End Use
        • By Configuration
    • UK
      • Pricing Analysis
      • Market Share Analysis, 2024
        • By Capacity
        • By End Use
        • By Configuration
    • Spain
      • Pricing Analysis
      • Market Share Analysis, 2024
        • By Capacity
        • By End Use
        • By Configuration
    • BENELUX
      • Pricing Analysis
      • Market Share Analysis, 2024
        • By Capacity
        • By End Use
        • By Configuration
    • Nordics
      • Pricing Analysis
      • Market Share Analysis, 2024
        • By Capacity
        • By End Use
        • By Configuration
    • Russia
      • Pricing Analysis
      • Market Share Analysis, 2024
        • By Capacity
        • By End Use
        • By Configuration
    • Hungary
      • Pricing Analysis
      • Market Share Analysis, 2024
        • By Capacity
        • By End Use
        • By Configuration
    • Poland
      • Pricing Analysis
      • Market Share Analysis, 2024
        • By Capacity
        • By End Use
        • By Configuration
    • Balkan & Baltics
      • Pricing Analysis
      • Market Share Analysis, 2024
        • By Capacity
        • By End Use
        • By Configuration
    • China
      • Pricing Analysis
      • Market Share Analysis, 2024
        • By Capacity
        • By End Use
        • By Configuration
    • Japan
      • Pricing Analysis
      • Market Share Analysis, 2024
        • By Capacity
        • By End Use
        • By Configuration
    • South Korea
      • Pricing Analysis
      • Market Share Analysis, 2024
        • By Capacity
        • By End Use
        • By Configuration
    • India
      • Pricing Analysis
      • Market Share Analysis, 2024
        • By Capacity
        • By End Use
        • By Configuration
    • ASEAN
      • Pricing Analysis
      • Market Share Analysis, 2024
        • By Capacity
        • By End Use
        • By Configuration
    • Australia & New Zealand
      • Pricing Analysis
      • Market Share Analysis, 2024
        • By Capacity
        • By End Use
        • By Configuration
    • GCC Countries
      • Pricing Analysis
      • Market Share Analysis, 2024
        • By Capacity
        • By End Use
        • By Configuration
    • Turkiye
      • Pricing Analysis
      • Market Share Analysis, 2024
        • By Capacity
        • By End Use
        • By Configuration
    • Northern Africa
      • Pricing Analysis
      • Market Share Analysis, 2024
        • By Capacity
        • By End Use
        • By Configuration
    • South Africa
      • Pricing Analysis
      • Market Share Analysis, 2024
        • By Capacity
        • By End Use
        • By Configuration
  19. Market Structure Analysis
    • Competition Dashboard
    • Competition Benchmarking
    • Market Share Analysis of Top Players
      • By Regional
      • By Capacity
      • By End Use
      • By Configuration
  20. Competition Analysis
    • Competition Deep Dive
      • Atlas Copco
        • Overview
        • Product Portfolio
        • Profitability by Market Segments
        • Sales Footprint
        • Strategy Overview
      • Ingersoll Rand
        • Overview
        • Product Portfolio
        • Profitability by Market Segments
        • Sales Footprint
        • Strategy Overview
      • Sullair
        • Overview
        • Product Portfolio
        • Profitability by Market Segments
        • Sales Footprint
        • Strategy Overview
      • Kaeser
        • Overview
        • Product Portfolio
        • Profitability by Market Segments
        • Sales Footprint
        • Strategy Overview
      • Jun-Air
        • Overview
        • Product Portfolio
        • Profitability by Market Segments
        • Sales Footprint
        • Strategy Overview
      • California Air Tools
        • Overview
        • Product Portfolio
        • Profitability by Market Segments
        • Sales Footprint
        • Strategy Overview
      • Emax Compressor
        • Overview
        • Product Portfolio
        • Profitability by Market Segments
        • Sales Footprint
        • Strategy Overview
      • Werther Int.
        • Overview
        • Product Portfolio
        • Profitability by Market Segments
        • Sales Footprint
        • Strategy Overview
  21. Assumptions & Acronyms Used
  22. Research Methodology

List of Tables

  • Table 1: Global Market Value (USD Million) Forecast by Region, 2020-2035
  • Table 2: Global Market Volume (Units) Forecast by Region, 2020-2035
  • Table 3: Global Market Value (USD Million) Forecast by Capacity, 2020-2035
  • Table 4: Global Market Volume (Units) Forecast by Capacity, 2020-2035
  • Table 5: Global Market Value (USD Million) Forecast by End Use, 2020-2035
  • Table 6: Global Market Volume (Units) Forecast by End Use, 2020-2035
  • Table 7: Global Market Value (USD Million) Forecast by Configuration, 2020-2035
  • Table 8: Global Market Volume (Units) Forecast by Configuration, 2020-2035
  • Table 9: North America Market Value (USD Million) Forecast by Country, 2020-2035
  • Table 10: North America Market Volume (Units) Forecast by Country, 2020-2035
  • Table 11: North America Market Value (USD Million) Forecast by Capacity, 2020-2035
  • Table 12: North America Market Volume (Units) Forecast by Capacity, 2020-2035
  • Table 13: North America Market Value (USD Million) Forecast by End Use, 2020-2035
  • Table 14: North America Market Volume (Units) Forecast by End Use, 2020-2035
  • Table 15: North America Market Value (USD Million) Forecast by Configuration, 2020-2035
  • Table 16: North America Market Volume (Units) Forecast by Configuration, 2020-2035
  • Table 17: Latin America Market Value (USD Million) Forecast by Country, 2020-2035
  • Table 18: Latin America Market Volume (Units) Forecast by Country, 2020-2035
  • Table 19: Latin America Market Value (USD Million) Forecast by Capacity, 2020-2035
  • Table 20: Latin America Market Volume (Units) Forecast by Capacity, 2020-2035
  • Table 21: Latin America Market Value (USD Million) Forecast by End Use, 2020-2035
  • Table 22: Latin America Market Volume (Units) Forecast by End Use, 2020-2035
  • Table 23: Latin America Market Value (USD Million) Forecast by Configuration, 2020-2035
  • Table 24: Latin America Market Volume (Units) Forecast by Configuration, 2020-2035
  • Table 25: Western Europe Market Value (USD Million) Forecast by Country, 2020-2035
  • Table 26: Western Europe Market Volume (Units) Forecast by Country, 2020-2035
  • Table 27: Western Europe Market Value (USD Million) Forecast by Capacity, 2020-2035
  • Table 28: Western Europe Market Volume (Units) Forecast by Capacity, 2020-2035
  • Table 29: Western Europe Market Value (USD Million) Forecast by End Use, 2020-2035
  • Table 30: Western Europe Market Volume (Units) Forecast by End Use, 2020-2035
  • Table 31: Western Europe Market Value (USD Million) Forecast by Configuration, 2020-2035
  • Table 32: Western Europe Market Volume (Units) Forecast by Configuration, 2020-2035
  • Table 33: Eastern Europe Market Value (USD Million) Forecast by Country, 2020-2035
  • Table 34: Eastern Europe Market Volume (Units) Forecast by Country, 2020-2035
  • Table 35: Eastern Europe Market Value (USD Million) Forecast by Capacity, 2020-2035
  • Table 36: Eastern Europe Market Volume (Units) Forecast by Capacity, 2020-2035
  • Table 37: Eastern Europe Market Value (USD Million) Forecast by End Use, 2020-2035
  • Table 38: Eastern Europe Market Volume (Units) Forecast by End Use, 2020-2035
  • Table 39: Eastern Europe Market Value (USD Million) Forecast by Configuration, 2020-2035
  • Table 40: Eastern Europe Market Volume (Units) Forecast by Configuration, 2020-2035
  • Table 41: East Asia Market Value (USD Million) Forecast by Country, 2020-2035
  • Table 42: East Asia Market Volume (Units) Forecast by Country, 2020-2035
  • Table 43: East Asia Market Value (USD Million) Forecast by Capacity, 2020-2035
  • Table 44: East Asia Market Volume (Units) Forecast by Capacity, 2020-2035
  • Table 45: East Asia Market Value (USD Million) Forecast by End Use, 2020-2035
  • Table 46: East Asia Market Volume (Units) Forecast by End Use, 2020-2035
  • Table 47: East Asia Market Value (USD Million) Forecast by Configuration, 2020-2035
  • Table 48: East Asia Market Volume (Units) Forecast by Configuration, 2020-2035
  • Table 49: South Asia & Pacific Market Value (USD Million) Forecast by Country, 2020-2035
  • Table 50: South Asia & Pacific Market Volume (Units) Forecast by Country, 2020-2035
  • Table 51: South Asia & Pacific Market Value (USD Million) Forecast by Capacity, 2020-2035
  • Table 52: South Asia & Pacific Market Volume (Units) Forecast by Capacity, 2020-2035
  • Table 53: South Asia & Pacific Market Value (USD Million) Forecast by End Use, 2020-2035
  • Table 54: South Asia & Pacific Market Volume (Units) Forecast by End Use, 2020-2035
  • Table 55: South Asia & Pacific Market Value (USD Million) Forecast by Configuration, 2020-2035
  • Table 56: South Asia & Pacific Market Volume (Units) Forecast by Configuration, 2020-2035
  • Table 57: Middle East & Africa Market Value (USD Million) Forecast by Country, 2020-2035
  • Table 58: Middle East & Africa Market Volume (Units) Forecast by Country, 2020-2035
  • Table 59: Middle East & Africa Market Value (USD Million) Forecast by Capacity, 2020-2035
  • Table 60: Middle East & Africa Market Volume (Units) Forecast by Capacity, 2020-2035
  • Table 61: Middle East & Africa Market Value (USD Million) Forecast by End Use, 2020-2035
  • Table 62: Middle East & Africa Market Volume (Units) Forecast by End Use, 2020-2035
  • Table 63: Middle East & Africa Market Value (USD Million) Forecast by Configuration, 2020-2035
  • Table 64: Middle East & Africa Market Volume (Units) Forecast by Configuration, 2020-2035

List of Figures

  • Figure 1: Global Market Volume (Units) Forecast 2020-2035
  • Figure 2: Global Market Pricing Analysis
  • Figure 3: Global Market Value (USD Million) Forecast 2020-2035
  • Figure 4: Global Market Value Share and BPS Analysis by Capacity, 2025 and 2035
  • Figure 5: Global Market Y-o-Y Growth Comparison by Capacity, 2025-2035
  • Figure 6: Global Market Attractiveness Analysis by Capacity
  • Figure 7: Global Market Value Share and BPS Analysis by End Use, 2025 and 2035
  • Figure 8: Global Market Y-o-Y Growth Comparison by End Use, 2025-2035
  • Figure 9: Global Market Attractiveness Analysis by End Use
  • Figure 10: Global Market Value Share and BPS Analysis by Configuration, 2025 and 2035
  • Figure 11: Global Market Y-o-Y Growth Comparison by Configuration, 2025-2035
  • Figure 12: Global Market Attractiveness Analysis by Configuration
  • Figure 13: Global Market Value (USD Million) Share and BPS Analysis by Region, 2025 and 2035
  • Figure 14: Global Market Y-o-Y Growth Comparison by Region, 2025-2035
  • Figure 15: Global Market Attractiveness Analysis by Region
  • Figure 16: North America Market Incremental $ Opportunity, 2025-2035
  • Figure 17: Latin America Market Incremental $ Opportunity, 2025-2035
  • Figure 18: Western Europe Market Incremental $ Opportunity, 2025-2035
  • Figure 19: Eastern Europe Market Incremental $ Opportunity, 2025-2035
  • Figure 20: East Asia Market Incremental $ Opportunity, 2025-2035
  • Figure 21: South Asia & Pacific Market Incremental $ Opportunity, 2025-2035
  • Figure 22: Middle East & Africa Market Incremental $ Opportunity, 2025-2035
  • Figure 23: North America Market Value Share and BPS Analysis by Country, 2025 and 2035
  • Figure 24: North America Market Value Share and BPS Analysis by Capacity, 2025 and 2035
  • Figure 25: North America Market Y-o-Y Growth Comparison by Capacity, 2025-2035
  • Figure 26: North America Market Attractiveness Analysis by Capacity
  • Figure 27: North America Market Value Share and BPS Analysis by End Use, 2025 and 2035
  • Figure 28: North America Market Y-o-Y Growth Comparison by End Use, 2025-2035
  • Figure 29: North America Market Attractiveness Analysis by End Use
  • Figure 30: North America Market Value Share and BPS Analysis by Configuration, 2025 and 2035
  • Figure 31: North America Market Y-o-Y Growth Comparison by Configuration, 2025-2035
  • Figure 32: North America Market Attractiveness Analysis by Configuration
  • Figure 33: Latin America Market Value Share and BPS Analysis by Country, 2025 and 2035
  • Figure 34: Latin America Market Value Share and BPS Analysis by Capacity, 2025 and 2035
  • Figure 35: Latin America Market Y-o-Y Growth Comparison by Capacity, 2025-2035
  • Figure 36: Latin America Market Attractiveness Analysis by Capacity
  • Figure 37: Latin America Market Value Share and BPS Analysis by End Use, 2025 and 2035
  • Figure 38: Latin America Market Y-o-Y Growth Comparison by End Use, 2025-2035
  • Figure 39: Latin America Market Attractiveness Analysis by End Use
  • Figure 40: Latin America Market Value Share and BPS Analysis by Configuration, 2025 and 2035
  • Figure 41: Latin America Market Y-o-Y Growth Comparison by Configuration, 2025-2035
  • Figure 42: Latin America Market Attractiveness Analysis by Configuration
  • Figure 43: Western Europe Market Value Share and BPS Analysis by Country, 2025 and 2035
  • Figure 44: Western Europe Market Value Share and BPS Analysis by Capacity, 2025 and 2035
  • Figure 45: Western Europe Market Y-o-Y Growth Comparison by Capacity, 2025-2035
  • Figure 46: Western Europe Market Attractiveness Analysis by Capacity
  • Figure 47: Western Europe Market Value Share and BPS Analysis by End Use, 2025 and 2035
  • Figure 48: Western Europe Market Y-o-Y Growth Comparison by End Use, 2025-2035
  • Figure 49: Western Europe Market Attractiveness Analysis by End Use
  • Figure 50: Western Europe Market Value Share and BPS Analysis by Configuration, 2025 and 2035
  • Figure 51: Western Europe Market Y-o-Y Growth Comparison by Configuration, 2025-2035
  • Figure 52: Western Europe Market Attractiveness Analysis by Configuration
  • Figure 53: Eastern Europe Market Value Share and BPS Analysis by Country, 2025 and 2035
  • Figure 54: Eastern Europe Market Value Share and BPS Analysis by Capacity, 2025 and 2035
  • Figure 55: Eastern Europe Market Y-o-Y Growth Comparison by Capacity, 2025-2035
  • Figure 56: Eastern Europe Market Attractiveness Analysis by Capacity
  • Figure 57: Eastern Europe Market Value Share and BPS Analysis by End Use, 2025 and 2035
  • Figure 58: Eastern Europe Market Y-o-Y Growth Comparison by End Use, 2025-2035
  • Figure 59: Eastern Europe Market Attractiveness Analysis by End Use
  • Figure 60: Eastern Europe Market Value Share and BPS Analysis by Configuration, 2025 and 2035
  • Figure 61: Eastern Europe Market Y-o-Y Growth Comparison by Configuration, 2025-2035
  • Figure 62: Eastern Europe Market Attractiveness Analysis by Configuration
  • Figure 63: East Asia Market Value Share and BPS Analysis by Country, 2025 and 2035
  • Figure 64: East Asia Market Value Share and BPS Analysis by Capacity, 2025 and 2035
  • Figure 65: East Asia Market Y-o-Y Growth Comparison by Capacity, 2025-2035
  • Figure 66: East Asia Market Attractiveness Analysis by Capacity
  • Figure 67: East Asia Market Value Share and BPS Analysis by End Use, 2025 and 2035
  • Figure 68: East Asia Market Y-o-Y Growth Comparison by End Use, 2025-2035
  • Figure 69: East Asia Market Attractiveness Analysis by End Use
  • Figure 70: East Asia Market Value Share and BPS Analysis by Configuration, 2025 and 2035
  • Figure 71: East Asia Market Y-o-Y Growth Comparison by Configuration, 2025-2035
  • Figure 72: East Asia Market Attractiveness Analysis by Configuration
  • Figure 73: South Asia & Pacific Market Value Share and BPS Analysis by Country, 2025 and 2035
  • Figure 74: South Asia & Pacific Market Value Share and BPS Analysis by Capacity, 2025 and 2035
  • Figure 75: South Asia & Pacific Market Y-o-Y Growth Comparison by Capacity, 2025-2035
  • Figure 76: South Asia & Pacific Market Attractiveness Analysis by Capacity
  • Figure 77: South Asia & Pacific Market Value Share and BPS Analysis by End Use, 2025 and 2035
  • Figure 78: South Asia & Pacific Market Y-o-Y Growth Comparison by End Use, 2025-2035
  • Figure 79: South Asia & Pacific Market Attractiveness Analysis by End Use
  • Figure 80: South Asia & Pacific Market Value Share and BPS Analysis by Configuration, 2025 and 2035
  • Figure 81: South Asia & Pacific Market Y-o-Y Growth Comparison by Configuration, 2025-2035
  • Figure 82: South Asia & Pacific Market Attractiveness Analysis by Configuration
  • Figure 83: Middle East & Africa Market Value Share and BPS Analysis by Country, 2025 and 2035
  • Figure 84: Middle East & Africa Market Value Share and BPS Analysis by Capacity, 2025 and 2035
  • Figure 85: Middle East & Africa Market Y-o-Y Growth Comparison by Capacity, 2025-2035
  • Figure 86: Middle East & Africa Market Attractiveness Analysis by Capacity
  • Figure 87: Middle East & Africa Market Value Share and BPS Analysis by End Use, 2025 and 2035
  • Figure 88: Middle East & Africa Market Y-o-Y Growth Comparison by End Use, 2025-2035
  • Figure 89: Middle East & Africa Market Attractiveness Analysis by End Use
  • Figure 90: Middle East & Africa Market Value Share and BPS Analysis by Configuration, 2025 and 2035
  • Figure 91: Middle East & Africa Market Y-o-Y Growth Comparison by Configuration, 2025-2035
  • Figure 92: Middle East & Africa Market Attractiveness Analysis by Configuration
  • Figure 93: Global Market - Tier Structure Analysis
  • Figure 94: Global Market - Company Share Analysis
Dashboard
Dashboard
Dashboard
Dashboard
Dashboard
Dashboard

Full Research Suite comprises of:

Market outlook & trends analysis

Market outlook & trends analysis

Interviews & case studies

Interviews & case studies

Strategic recommendations

Strategic recommendations

Vendor profiles & capabilities analysis

Vendor profiles & capabilities analysis

5-year forecasts

5-year forecasts

8 regions and 60+ country-level data splits

8 regions and 60+ country-level data splits

Market segment data splits

Market segment data splits

12 months of continuous data updates

12 months of continuous data updates

DELIVERED AS:

PDF EXCEL ONLINE

Full Research Suite


$5000

$7500

$10000

Buy Report Now
Similar Industry Reports

Similar Industry Reports

Air Flow Sensors Market

Air Flow Sensors Market Size and Share Forecast Outlook 2025 to 2035

Air Separation Plant Market

Air Separation Plant Market Size and Share Forecast Outlook 2025 to 2035

Air Cooled Turbo Generators Market

Air Cooled Turbo Generators Market Size and Share Forecast Outlook 2025 to 2035

Aircraft Cooling Turbines Market

Aircraft Cooling Turbines Market Size and Share Forecast Outlook 2025 to 2035

Air Conditioning Compressor Market

Air Conditioning Compressor Market Size and Share Forecast Outlook 2025 to 2035

Air Measuring Equipment Market

Air Measuring Equipment Market Size and Share Forecast Outlook 2025 to 2035

Aircraft Smoke Detection and Fire Extinguishing System Market

Aircraft Smoke Detection and Fire Extinguishing System Market Size and Share Forecast Outlook 2025 to 2035

Aircraft Hose Fittings Market

Aircraft Hose Fittings Market Size and Share Forecast Outlook 2025 to 2035

Aircraft Cabin Interior Market

Aircraft Cabin Interior Market Size and Share Forecast Outlook 2025 to 2035

Aircraft Galley Systems Market

Aircraft Galley Systems Market Size and Share Forecast Outlook 2025 to 2035

Aircraft Interior Lighting Market

Aircraft Interior Lighting Market Size and Share Forecast Outlook 2025 to 2035

Aircraft Battery Market

Aircraft Battery Market Size and Share Forecast Outlook 2025 to 2035

Aircraft Floor Panels Market

Aircraft Floor Panels Market Size and Share Forecast Outlook 2025 to 2035

Aircraft Fuel Systems Market

Aircraft Fuel Systems Market Size and Share Forecast Outlook 2025 to 2035

Aircraft Lubricant Market

Aircraft Lubricant Market Size and Share Forecast Outlook 2025 to 2035

Aircraft Seat Market

Aircraft Seat Market Size and Share Forecast Outlook 2025 to 2035

Aircraft Ground Support Equipment Market

Aircraft Ground Support Equipment Market Size and Share Forecast Outlook 2025 to 2035

Aircraft Maintenance, Repair and Overhaul Market

Aircraft Maintenance, Repair and Overhaul Market Size and Share Forecast Outlook 2025 to 2035

Air Quality Monitoring System Market

Air Quality Monitoring System Market Size and Share Forecast Outlook 2025 to 2035

Air-dried Venison Dog Food Market

Air-dried Venison Dog Food Market Size and Share Forecast Outlook 2025 to 2035

Future Market Insights

Quiet Air Compressors Market

Chat With MaRIA

Chat With

MaRIA

Hi There, I am MaRIA, Your Market Research Intelligence Assistant. How may I help you?