The global refrigeration and air conditioning compressors market is valued at USD 37.3 billion in 2025 and is slated to reach USD 49.6 billion by 2035, recording an absolute increase of USD 12.3 billion over the forecast period. This translates into a total growth of 33.0%, with the market forecast to expand at a CAGR of 2.9% between 2025 and 2035. As per Future Market Insights, an ESOMAR-accredited, Chamber of Commerce member, and Stevie winner, the market size is expected to grow by nearly 1.3X during the same period, supported by increasing demand for energy-efficient HVAC systems, expansion of cold chain logistics, and growing concerns about climate control across diverse residential, commercial, and industrial applications.
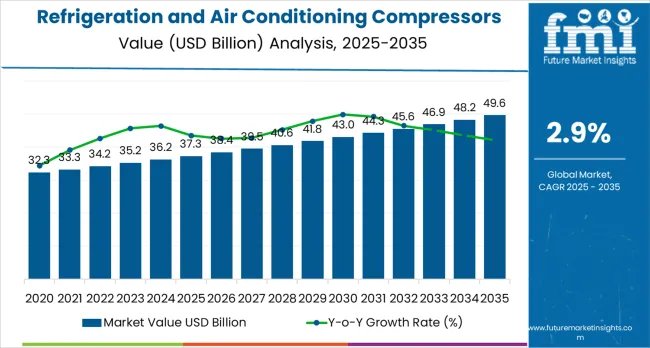
Between 2025 and 2030, the refrigeration and air conditioning compressors market is projected to expand from USD 37.3 billion to USD 42.8 billion, resulting in a value increase of USD 5.5 billion, which represents 44.7% of the total forecast growth for the decade. This phase of development will be shaped by increasing global urbanization, rising disposable incomes, and growing adoption of energy-efficient cooling solutions in residential and commercial applications. Equipment manufacturers are expanding their production capabilities to address the growing demand for efficient climate control solutions and enhanced operational reliability.
| Metric | Value |
|---|---|
| Estimated Value in (2025E) | USD 37.3 billion |
| Forecast Value in (2035F) | USD 49.6 billion |
| Forecast CAGR (2025 to 2035) | 2.9% |
The HVAC (Heating, Ventilation, and Air Conditioning) market is the largest contributor, accounting for approximately 40–45% of the demand. Compressors are essential components in HVAC systems, enabling effective cooling and climate control for both residential and commercial spaces. The market’s growth is closely linked to increasing demand for energy-efficient air conditioning and refrigeration solutions in residential, commercial, and industrial sectors. The refrigeration market, including food storage and transport, accounts for about 20–25%. Compressors play a crucial role in maintaining low temperatures in commercial refrigeration systems, cold storage warehouses, and refrigerated transport for perishable goods.
The automotive air conditioning market contributes around 15–18%, driven by the increasing adoption of air conditioning in vehicles and the growing demand for energy-efficient solutions in electric and hybrid vehicles. The industrial and process cooling market holds a share of approximately 10–12%. In industrial settings, compressors are used for cooling processes in manufacturing plants, data centers, and chemical plants, where maintaining precise temperature control is critical. The energy and power generation market contributes about 5–8%, as compressors are used in cooling systems for power plants, especially in regions with high ambient temperatures.
Market expansion is being supported by the increasing global demand for climate control systems and the corresponding need for efficient compressor equipment that can maintain operational reliability and energy efficiency while supporting diverse cooling applications across various residential, commercial, and industrial environments. Modern building operators and facility managers are increasingly focused on implementing compressor solutions that can reduce energy consumption, minimize operational costs, and provide consistent performance in cooling operations. Refrigeration and air conditioning compressors'proven ability to deliver enhanced operational efficiency, reliable climate control capabilities, and versatile cooling applications make them essential equipment for contemporary building operations and environmental control solutions.
The growing emphasis on energy efficiency and environmental compliance is driving demand for refrigeration and air conditioning compressors that can support high-volume cooling operations, reduce energy consumption, and enable efficient temperature control across varying application configurations. Building operators'preference for equipment that combines reliability with operational efficiency and cost-effectiveness is creating opportunities for innovative compressor implementations. The rising influence of environmental regulations and smart building technologies is also contributing to increased adoption of refrigeration and air conditioning compressors that can provide advanced operational control without compromising performance or environmental compliance.
The refrigeration and air conditioning compressors market is poised for robust growth and transformation. As building operators and facility managers across both developed and emerging markets seek climate control equipment that is efficient, reliable, automated, and environmentally compliant, refrigeration and air conditioning compressor systems are gaining prominence not just as operational equipment but as strategic infrastructure for operational efficiency, energy management, occupant comfort enhancement, and environmental compliance.
Rising urbanization and climate control demand in North America, Europe, and Asia Pacific amplify demand, while manufacturers are picking up on innovations in variable speed technology and digital control systems.
Pathways like smart technology integration, energy efficiency improvements, and environmental compliance promise strong margin uplift, especially in developed markets. Geographic expansion and application diversification will capture volume, particularly where construction activity is growing or climate control requirements require modernization. Environmental pressures around energy efficiency, refrigerant management, operational optimization, and regulatory compliance give structural support.
The market is segmented by product type, cooling capacity, refrigerant type, end use, application, and region. By product type, the market is divided into reciprocating, screw, centrifugal, rotary, and scroll compressors. By cooling capacity, it covers less than 5 KW, 5 to 30 KW, 30 to 100 KW, 100 to 300 KW, 300 to 500 KW, 500 to 1,000 KW, and above 1,000 KW. By refrigerant type, it includes R410A, R407C, R404A, R134A, R290, R744, and others. By end use, it is segmented into refrigeration and air conditioning. By application, it covers residential, commercial, medical &healthcare, industrial, and transportation. Regionally, the market is divided into North America, Latin America, Western Europe, Eastern Europe, East Asia, South Asia &Pacific, and Middle East &Africa.
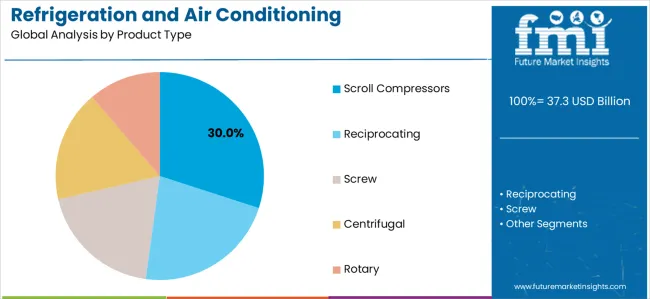
The scroll compressors segment is projected to account for 30% of the refrigeration and air conditioning compressors market in 2025, reaffirming its position as the leading product category. Building operators and facility managers increasingly utilize scroll compressors for their proven reliability, compact design, and high efficiency in climate control operations across residential air conditioning, commercial HVAC, and light commercial refrigeration applications. Scroll compressor technology's established operational procedures and consistent performance output directly address the building requirements for reliable temperature control and operational efficiency in diverse cooling environments.
This product segment forms the foundation of current climate control operations, as it represents the technology with the greatest operational versatility and established maintenance infrastructure across multiple applications and building scenarios. Operator investments in enhanced variable speed capabilities and energy optimization continue to strengthen adoption among building operators and facility managers. With operators prioritizing operational reliability and equipment availability, scroll compressors align with both operational efficiency objectives and cost management requirements, making them the central component of comprehensive climate control strategies.
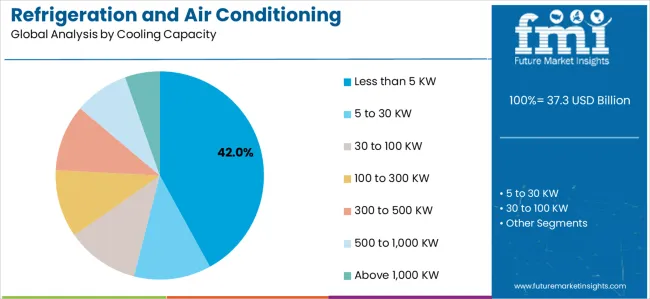
Less than 5 KW cooling capacity is projected to represent 42% of refrigeration and air conditioning compressor demand in 2025, underscoring its critical role as the primary capacity range for residential and light commercial cooling applications. Building operators prefer compressors in this capacity range for their efficiency, reliability, and ability to handle typical cooling loads while supporting residential comfort and small commercial requirements. Positioned as essential equipment for modern residential and light commercial applications, these compressors offer both operational advantages and energy benefits.
The segment is supported by continuous innovation in residential construction expansion and the growing availability of specialized equipment configurations that enable efficient temperature control with enhanced operational capabilities. Building operators are investing in capacity optimization to support residential comfort delivery and small commercial operations. As residential construction becomes more prevalent and energy efficiency requirements increase, less than 5 KW capacity will continue to dominate the cooling capacity market while supporting advanced equipment utilization and building climate control strategies.
The refrigeration and air conditioning compressors market is advancing steadily due to increasing demand for energy-efficient HVAC systems and growing adoption of climate control infrastructure that provides enhanced temperature management and operational reliability across diverse cooling applications. The market faces challenges, including high equipment capital costs, specialized maintenance infrastructure requirements, and varying operational requirements across different application environments. Innovation in variable speed technology and digital control systems continues to influence equipment development and market expansion patterns.
The growing expansion of energy efficiency regulations and building performance standards is enabling equipment manufacturers to develop refrigeration and air conditioning compressor systems that provide superior operational efficiency, enhanced energy management capabilities, and reliable performance in high-demand cooling environments. Advanced compressor systems provide improved energy efficiency while allowing more effective temperature control and consistent comfort delivery across various applications and building requirements. Manufacturers are increasingly recognizing the competitive advantages of modern compressor capabilities for operational efficiency and energy management positioning.
Modern refrigeration and air conditioning compressor manufacturers are incorporating variable speed drives and digital control systems to enhance operational efficiency, reduce energy consumption, and ensure consistent performance delivery to building operators. These technologies improve energy management while enabling new applications, including predictive maintenance and smart building integration solutions. Advanced technology integration also allows manufacturers to support premium equipment positioning and operational optimization beyond traditional climate control equipment supply.
| Country | CAGR (2025-2035) |
|---|---|
| USA | 2.7% |
| China | 3.1% |
| Germany | 2.5% |
| India | 3.4% |
| Brazil | 3.0% |
| Japan | 2.8% |
| South Korea | 2.9% |
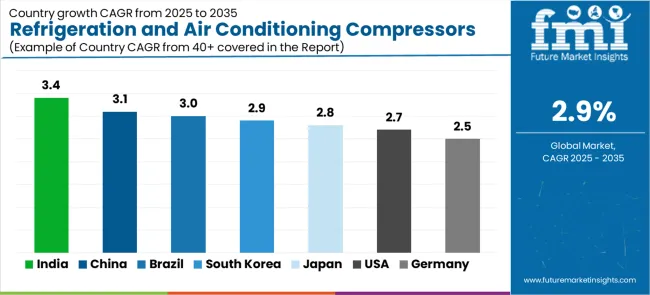
The refrigeration and air conditioning compressors market is experiencing steady growth globally, with India leading at a 3.4% CAGR through 2035, driven by rapid urbanization programs, growing residential construction, and significant adoption of climate control solutions. China follows at 3.1%, supported by massive infrastructure development projects, comprehensive building modernization, and growing adoption of energy-efficient HVAC technologies. Brazil shows growth at 3.0%, emphasizing residential development and commercial construction capabilities. South Korea and Japan record 2.8% and 2.9% respectively, focusing on technological innovation and energy efficiency optimization. USA demonstrates 2.7% growth, supported by building modernization and energy efficiency requirements. Germany shows 2.5% growth, driven by environmental compliance and advanced manufacturing capabilities.
The report covers an in-depth analysis of 40+ countries, with top-performing countries highlighted below.
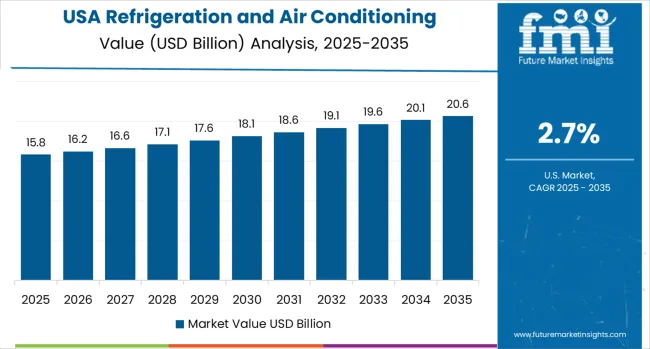
Revenue from refrigeration and air conditioning compressors in the USA is projected to exhibit solid growth with a CAGR of 2.7% through 2035, driven by stringent energy efficiency standards established by EPCA and rapidly growing adoption of high-SEER rating systems supported by environmental regulations and operational efficiency initiatives. The country's comprehensive regulatory framework and increasing investment in smart building technologies are creating substantial demand for advanced climate control solutions. Major building operators and facility managers are establishing comprehensive compressor systems to serve both domestic operations and energy efficiency requirements.
Demand for refrigeration and air conditioning compressors in China is expanding at a CAGR of 3.1%, supported by the country's massive infrastructure development projects, comprehensive urbanization programs, and increasing adoption of advanced climate control systems. The country's strategic industrial modernization and growing residential development are driving sophisticated compressor capabilities. State enterprises and construction companies are establishing extensive equipment operations to address the growing demand for efficient climate control and operational reliability.
Revenue from refrigeration and air conditioning compressors in Germany is growing at a CAGR of 2.5%, supported by the country's strong environmental regulations, advanced manufacturing capabilities, and comprehensive building modernization programs among facility operators. The nation's mature construction sector and increasing emphasis on energy efficiency are driving sophisticated compressor capabilities throughout the equipment market. Leading building operators and manufacturers are investing extensively in advanced compressor development and technology integration to serve both domestic building needs and export markets.
Demand for refrigeration and air conditioning compressors in India is expected to expand at a CAGR of 3.4%, supported by the country's rapid urbanization programs, increasing residential construction, and strategic investment in climate control development. India's growing construction market and emphasis on operational efficiency are driving demand for cost-effective compressor technologies across major building markets. Construction operators and facility managers are establishing equipment partnerships to serve both domestic building expansion and operational efficiency requirements.
Revenue from refrigeration and air conditioning compressors in Brazil is anticipated to grow at a CAGR of 3%, supported by the country's residential development programs, growing commercial construction, and increasing investment in climate control modernization. Brazil's expanding construction market and emphasis on building improvement are driving demand for reliable compressor technologies across major metropolitan markets. Building operators and construction companies are establishing service partnerships to serve both domestic construction development and operational efficiency markets.
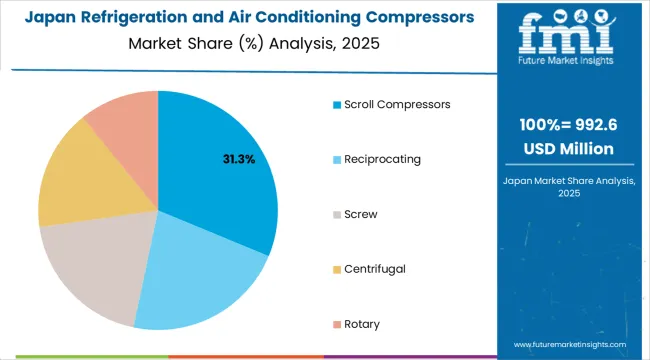
Demand for refrigeration and air conditioning compressors in Japan is forecasted to expand at a CAGR of 2.8%, supported by the country's technological innovation capabilities, growing energy efficiency requirements, and strategic investment in building modernization. Japan's advanced construction sector and emphasis on operational efficiency are driving demand for high-technology compressor systems across major building markets. Building operators and facility managers are establishing technology partnerships to serve both domestic building development and international competitiveness markets.
Revenue from refrigeration and air conditioning compressors in South Korea is expanding at a CAGR of 2.9%, supported by the country's rapid construction development, growing environmental compliance requirements, and strategic investment in smart building technologies. South Korea's expanding construction market and emphasis on operational efficiency are driving demand for advanced compressor technologies across major building markets. Construction operators and facility managers are establishing technology partnerships to serve both domestic construction expansion and operational efficiency requirements.
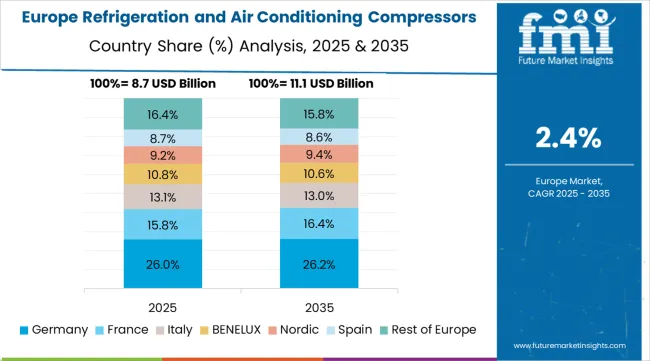
The refrigeration and air conditioning compressors market in Europe is projected to grow from USD 9.1 billion in 2025 to USD 11.8 billion by 2035, registering a CAGR of 2.6% over the forecast period. Germany is expected to maintain its leadership position with a 27.3% market share in 2025, increasing to 27.6% by 2035, supported by its advanced manufacturing infrastructure, comprehensive environmental regulations, and major building facilities serving European and international markets.
France follows with an 18.7% share in 2025, projected to ease to 18.4% by 2035, driven by building modernization programs, environmental compliance initiatives, and established construction capabilities, but facing challenges from competitive pressures and investment constraints. United Kingdom holds a 16.2% share in 2025, expected to decline to 15.9% by 2035, supported by building modernization requirements and energy efficiency initiatives but facing challenges from post-Brexit adjustments and investment uncertainties. Italy commands a 14.8% share in 2025, projected to reach 14.9% by 2035, while Spain accounts for 11.9% in 2025, expected to reach 12.0% by 2035. The Rest of Europe region, including Nordic countries, Eastern European markets, Netherlands, Belgium, and other European countries, is anticipated to gain momentum, expanding its collective share from 11.1% to 11.2% by 2035, attributed to increasing construction development across Nordic countries and growing building modernization across various European markets implementing energy efficiency programs.
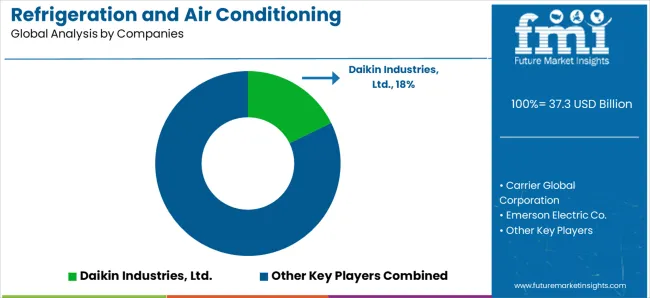
The refrigeration and air conditioning compressors market is characterized by competition among established climate control equipment manufacturers, specialized compressor technology providers, and integrated HVAC solution companies. Companies are investing in variable speed technology research, digital control development, IoT integration capabilities, and comprehensive equipment portfolios to deliver efficient, reliable, and environmentally compliant refrigeration and air conditioning compressor solutions. Innovation in energy efficiency systems, smart control technologies, and predictive maintenance capabilities is central to strengthening market position and competitive advantage.
Daikin Industries Ltd. leads the market with a strong presence, offering comprehensive compressor solutions with a focus on reliability and advanced technology for residential and commercial applications. Carrier Global Corporation provides integrated HVAC systems with an emphasis on energy efficiency and environmental compliance. Emerson Electric Co. delivers advanced compressor technologies with a focus on variable speed capabilities and smart controls. Mitsubishi Electric Corporation specializes in high-efficiency compressors with emphasis on reliability and performance optimization. Johnson Controls International plc focuses on comprehensive building solutions with global service networks and smart technology integration. LG Electronics Inc. offers residential and commercial compressors with emphasis on energy efficiency and cost optimization. Panasonic Corporation provides advanced compressor technologies with focus on environmental compliance and operational efficiency. Danfoss A/S delivers specialized compressor components with emphasis on energy management and system optimization.
| Items | Values |
|---|---|
| Quantitative Units (2025) | USD 37.3 billion |
| Product Type | Reciprocating, Screw, Centrifugal, Rotary, Scroll |
| Cooling Capacity | Less than 5 KW, 5 to 30 KW, 30 to 100 KW, 100 to 300 KW, 300 to 500 KW, 500 to 1,000 KW, Above 1,000 KW |
| Refrigerant Type | R410A, R407C, R404A, R134A, R290, R744, Others |
| End Use | Refrigeration, Air Conditioning |
| Application | Residential, Commercial, Medical &Healthcare, Industrial, Transportation |
| Regions Covered | North America, Latin America, Western Europe, Eastern Europe, East Asia, South Asia &Pacific, Middle East &Africa |
| Countries Covered | United States, Canada, Germany, United Kingdom, France, China, Japan, Brazil, India and 40+ countries |
| Key Companies Profiled | Daikin Industries Ltd., Carrier Global Corporation, Emerson Electric Co., Mitsubishi Electric Corporation, Johnson Controls International plc, LG Electronics Inc., Panasonic Corporation, and Danfoss A/S |
| Additional Attributes | Equipment sales by product type and cooling capacity, regional demand trends, competitive landscape, technological advancements in variable speed systems, digital control development, IoT integration innovation, and operational efficiency optimization |
The global refrigeration and air conditioning compressors market is estimated to be valued at USD 37.3 billion in 2025.
The market size for the refrigeration and air conditioning compressors market is projected to reach USD 49.6 billion by 2035.
The refrigeration and air conditioning compressors market is expected to grow at a 2.9% CAGR between 2025 and 2035.
The key product types in refrigeration and air conditioning compressors market are scroll compressors, reciprocating, screw, centrifugal and rotary.
In terms of cooling capacity, less than 5 kw segment to command 42.0% share in the refrigeration and air conditioning compressors market in 2025.


Full Research Suite comprises of:
Market outlook & trends analysis
Interviews & case studies
Strategic recommendations
Vendor profiles & capabilities analysis
5-year forecasts
8 regions and 60+ country-level data splits
Market segment data splits
12 months of continuous data updates
DELIVERED AS:
PDF EXCEL ONLINE
Key Players & Market Share in Refrigeration and Air Conditioning Compressors
Refrigeration Compressor Market Size and Share Forecast Outlook 2025 to 2035
Refrigeration Oil Market Growth - Trends & Forecast 2025 to 2035
Refrigeration Compressor Industry Analysis in Western Europe Analysis by Product Type, Refrigerant Type, Application and Country - Forecast for 2025 to 2035
Korea Refrigeration Compressor Market Analysis by Product Type, Application, Refrigerant Type, and Province through 2035
Refrigeration Coolers Market Growth – Trends & Forecast 2025 to 2035
Refrigeration Leak Detector Market Growth - Trends & Forecast 2025 to 2035
Refrigeration Gauge Market
Refrigeration Monitoring Market
Bar Refrigeration Market
Japan Refrigeration Compressor Market Analysis by Product Type, Application, Refrigerant Type, and City through 2035
Beverage Refrigeration Market Size and Share Forecast Outlook 2025 to 2035
Commercial Refrigeration System Market Size and Share Forecast Outlook 2025 to 2035
Commercial Refrigeration Compressor Market Growth - Trends, Demand & Innovations 2025 to 2035
Commercial Refrigeration Equipment Market Growth – Trends & Forecast 2024-2034
Commercial Food Refrigeration Equipment Market Size and Share Forecast Outlook 2025 to 2035
USA Commercial Walk-In Refrigeration Market Size and Share Forecast Outlook 2025 to 2035
United States Commercial Refrigeration Equipment Market Forecast and Outlook 2025 to 2035
North America Commercial Refrigeration Equipment Industry Analysis by Product Type, Application, and Country through 2035
Commercial Undercounter & Worktop Refrigeration Market – Compact Cooling Solutions 2025-2035

Thank you!
You will receive an email from our Business Development Manager. Please be sure to check your SPAM/JUNK folder too.
Chat With
MaRIA