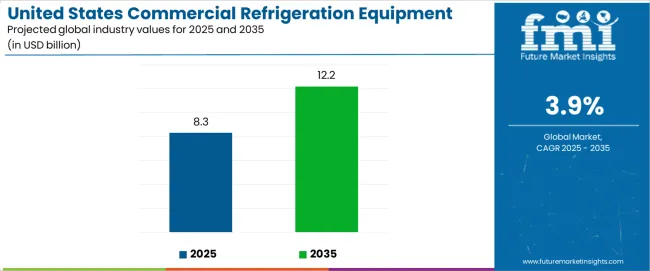
The United States Commercial Refrigeration Equipment Market is estimated to be valued at USD 8363.6 million in 2025 and is projected to reach USD 12033.5 million by 2035, registering a compound annual growth rate (CAGR) of 3.7% over the forecast period.
The United States commercial refrigeration equipment market is witnessing consistent growth, driven by the expansion of the food retail sector, rising demand for frozen and chilled products, and increasing emphasis on energy-efficient cooling solutions. Retail modernization, the proliferation of convenience stores, and the growth of cold chain logistics have significantly contributed to market expansion.
Manufacturers are focusing on the development of advanced systems featuring digital temperature monitoring, eco-friendly refrigerants, and improved thermal insulation to meet stringent environmental regulations. The ongoing shift toward sustainable operations has also encouraged the adoption of equipment compliant with low-global-warming-potential standards.
Moreover, growth in the foodservice and hospitality industries continues to boost installations across supermarkets, restaurants, and quick-service chains. As consumers increasingly prefer ready-to-eat and perishable food items, the market is expected to experience sustained demand, with continuous innovation in automation and energy optimization shaping future competitiveness.

| Metric | Value |
|---|---|
| United States Commercial Refrigeration Equipment Market Estimated Value in (2025 E) | USD 8363.6 million |
| United States Commercial Refrigeration Equipment Market Forecast Value in (2035 F) | USD 12033.5 million |
| Forecast CAGR (2025 to 2035) | 3.7% |
The market is segmented by Product Type and Application and region. By Product Type, the market is divided into Refrigerated Display Cases, Beverage Refrigeration Equipment, Transportation Refrigeration Systems, Refrigerator & Freezers, Ice Machines, and Refrigerated Vending Machines. In terms of Application, the market is classified into Food Retail, Food Services, Food And Beverage Production, Logistics And Transportation, and Food And Beverage Distribution. Regionally, the market is classified into North America, Latin America, Western Europe, Eastern Europe, Balkan & Baltic Countries, Russia & Belarus, Central Asia, East Asia, South Asia & Pacific, and the Middle East & Africa.

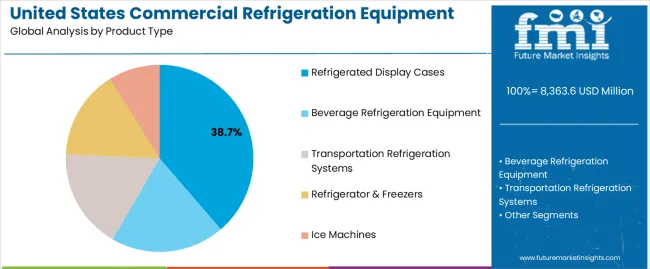
The refrigerated display cases segment holds approximately 38.7% share in the product type category, driven by its critical role in maintaining product visibility and freshness across retail environments. These units are widely deployed in supermarkets, hypermarkets, and convenience stores to showcase perishable items such as dairy, beverages, and frozen foods. The segment benefits from innovations in design and energy efficiency, including LED lighting, glass door optimization, and advanced compressor technologies that reduce power consumption.
Retailers are increasingly adopting display cases that align with aesthetic and sustainability standards, supporting long-term operational savings. Growth is further supported by the rise of self-service store formats and evolving merchandising strategies emphasizing product presentation.
With regulatory frameworks encouraging eco-friendly refrigerants and digital controls, refrigerated display cases are projected to maintain their leading share in the U.S. market.
The food retail segment dominates the application category with approximately 42.3% share, owing to the expanding footprint of supermarkets and the growing popularity of convenience-based shopping formats. Increasing consumer reliance on chilled and frozen products, coupled with the rise of e-grocery delivery networks, has amplified refrigeration infrastructure needs across retail outlets.
Continuous demand for temperature consistency, product safety, and extended shelf life has driven investments in advanced refrigeration systems. The segment’s growth is further enhanced by modernization initiatives, including smart refrigeration and centralized monitoring systems that ensure regulatory compliance and operational efficiency.
With ongoing urbanization and consumer demand for freshness, the food retail segment is anticipated to remain the cornerstone of commercial refrigeration deployment across the United States.
The section provides a detailed segmentation analysis of commercial refrigeration equipment demand in the United States. The analysis focuses on the industry share in 2025, prevailing trends, and factors driving the dominance of these segments in the United States commercial refrigeration equipment industry.
| Attributes | Details |
|---|---|
| Based on Product Type | Transportation Refrigerators |
| Industry Share in 2025 | 30.50% |
With a commanding 30.50% share in 2025, transportation refrigerators dominate the commercial refrigeration equipment market in the United States.
| Attributes | Details |
|---|---|
| By Application | Food Services |
| Industry Share in 2025 | 27.80% |
Comprising a 27.80% share in 2025, food services are set to emerge as an important segment within the United States commercial refrigeration equipment industry.
Energy Efficiency and Sustainability
A prominent trend driving the adoption of commercial refrigeration equipment in the United States is the heightened focus on energy efficiency and sustainability. Businesses are increasingly seeking refrigeration solutions that meet stringent environmental regulations and contribute to reduced energy consumption. The integration of eco-friendly refrigerants, advanced insulation materials, and energy-efficient compressors reflects this trend. Companies are aligning their offerings to cater to the growing demand for environmentally responsible solutions.
Rising Demand in eCommerce and Cold Chain Logistics
The growth of eCommerce and the increasing demand for efficient cold chain logistics directly impact the adoption of commercial refrigeration equipment. With more consumers relying on online grocery shopping, there is a heightened requirement for advanced refrigeration solutions. Additionally, the need for temperature-controlled transportation of perishable goods further emphasizes this demand. Companies are aligning their product offerings to cater to the expanding cold chain logistics sector. They are integrating features that ensure the integrity of products during transportation and storage.
Retrofitting and Upgradation Services
Rather than opting for entirely new refrigeration systems, businesses are increasingly turning to retrofitting and upgrading services. This trend is driven by a desire to enhance the efficiency of existing equipment, reduce energy consumption, and meet evolving regulatory requirements. Companies specializing in retrofitting solutions are witnessing increased demand. They now provide cost-effective alternatives for businesses looking to modernize their refrigeration infrastructure without significant capital investment.
The section includes the region-wise analysis of the commercial refrigeration equipment industry in the United States through 2035, including the Northeast United States, Midwest United States, West United States, and the South United States.
| Region | Forecasted CAGR from 2025 to 2035 |
|---|---|
| Northeast United States | 6.2% |
| Midwest United States | 6.1% |
| West United States | 5.8% |
| South United States | 5.7% |
The Northeast United States commercial refrigeration equipment industry is set to experience a CAGR of 6.2% through 2035.
The industry in the Midwest United States is poised to witness a steady CAGR of 6.1% through 2035.
The West United States commercial refrigeration equipment industry is set to exhibit a CAGR of 5.8% through 2035.
The industry in the South United States is projected to register a stable CAGR of 5.7% through 2035.

Leading companies are leveraging innovation to maintain their industry dominance. Continuous investment in research and development enables the introduction of energy-efficient and eco-friendly refrigeration solutions, meeting stringent regulatory requirements.
Collaborations and partnerships between equipment manufacturers and technology providers are on the rise. These strategic alliances aim to integrate smart technologies, data analytics, and IoT capabilities into commercial refrigeration systems, enhancing efficiency and performance.
Companies increasingly adopt a customer-centric approach, offering customized solutions to meet specific requirements. This trend emphasizes flexibility, allowing businesses to choose commercial refrigeration equipment tailored to their unique operational demands.
Sustainability has become a key differentiator. Industry leaders are integrating environmentally friendly practices into their manufacturing processes and product offerings. This aligns with the growing demand for sustainable solutions and reflects a commitment to reducing the overall environmental impact of commercial refrigeration.
Recent Developments by Companies Manufacturing Commercial Refrigeration Equipment in the United States
| Report Attributes | Details |
|---|---|
| Current Total Market Size (2025) | USD 8,049.70 million |
| Projected Market Size (2035) | USD 11,801.44 million |
| CAGR (2025 to 2035) | 3.90% |
| Base Year for Estimation | 2025 |
| Historical Period | 2020 to 2025 |
| Projections Period | 2025 to 2035 |
| Quantitative Units | USD million for value and thousand units for volume |
| Product Types Analyzed (Segment 1) | Refrigerated Display Cases, Beverage Refrigeration Equipment, Drinking Fountain, Soda Fountain, Beverage Dispensing Equipment, Beer Dispensing Equipment, Transportation Refrigeration Systems (Shipping Container Systems, Trailer Refrigeration, Truck Refrigeration Systems), Refrigerator & Freezers (Walk-in Refrigerators, Reach-in Refrigerators), Ice Machines, Refrigerated Vending Machines |
| Applications Analyzed (Segment 2) | Food Services, Restaurants, Convenience Stores, Food Retail, Food and Beverage Production, Logistics and Transportation, Food and Beverage Distribution |
| Regions Covered | United States (by state segmentation or national scope) |
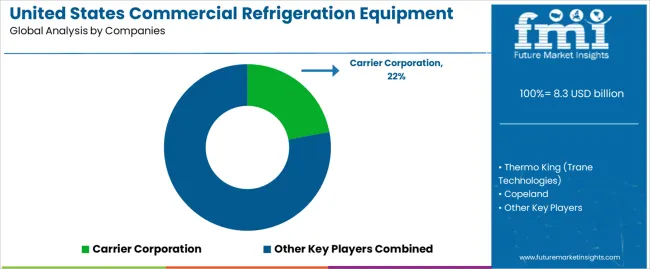
| Key Players influencing the USA Commercial Refrigeration Equipment Market | Carrier Corporation, Dover Corporation, Hussmann Corporation, Johnson Controls International plc, Emerson Electric Co., United Technologies Corporation, Manitowoc Company, Inc., True Manufacturing Company |
| Additional Attributes | Dollar sales by product type (transport refrigeration, walk-ins), Food retail and restaurant infrastructure expansion, Demand growth in last-mile cold chain delivery, Trends in energy-efficient and eco-friendly refrigeration technologies, Regulatory developments on refrigerants and emissions |
| Customization and Pricing | Customization and Pricing Available on Request |
The global united states commercial refrigeration equipment market is estimated to be valued at USD 8,363.6 million in 2025.
The market size for the united states commercial refrigeration equipment market is projected to reach USD 12,033.5 million by 2035.
The united states commercial refrigeration equipment market is expected to grow at a 3.7% CAGR between 2025 and 2035.
The key product types in united states commercial refrigeration equipment market are refrigerated display cases, beverage refrigeration equipment, _drinking fountain, _soda fountain, _beverage dispensing equipment, _beer dispensing equipment, transportation refrigeration systems, _shipping container systems, _trailer refrigeration, _truck refrigeration systems, refrigerator & freezers, _walk-in refrigerators, _reach-in refrigerators, ice machines and refrigerated vending machines.
In terms of application, food retail segment to command 42.3% share in the united states commercial refrigeration equipment market in 2025.


Full Research Suite comprises of:
Market outlook & trends analysis
Interviews & case studies
Strategic recommendations
Vendor profiles & capabilities analysis
5-year forecasts
8 regions and 60+ country-level data splits
Market segment data splits
12 months of continuous data updates
DELIVERED AS:
PDF EXCEL ONLINE
United Kingdom Interesterified Fats Market Size and Share Forecast Outlook 2025 to 2035
United Kingdom Car Rental Market Analysis – Growth, Applications & Outlook 2025–2035
United Kingdom (UK) Veneered Panels Market Analysis & Insights for 2025 to 2035
United Kingdom Women's Footwear Market Trends-Growth & Industry Outlook 2025 to 2035
United Kingdom Automotive Turbocharger Market Outlook – Share, Growth & Forecast 2025–2035
United Kingdom Yeast Market Analysis – Size, Share & Forecast 2025–2035
United Kingdom Green and Bio-based Polyol Market Analysis – Size, Share & Forecast 2025–2035
United Kingdom Natural Food Color Market Outlook – Share, Growth & Forecast 2025–2035
United Kingdom Coated Fabrics Market Insights – Demand, Size & Industry Trends 2025–2035
United Kingdom Barite Market Analysis – Size, Share & Forecast 2025–2035
UK Curtain Walling Market Report - Growth, Demand & Forecast 2025 to 2035
United Kingdom Flare Gas Recovery System Market Analysis – Size, Share & Forecast 2025–2035
United Kingdom Electric Golf Cart Market Growth – Demand, Trends & Forecast 2025–2035
United Kingdom Magnetic Separator Market Analysis – Size, Share & Forecast 2025-2035
UK River Cruise Market Analysis - Growth & Forecast 2025 to 2035
Competitive Breakdown of the United Kingdom Car Rental Market
United Kingdom Respiratory Inhaler Devices Market Growth – Demand, Trends & Forecast 2025 to 2035
United Kingdom Generic Injectable Market Trends – Size, Share & Growth 2025-2035
United Kingdom Zeolite for Detergent Market Analysis – Growth, Applications & Outlook 2025-2035
United Kingdom Absorbable Tissue Spacer Market Outlook – Share, Growth & Forecast 2025-2035

Thank you!
You will receive an email from our Business Development Manager. Please be sure to check your SPAM/JUNK folder too.
Chat With
MaRIA