Reports

- Global Locations -

Headquarters

Future Market Insights, Inc.

Christiana Corporate, 200
Continental Drive, Suite 401,
Newark, Delaware - 19713,
United States

T: +1-845-579-5705

Americas

Future Market Insights, Inc.

616 Corporate Way, Suite 2-9018,
Valley Cottage, NY 10989, United States

T: +1-347-918-3531

MEA

Future Market Insights

1602-6 Jumeirah Bay X2 Tower, Plot No: JLT-PH2-X2A,
Jumeirah Lakes Towers, Dubai,
United Arab Emirates

Europe

Future Market Insights

3rd Floor, 207 Regent Street,
W1B 3HH London
United Kingdom

T: + 44 (0) 20 8123 9659
D: +44 (0) 20 3287 4268

Asia Pacific

Future Market Insights

IndiaLand Global Tech Park, Unit UG-1, Behind Grand HighStreet, Phase 1, Hinjawadi, MH, Pune – 411057, India

Refrigeration Oil Market Outlook

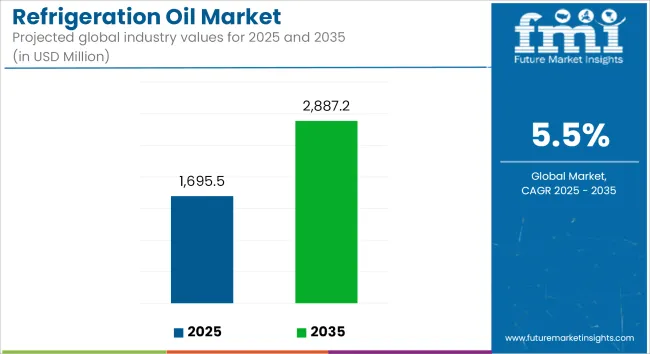
The refrigeration oil market size is projected to be valued at US$ 1,425.9 million in 2023 and is expected to rise to US$ 2,332.9 million by 2033. The sales of refrigeration oil are expected to grow at a significant CAGR of 4.9% during the forecast period.

Increased consumption of refrigeration oil in different applications such as in air conditioning systems, refrigerating systems, freezers, coolers, chillers & others, is expected to push sales. Considering this, Future Market Insights (FMI) estimates the global refrigeration oil market will reach a valuation of US$ 2,209.9 Million by 2032.

As consumption of packaged food products and sales of frozen meat surges across the globe, the adoption of refrigeration systems is predicted to burgeon in the food & beverage industry. These frozen food products require low temperatures as they are perishable items. To ensure product quality, end users are increasing the adoption of refrigeration oil, fueling sales.

As per Future Market Insights (FMI), in terms of end users, the industrial segment is anticipated to witness the fastest growth over the forecast period, followed by the commercial sector. However, with the burgeoning adoption of energy-efficient air conditioners in residences, the demand for refrigeration oil in the residential segment will rise at a robust pace.

Attribute Details
Refrigeration Oil Market Estimated Size (2023) US$ 1,425.9 million
Refrigeration Oil Market CAGR (2023 to 2033) 4.9%
Refrigeration Oil Market Forecasted Size (2033) US$ 2,332.9 million

Don't pay for what you don't need

Customize your report by selecting specific countries or regions and save 30%!

2018 to 2022 Refrigeration Oil Market Outlook in Comparison to 2023 to 2033 Growth Forecast

As per FMI, the sales of refrigeration oil increased at a 4.1% CAGR between 2018 and 2022. Growth in the market is underpinned by surging applications in the industrial and residential sectors. Also, the rising utilization of refrigeration oil in coolers, condensers, and refrigerators in residential and industrial sectors will fuel the sales in the market.

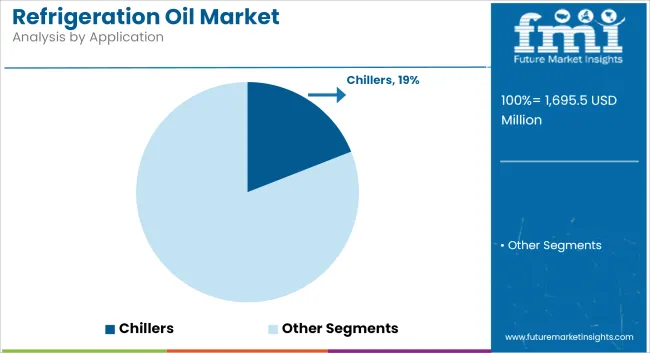
In the forecast period (2023 to 2033), the air conditioning segment is expected to lead the global refrigeration oil market, followed by refrigerating systems and coolers & chillers. Also, the expansion of the food & beverage industry coupled with the rising application of warehouses and logistics are expected to drive the demand in the market.

Some of the key factors expected to boost demand for refrigeration oil over the forecast period include an increase in food and beverage production and an expansion of cold chain capacities to reduce food loss at the production and distribution levels.

Increasing demand for meat products is mainly attributed to changing food preferences and demand for pre-cooked meals across the globe. This is anticipated to expand the cold storage capacities and expansion of refrigerated distribution to minimize loss at the distribution level. This, in turn, is fueling the demand for various refrigerated systems such as large refrigerated trucks and trailers.

Moreover, refrigeration oil plays an important role such as lubrication in refrigeration systems for better performance. Thus, the growing demand for refrigeration systems is expected to spur sales in the refrigeration oil market during the forecast period.

What are the Key Factors Augmenting Demand in Refrigeration Oil Market?

Growing Adoption of HVAC & R Systems in the Healthcare Sector to Push Sales

Advancements in treatment, increasing prevalence of chronic diseases, and favorable government initiatives to improve healthcare infrastructure are some of the factors accelerating sales in the refrigeration oil market.

In line with this, pharmaceutical companies, biotechnology research companies, and hospitals are involved in research and development (such as vaccine development, drug designing, and development) to reduce the global burden of diseases such as AIDS, diabetes, etc. s, and biotechnology research companies, and hospitals are involved in research and development (such as vaccine development, drug designing, and development) to reduce the global burden of diseases such as AIDS, diabetes, etc.

Hence, leading healthcare organizations and companies are developing clean rooms which are operated under controlled environments with very low levels of pollutants. To maintain a clean environment, clean rooms are connected with HVAC & R (heating, ventilation, air conditioning, and refrigeration) systems.

Hence, in research labs where HVAC & R systems are in operation, refrigeration oil is needed to maintain the operation of systems. Backed by the increasing number of HVAC & R systems in the healthcare sector, the refrigeration oil market will gain impetus over the forecast period.

Nikhil Kaitwade
Nikhil Kaitwade

Principal Consultant

Talk to Analyst

Find your sweet spots for generating winning opportunities in this market.

What are the Factors Limiting the Sales in Refrigeration Oil Market?

Complexity & Incompatibility of Refrigeration Systems Might Impede the Growth

Refrigeration oil is primarily used for reducing friction losses and transferring heat and also acts as a sealant. For the proper functioning of compressor systems, refrigeration oil compatibility with refrigerants is necessary in terms of viscosity, solubility, miscibility, and chemical stability. Moreover, the choice of refrigeration oil depends on the design of air conditioners, refrigerators, chillers, and compressors.

In addition to this, some synthetic oil is not miscible with natural refrigerants, while some mineral oils are not miscible with synthetic refrigerants. Thus, while designing a refrigeration system, the process becomes complex due to the compatibility of refrigeration oil with refrigerants. This can be one of the major challenges for the growth of the refrigeration oil market during the forecast period.

Comparative View of the Adjacent Markets

Refrigeration Oils Market:

Attributes Refrigeration Oil Market
CAGR (2023 to 2033) 4.9%
Market Value (2033) US 2,332.9 million
Growth Factor Growth in the market is underpinned by surging applications in the industrial and residential sectors
Opportunity The expansion of the food & beverage industry coupled with the rising application of warehouses and logistics are expected to drive the demand in the market.
Key Trends Increasing demand for meat products is mainly attributed to changing food preferences and demand for pre-cooked meals across the globe

Industrial Oil Market:

Attributes Industrial Oil Market
CAGR (2023 to 2033) 3.5%
Market Value (2033) US$ 92,575.6 million
Growth Factor Growing demand to enhance equipment reliability and uptime in various industries may benefit the sales of industrial oil in the coming decade.
Opportunity The power generation sector is expected to grow in recent years owing to the high demand for electricity all over the globe.
Key Trends Substantial investments and rising electrical energy consumption are expected to propel the growth of industrial oil sales.

Automotive Oil Market:

Attributes Automotive Oil Market
CAGR (2023 to 2033) 2.6%
Market Value (2033) US$ 69,185.3 million
Growth Factor The high popularity of synthetic automotive lubricants can be attributed to their superior performance and long-lasting protection.
Opportunity Spurring production of the medium, light, heavy automotive, and passenger vehicles is bolstering the sales of automotive oil
Key Trends Internal combustion engines are frequently lubricated with engine oils, which are primarily made up of 75%-90% of basic oils and 10%-25% of additives. These additives are extensively used in the automobile and other transportation sectors worldwide.

Get the data you need at a Fraction of the cost

Personalize your report by choosing insights you need
and save 40%!

Category-wise Insights of the Refrigeration Oil Market

Which Refrigeration Type is Forecasted to Gain Prominent Market Share?

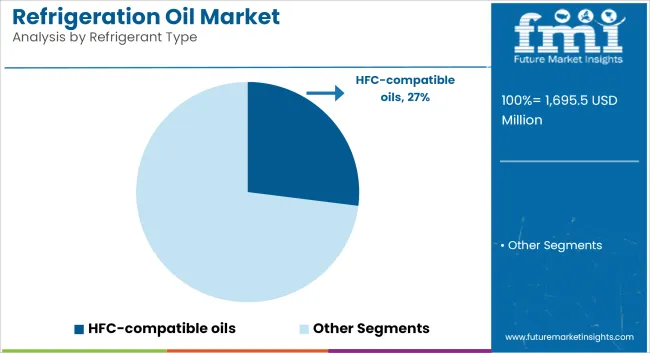
HFCs (hydro-fluorocarbons) play a crucial role in the refrigeration oil market, holding a significant share of 36.3%, and are widely used refrigerants in various cooling and refrigeration systems. HFCs are chosen as alternatives to ozone-depleting substances due to their lower environmental impact. The demand for refrigeration oil is closely linked to the adoption of HFCs, as lubricants specifically formulated for HFC-based systems are essential for proper lubrication and efficient operation. These refrigeration oils offer excellent lubrication properties, thermal stability, and compatibility with HFC refrigerants. With increasing environmental regulations and a focus on sustainable refrigeration solutions, the demand for refrigeration oils compatible with HFCs is expected to remain strong. Manufacturers continue to develop high-quality refrigeration oils that provide optimal performance while complying with environmental standards.

Refrigerators/Freezers Hold a Significant Share of 31.5% in the Application of Refrigeration Oil Market, Representing Their Extensive Usage in Both Residential and Commercial Sectors.

These essential appliances require proper lubrication to ensure efficient and reliable operation. Refrigeration oil plays a vital role in lubricating compressors and other system components, facilitating heat transfer, and maintaining optimal performance. In the residential sector, refrigerators are crucial for preserving food and extending its shelf life. Similarly, the commercial sector, including restaurants, supermarkets, and cold storage facilities, heavily relies on refrigerators and freezers to maintain perishable goods at the required temperatures. With increasing consumer demand for energy-efficient and environmentally friendly appliances, there is a growing need for high-quality refrigeration oil in refrigerators and freezers. Manufacturers are developing lubricants that offer excellent performance, improved energy efficiency, and compatibility with various refrigerants. Moreover, stringent regulations and standards focusing on energy efficiency and environmental impact have further influenced the demand for suitable refrigeration oils in these applications.

Regional Analysis of Refrigeration Oil Market

What is the Demand Outlook in the USA Refrigeration Oil Market?

Increased Research and Development in Automotive and Oil & Gas Sectors to Boost the USA Refrigeration Oil Market

According to FMI, the USA is expected to account for a substantial share of the North American refrigeration oil market. Over the forecast period, the USA is expected to emerge as an attractive market in North America owing to the ongoing investment & development in the country.

With surging investment for research in diverse industries such as automotive, oil and gas, infrastructure, chemical, and electronics, among others. Continuous advancements and increased research and development (R&D) in the pharmaceutical industry are driving the demand for laboratory refrigeration systems.

Furthermore, these systems are critical in extending the life of vaccines, drugs, and other medicinal supplies. On the back of these factors, the USA is expected to hold a prominent value share of 15.3% in the refrigeration oil market in 2022.

How Big Is the Opportunity for Refrigeration Oil Market in Germany?

Germany Refrigeration Oil Market to Gain from Extensive Spending on Drug Development

Germany is projected to hold around 6.1% of the demand share in the Europe refrigeration oil market, as per FMI. Germany is expected to present stiff competition for global manufacturers in terms of export quantities and pricing. Germany is one of the developed countries in Europe, where the healthcare system and pharmaceutical industry are continuously expanding with extensive research & development.

Factors such as increased spending on drug development will aid the demand for refrigeration systems to store drugs and vaccines. Further, the need for air conditioner systems and refrigerators will cushion the growth in the refrigeration oil market during the forecast period. Furthermore, the rising emphasis of manufacturers on R&D activities to develop innovative products at low cost is expected to create numerous opportunities for the market.

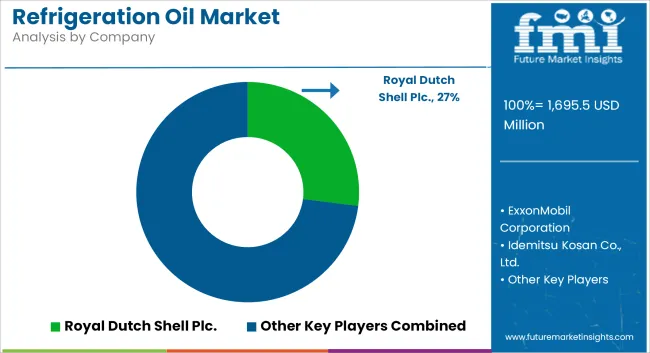
The Refrigeration Oil market is highly competitive, with several key players vying for market share

Manufacturers have shifted their focus to emerging countries in recent years to meet the growing demand for refrigeration oil. Several key players are focusing on improving their manufacturing capabilities, Research and Development investments, collaborative partnerships, and expansion of production capacities.

Furthermore, these key players are focusing on strengthening their sales channels to meet the growing demand for refrigeration oil around the world.

  • Chevron Phillips Chemical Co. declared its plan to expand the production of low-viscosity polyalphaolefin in its Cedar Bayou plant in Baytown, Texas, by 10,000 metric tons per year.
  • BASF SE announced to invest double-digit million euros in their new production plant facility dedicated to the production of polyethylene glycol (PAG)-based lubricants at its Ludwigshafen site.
  • LABIX Company-a joint venture between Japan-based Mitsui and a fully-owned subsidiary of Thai Oil Public Company- commenced production of linear alkylbenzene in Chonburi Province, Thailand.

Scope of the Report

Attribute Details
Growth Rate CAGR of 4.9% from 2023 to 2033
Base Year of Estimation 2023
Historical Data 2018 to 2022
Forecast Period 2023 to 2033
Quantitative Units Revenue in US$ Billion and Volume in Units and F-CAGR from 2022 to 2032
Report Coverage Revenue Forecast, Volume Forecast, Company Ranking, Competitive Landscape, growth factors, Trends, and Pricing Analysis
Key Segments Covered
  • Technology
  • Product Type
  • Refrigerant Type
  • Application
  • End User
  • By Region
Regions Covered
  • North America
  • Latin America
  • Europe
  • East Asia
  • South Asia
  • Middle East & Africa
  • Oceania
Key Countries Profiled
  • USA
  • Canada
  • Brazil
  • Mexico
  • Germany
  • Italy
  • France
  • United Kingdom
  • Spain
  • Russia
  • China
  • Japan
  • India
  • GCC Countries
  • Australia
Key Companies Profiled
  • ExxonMobil Corporation
  • Shell Plc
  • Idemitsu Kosan Co., Ltd.
  • MEIWA CORPORATION
  • CPI Fluid Engineering (Part of The Lubrizol Corporation)
  • FUCHS Lubricants (Part of FUCHS Petrolub SE)
  • Chevron Phillips Chemical Company LLC
  • Performance Chemicals (Division of BASF SE)
Customization & Pricing Available upon Request

Key Segments Covered in the Refrigeration Oil Market Report

By Product Type:

  • Mineral Oil
  • Synthetic Oil
    • Polyol Ester
    • Poly Alpha Olefin
    • Alkyl Benzene
    • Polyethylene Glycol
    • Polyvinyl ether
    • Others (Phenol Propoxylate oil)

By Refrigerant Type:

  • Chlorofluorocarbon (CFC)
  • Hydro-chlorofluorocarbon (HCFC)
  • Hydro-fluorocarbon (HFC)
  • Ammonia
  • Others

By End User:

  • Industrial
  • Commercial
  • Residential
  • By Application:
  • Air Conditioners
  • Coolers
  • Chillers
  • Refrigerators/Freezers
  • Condensers
  • Others (Ice Machines etc)

By Region:

  • North America
  • Latin America
  • Western Europe
  • Eastern Europe
  • Asia Pacific excluding Japan (APEJ)
  • Japan
  • Middle East & Africa (MEA)

Frequently Asked Questions

What is the Estimated Market Value in 2023?

The global market is estimated to be valued at US$ 1,425.9 million in 2023.

What is the Growth Outlook of the Market?

The market is likely to grow at a CAGR of 4.9% from 2023 to 2033.

What is the Projected Value of the Market by 2032?

The market is projected to reach a valuation of US$ 2,209.9 million by 2033.

Table of Content

1. Executive Summary

    1.1. Global Market Outlook

    1.2. Demand-side Trends

    1.3. Supply-side Trends

    1.4. Technology Roadmap Analysis

    1.5. Analysis and Recommendations

2. Market Overview

    2.1. Market Coverage / Taxonomy

    2.2. Market Definition / Scope / Limitations

3. Market Background

    3.1. Market Dynamics

        3.1.1. Drivers

        3.1.2. Restraints

        3.1.3. Opportunity

        3.1.4. Trends

    3.2. Scenario Forecast

        3.2.1. Demand in Optimistic Scenario

        3.2.2. Demand in Likely Scenario

        3.2.3. Demand in Conservative Scenario

    3.3. Opportunity Map Analysis

    3.4. Product Life Cycle Analysis

    3.5. Supply Chain Analysis

        3.5.1. Supply Side Participants and their Roles

            3.5.1.1. Producers

            3.5.1.2. Mid-Level Participants (Traders/ Agents/ Brokers)

            3.5.1.3. Wholesalers and Distributors

        3.5.2. Value Added and Value Created at Node in the Supply Chain

        3.5.3. List of Raw Material Suppliers

        3.5.4. List of Existing and Potential Buyer’s

    3.6. Investment Feasibility Matrix

    3.7. Value Chain Analysis

        3.7.1. Profit Margin Analysis

        3.7.2. Wholesalers and Distributors

        3.7.3. Retailers

    3.8. PESTLE and Porter’s Analysis

    3.9. Regulatory Landscape

        3.9.1. By Key Regions

        3.9.2. By Key Countries

    3.10. Regional Parent Market Outlook

    3.11. Production and Consumption Statistics

    3.12. Import and Export Statistics

4. Global Market Analysis 2017 to 2022 and Forecast, 2023 to 2033

    4.1. Historical Market Size Value (US$ Million) & Volume (Tons) Analysis, 2017 to 2022

    4.2. Current and Future Market Size Value (US$ Million) & Volume (Tons) Projections, 2023 to 2033

        4.2.1. Y-o-Y Growth Trend Analysis

        4.2.2. Absolute $ Opportunity Analysis

5. Global Market Analysis 2017 to 2022 and Forecast 2023 to 2033, By Product Type

    5.1. Introduction / Key Findings

    5.2. Historical Market Size Value (US$ Million) & Volume (Tons) Analysis By Product Type, 2017 to 2022

    5.3. Current and Future Market Size Value (US$ Million) & Volume (Tons) Analysis and Forecast By Product Type, 2023 to 2033

        5.3.1. Mineral Oil

        5.3.2. Synthetic Oil

            5.3.2.1. Polyol Ester

            5.3.2.2. Poly Alpha Olefin

            5.3.2.3. Alkyl Benzene

            5.3.2.4. Polyethylene Glycol

            5.3.2.5. Polyvinyl ether

            5.3.2.6. Others

    5.4. Y-o-Y Growth Trend Analysis By Product Type, 2017 to 2022

    5.5. Absolute $ Opportunity Analysis By Product Type, 2023 to 2033

6. Global Market Analysis 2017 to 2022 and Forecast 2023 to 2033, By Refrigerant Type

    6.1. Introduction / Key Findings

    6.2. Historical Market Size Value (US$ Million) & Volume (Tons) Analysis By Refrigerant Type, 2017 to 2022

    6.3. Current and Future Market Size Value (US$ Million) & Volume (Tons) Analysis and Forecast By Refrigerant Type, 2023 to 2033

        6.3.1. Chlorofluorocarbon (CFC)

        6.3.2. Hydro-chlorofluorocarbon (HCFC)

        6.3.3. Hydro-fluorocarbon(HFC)

        6.3.4. Ammonia

        6.3.5. Others

    6.4. Y-o-Y Growth Trend Analysis By Refrigerant Type, 2017 to 2022

    6.5. Absolute $ Opportunity Analysis By Refrigerant Type, 2023 to 2033

7. Global Market Analysis 2017 to 2022 and Forecast 2023 to 2033, By End User

    7.1. Introduction / Key Findings

    7.2. Historical Market Size Value (US$ Million) & Volume (Tons) Analysis By End User, 2017 to 2022

    7.3. Current and Future Market Size Value (US$ Million) & Volume (Tons) Analysis and Forecast By End User, 2023 to 2033

        7.3.1. Industrial

        7.3.2. Commercial

        7.3.3. Residential

    7.4. Y-o-Y Growth Trend Analysis By End User, 2017 to 2022

    7.5. Absolute $ Opportunity Analysis By End User, 2023 to 2033

8. Global Market Analysis 2017 to 2022 and Forecast 2023 to 2033, By Application

    8.1. Introduction / Key Findings

    8.2. Historical Market Size Value (US$ Million) & Volume (Tons) Analysis By Application, 2017 to 2022

    8.3. Current and Future Market Size Value (US$ Million) & Volume (Tons) Analysis and Forecast By Application, 2023 to 2033

        8.3.1. Air Conditioners

        8.3.2. Coolers

        8.3.3. Chillers

        8.3.4. Refrigerators/Freezers

        8.3.5. Condensers

        8.3.6. Others

    8.4. Y-o-Y Growth Trend Analysis By Application, 2017 to 2022

    8.5. Absolute $ Opportunity Analysis By Application, 2023 to 2033

9. Global Market Analysis 2017 to 2022 and Forecast 2023 to 2033, By Region

    9.1. Introduction

    9.2. Historical Market Size Value (US$ Million) & Volume (Tons) Analysis By Region, 2017 to 2022

    9.3. Current Market Size Value (US$ Million) & Volume (Tons) Analysis and Forecast By Region, 2023 to 2033

        9.3.1. North America

        9.3.2. Latin America

        9.3.3. Western Europe

        9.3.4. Eastern Europe

        9.3.5. South Asia and Pacific

        9.3.6. East Asia

        9.3.7. Middle East and Africa

    9.4. Market Attractiveness Analysis By Region

10. North America Market Analysis 2017 to 2022 and Forecast 2023 to 2033, By Country

    10.1. Historical Market Size Value (US$ Million) & Volume (Tons) Trend Analysis By Market Taxonomy, 2017 to 2022

    10.2. Market Size Value (US$ Million) & Volume (Tons) Forecast By Market Taxonomy, 2023 to 2033

        10.2.1. By Country

            10.2.1.1. The USA

            10.2.1.2. Canada

        10.2.2. By Product Type

        10.2.3. By Refrigerant Type

        10.2.4. By End User

        10.2.5. By Application

    10.3. Market Attractiveness Analysis

        10.3.1. By Country

        10.3.2. By Product Type

        10.3.3. By Refrigerant Type

        10.3.4. By End User

        10.3.5. By Application

    10.4. Key Takeaways

11. Latin America Market Analysis 2017 to 2022 and Forecast 2023 to 2033, By Country

    11.1. Historical Market Size Value (US$ Million) & Volume (Tons) Trend Analysis By Market Taxonomy, 2017 to 2022

    11.2. Market Size Value (US$ Million) & Volume (Tons) Forecast By Market Taxonomy, 2023 to 2033

        11.2.1. By Country

            11.2.1.1. Brazil

            11.2.1.2. Mexico

            11.2.1.3. Rest of Latin America

        11.2.2. By Product Type

        11.2.3. By Refrigerant Type

        11.2.4. By End User

        11.2.5. By Application

    11.3. Market Attractiveness Analysis

        11.3.1. By Country

        11.3.2. By Product Type

        11.3.3. By Refrigerant Type

        11.3.4. By End User

        11.3.5. By Application

    11.4. Key Takeaways

12. Western Europe Market Analysis 2017 to 2022 and Forecast 2023 to 2033, By Country

    12.1. Historical Market Size Value (US$ Million) & Volume (Tons) Trend Analysis By Market Taxonomy, 2017 to 2022

    12.2. Market Size Value (US$ Million) & Volume (Tons) Forecast By Market Taxonomy, 2023 to 2033

        12.2.1. By Country

            12.2.1.1. Germany

            12.2.1.2. United Kingdom

            12.2.1.3. France

            12.2.1.4. Spain

            12.2.1.5. Italy

            12.2.1.6. Rest of Western Europe

        12.2.2. By Product Type

        12.2.3. By Refrigerant Type

        12.2.4. By End User

        12.2.5. By Application

    12.3. Market Attractiveness Analysis

        12.3.1. By Country

        12.3.2. By Product Type

        12.3.3. By Refrigerant Type

        12.3.4. By End User

        12.3.5. By Application

    12.4. Key Takeaways

13. Eastern Europe Market Analysis 2017 to 2022 and Forecast 2023 to 2033, By Country

    13.1. Historical Market Size Value (US$ Million) & Volume (Tons) Trend Analysis By Market Taxonomy, 2017 to 2022

    13.2. Market Size Value (US$ Million) & Volume (Tons) Forecast By Market Taxonomy, 2023 to 2033

        13.2.1. By Country

            13.2.1.1. Poland

            13.2.1.2. Russia

            13.2.1.3. Czech Republic

            13.2.1.4. Romania

            13.2.1.5. Rest of Eastern Europe

        13.2.2. By Product Type

        13.2.3. By Refrigerant Type

        13.2.4. By End User

        13.2.5. By Application

    13.3. Market Attractiveness Analysis

        13.3.1. By Country

        13.3.2. By Product Type

        13.3.3. By Refrigerant Type

        13.3.4. By End User

        13.3.5. By Application

    13.4. Key Takeaways

14. South Asia and Pacific Market Analysis 2017 to 2022 and Forecast 2023 to 2033, By Country

    14.1. Historical Market Size Value (US$ Million) & Volume (Tons) Trend Analysis By Market Taxonomy, 2017 to 2022

    14.2. Market Size Value (US$ Million) & Volume (Tons) Forecast By Market Taxonomy, 2023 to 2033

        14.2.1. By Country

            14.2.1.1. India

            14.2.1.2. Bangladesh

            14.2.1.3. Australia

            14.2.1.4. New Zealand

            14.2.1.5. Rest of South Asia and Pacific

        14.2.2. By Product Type

        14.2.3. By Refrigerant Type

        14.2.4. By End User

        14.2.5. By Application

    14.3. Market Attractiveness Analysis

        14.3.1. By Country

        14.3.2. By Product Type

        14.3.3. By Refrigerant Type

        14.3.4. By End User

        14.3.5. By Application

    14.4. Key Takeaways

15. East Asia Market Analysis 2017 to 2022 and Forecast 2023 to 2033, By Country

    15.1. Historical Market Size Value (US$ Million) & Volume (Tons) Trend Analysis By Market Taxonomy, 2017 to 2022

    15.2. Market Size Value (US$ Million) & Volume (Tons) Forecast By Market Taxonomy, 2023 to 2033

        15.2.1. By Country

            15.2.1.1. China

            15.2.1.2. Japan

            15.2.1.3. South Korea

        15.2.2. By Product Type

        15.2.3. By Refrigerant Type

        15.2.4. By End User

        15.2.5. By Application

    15.3. Market Attractiveness Analysis

        15.3.1. By Country

        15.3.2. By Product Type

        15.3.3. By Refrigerant Type

        15.3.4. By End User

        15.3.5. By Application

    15.4. Key Takeaways

16. Middle East and Africa Market Analysis 2017 to 2022 and Forecast 2023 to 2033, By Country

    16.1. Historical Market Size Value (US$ Million) & Volume (Tons) Trend Analysis By Market Taxonomy, 2017 to 2022

    16.2. Market Size Value (US$ Million) & Volume (Tons) Forecast By Market Taxonomy, 2023 to 2033

        16.2.1. By Country

            16.2.1.1. GCC Countries

            16.2.1.2. South Africa

            16.2.1.3. Israel

            16.2.1.4. Rest of MEA

        16.2.2. By Product Type

        16.2.3. By Refrigerant Type

        16.2.4. By End User

        16.2.5. By Application

    16.3. Market Attractiveness Analysis

        16.3.1. By Country

        16.3.2. By Product Type

        16.3.3. By Refrigerant Type

        16.3.4. By End User

        16.3.5. By Application

    16.4. Key Takeaways

17. Key Countries Market Analysis

    17.1. USA

        17.1.1. Pricing Analysis

        17.1.2. Market Share Analysis, 2022

            17.1.2.1. By Product Type

            17.1.2.2. By Refrigerant Type

            17.1.2.3. By End User

            17.1.2.4. By Application

    17.2. Canada

        17.2.1. Pricing Analysis

        17.2.2. Market Share Analysis, 2022

            17.2.2.1. By Product Type

            17.2.2.2. By Refrigerant Type

            17.2.2.3. By End User

            17.2.2.4. By Application

    17.3. Brazil

        17.3.1. Pricing Analysis

        17.3.2. Market Share Analysis, 2022

            17.3.2.1. By Product Type

            17.3.2.2. By Refrigerant Type

            17.3.2.3. By End User

            17.3.2.4. By Application

    17.4. Mexico

        17.4.1. Pricing Analysis

        17.4.2. Market Share Analysis, 2022

            17.4.2.1. By Product Type

            17.4.2.2. By Refrigerant Type

            17.4.2.3. By End User

            17.4.2.4. By Application

    17.5. Germany

        17.5.1. Pricing Analysis

        17.5.2. Market Share Analysis, 2022

            17.5.2.1. By Product Type

            17.5.2.2. By Refrigerant Type

            17.5.2.3. By End User

            17.5.2.4. By Application

    17.6. United Kingdom

        17.6.1. Pricing Analysis

        17.6.2. Market Share Analysis, 2022

            17.6.2.1. By Product Type

            17.6.2.2. By Refrigerant Type

            17.6.2.3. By End User

            17.6.2.4. By Application

    17.7. France

        17.7.1. Pricing Analysis

        17.7.2. Market Share Analysis, 2022

            17.7.2.1. By Product Type

            17.7.2.2. By Refrigerant Type

            17.7.2.3. By End User

            17.7.2.4. By Application

    17.8. Spain

        17.8.1. Pricing Analysis

        17.8.2. Market Share Analysis, 2022

            17.8.2.1. By Product Type

            17.8.2.2. By Refrigerant Type

            17.8.2.3. By End User

            17.8.2.4. By Application

    17.9. Italy

        17.9.1. Pricing Analysis

        17.9.2. Market Share Analysis, 2022

            17.9.2.1. By Product Type

            17.9.2.2. By Refrigerant Type

            17.9.2.3. By End User

            17.9.2.4. By Application

    17.10. Poland

        17.10.1. Pricing Analysis

        17.10.2. Market Share Analysis, 2022

            17.10.2.1. By Product Type

            17.10.2.2. By Refrigerant Type

            17.10.2.3. By End User

            17.10.2.4. By Application

    17.11. Russia

        17.11.1. Pricing Analysis

        17.11.2. Market Share Analysis, 2022

            17.11.2.1. By Product Type

            17.11.2.2. By Refrigerant Type

            17.11.2.3. By End User

            17.11.2.4. By Application

    17.12. Czech Republic

        17.12.1. Pricing Analysis

        17.12.2. Market Share Analysis, 2022

            17.12.2.1. By Product Type

            17.12.2.2. By Refrigerant Type

            17.12.2.3. By End User

            17.12.2.4. By Application

    17.13. Romania

        17.13.1. Pricing Analysis

        17.13.2. Market Share Analysis, 2022

            17.13.2.1. By Product Type

            17.13.2.2. By Refrigerant Type

            17.13.2.3. By End User

            17.13.2.4. By Application

    17.14. India

        17.14.1. Pricing Analysis

        17.14.2. Market Share Analysis, 2022

            17.14.2.1. By Product Type

            17.14.2.2. By Refrigerant Type

            17.14.2.3. By End User

            17.14.2.4. By Application

    17.15. Bangladesh

        17.15.1. Pricing Analysis

        17.15.2. Market Share Analysis, 2022

            17.15.2.1. By Product Type

            17.15.2.2. By Refrigerant Type

            17.15.2.3. By End User

            17.15.2.4. By Application

    17.16. Australia

        17.16.1. Pricing Analysis

        17.16.2. Market Share Analysis, 2022

            17.16.2.1. By Product Type

            17.16.2.2. By Refrigerant Type

            17.16.2.3. By End User

            17.16.2.4. By Application

    17.17. New Zealand

        17.17.1. Pricing Analysis

        17.17.2. Market Share Analysis, 2022

            17.17.2.1. By Product Type

            17.17.2.2. By Refrigerant Type

            17.17.2.3. By End User

            17.17.2.4. By Application

    17.18. China

        17.18.1. Pricing Analysis

        17.18.2. Market Share Analysis, 2022

            17.18.2.1. By Product Type

            17.18.2.2. By Refrigerant Type

            17.18.2.3. By End User

            17.18.2.4. By Application

    17.19. Japan

        17.19.1. Pricing Analysis

        17.19.2. Market Share Analysis, 2022

            17.19.2.1. By Product Type

            17.19.2.2. By Refrigerant Type

            17.19.2.3. By End User

            17.19.2.4. By Application

    17.20. South Korea

        17.20.1. Pricing Analysis

        17.20.2. Market Share Analysis, 2022

            17.20.2.1. By Product Type

            17.20.2.2. By Refrigerant Type

            17.20.2.3. By End User

            17.20.2.4. By Application

    17.21. GCC Countries

        17.21.1. Pricing Analysis

        17.21.2. Market Share Analysis, 2022

            17.21.2.1. By Product Type

            17.21.2.2. By Refrigerant Type

            17.21.2.3. By End User

            17.21.2.4. By Application

    17.22. South Africa

        17.22.1. Pricing Analysis

        17.22.2. Market Share Analysis, 2022

            17.22.2.1. By Product Type

            17.22.2.2. By Refrigerant Type

            17.22.2.3. By End User

            17.22.2.4. By Application

    17.23. Israel

        17.23.1. Pricing Analysis

        17.23.2. Market Share Analysis, 2022

            17.23.2.1. By Product Type

            17.23.2.2. By Refrigerant Type

            17.23.2.3. By End User

            17.23.2.4. By Application

18. Market Structure Analysis

    18.1. Competition Dashboard

    18.2. Competition Benchmarking

    18.3. Market Share Analysis of Top Players

        18.3.1. By Regional

        18.3.2. By Product Type

        18.3.3. By Refrigerant Type

        18.3.4. By End User

        18.3.5. By Application

19. Competition Analysis

    19.1. Competition Deep Dive

        19.1.1. ExxonMobil Corporation

            19.1.1.1. Overview

            19.1.1.2. Product Portfolio

            19.1.1.3. Profitability by Market Segments

            19.1.1.4. Sales Footprint

            19.1.1.5. Strategy Overview

                19.1.1.5.1. Marketing Strategy

                19.1.1.5.2. Product Strategy

                19.1.1.5.3. Channel Strategy

        19.1.2. Shell Plc

            19.1.2.1. Overview

            19.1.2.2. Product Portfolio

            19.1.2.3. Profitability by Market Segments

            19.1.2.4. Sales Footprint

            19.1.2.5. Strategy Overview

                19.1.2.5.1. Marketing Strategy

                19.1.2.5.2. Product Strategy

                19.1.2.5.3. Channel Strategy

        19.1.3. Idemitsu Kosan Co., Ltd.

            19.1.3.1. Overview

            19.1.3.2. Product Portfolio

            19.1.3.3. Profitability by Market Segments

            19.1.3.4. Sales Footprint

            19.1.3.5. Strategy Overview

                19.1.3.5.1. Marketing Strategy

                19.1.3.5.2. Product Strategy

                19.1.3.5.3. Channel Strategy

        19.1.4. MEIWA CORPORATION

            19.1.4.1. Overview

            19.1.4.2. Product Portfolio

            19.1.4.3. Profitability by Market Segments

            19.1.4.4. Sales Footprint

            19.1.4.5. Strategy Overview

                19.1.4.5.1. Marketing Strategy

                19.1.4.5.2. Product Strategy

                19.1.4.5.3. Channel Strategy

        19.1.5. CPI Fluid Engineering (Part of The Lubrizol Corporation)

            19.1.5.1. Overview

            19.1.5.2. Product Portfolio

            19.1.5.3. Profitability by Market Segments

            19.1.5.4. Sales Footprint

            19.1.5.5. Strategy Overview

                19.1.5.5.1. Marketing Strategy

                19.1.5.5.2. Product Strategy

                19.1.5.5.3. Channel Strategy

        19.1.6. FUCHS Lubricants (Part of FUCHS Petrolub SE)

            19.1.6.1. Overview

            19.1.6.2. Product Portfolio

            19.1.6.3. Profitability by Market Segments

            19.1.6.4. Sales Footprint

            19.1.6.5. Strategy Overview

                19.1.6.5.1. Marketing Strategy

                19.1.6.5.2. Product Strategy

                19.1.6.5.3. Channel Strategy

        19.1.7. Chevron Phillips Chemical Company LLC

            19.1.7.1. Overview

            19.1.7.2. Product Portfolio

            19.1.7.3. Profitability by Market Segments

            19.1.7.4. Sales Footprint

            19.1.7.5. Strategy Overview

                19.1.7.5.1. Marketing Strategy

                19.1.7.5.2. Product Strategy

                19.1.7.5.3. Channel Strategy

        19.1.8. Performance Chemicals (Division of BASF SE)

            19.1.8.1. Overview

            19.1.8.2. Product Portfolio

            19.1.8.3. Profitability by Market Segments

            19.1.8.4. Sales Footprint

            19.1.8.5. Strategy Overview

                19.1.8.5.1. Marketing Strategy

                19.1.8.5.2. Product Strategy

                19.1.8.5.3. Channel Strategy

        19.1.9. Eneos Holdings Inc.

            19.1.9.1. Overview

            19.1.9.2. Product Portfolio

            19.1.9.3. Profitability by Market Segments

            19.1.9.4. Sales Footprint

            19.1.9.5. Strategy Overview

                19.1.9.5.1. Marketing Strategy

                19.1.9.5.2. Product Strategy

                19.1.9.5.3. Channel Strategy

        19.1.10. National Refrigerants, Inc.

            19.1.10.1. Overview

            19.1.10.2. Product Portfolio

            19.1.10.3. Profitability by Market Segments

            19.1.10.4. Sales Footprint

            19.1.10.5. Strategy Overview

                19.1.10.5.1. Marketing Strategy

                19.1.10.5.2. Product Strategy

                19.1.10.5.3. Channel Strategy

20. Assumptions & Acronyms Used

21. Research Methodology

Don't pay for what you don't need

Customize your report by selecting specific countries or regions and save 30%!

List of Tables

Table 1: Global Market Value (US$ Million) Forecast by Region, 2017 to 2033

Table 2: Global Market Volume (Tons) Forecast by Region, 2017 to 2033

Table 3: Global Market Value (US$ Million) Forecast by Product Type, 2017 to 2033

Table 4: Global Market Volume (Tons) Forecast by Product Type, 2017 to 2033

Table 5: Global Market Value (US$ Million) Forecast by Refrigerant Type, 2017 to 2033

Table 6: Global Market Volume (Tons) Forecast by Refrigerant Type, 2017 to 2033

Table 7: Global Market Value (US$ Million) Forecast by End User, 2017 to 2033

Table 8: Global Market Volume (Tons) Forecast by End User, 2017 to 2033

Table 9: Global Market Value (US$ Million) Forecast by Application, 2017 to 2033

Table 10: Global Market Volume (Tons) Forecast by Application, 2017 to 2033

Table 11: North America Market Value (US$ Million) Forecast by Country, 2017 to 2033

Table 12: North America Market Volume (Tons) Forecast by Country, 2017 to 2033

Table 13: North America Market Value (US$ Million) Forecast by Product Type, 2017 to 2033

Table 14: North America Market Volume (Tons) Forecast by Product Type, 2017 to 2033

Table 15: North America Market Value (US$ Million) Forecast by Refrigerant Type, 2017 to 2033

Table 16: North America Market Volume (Tons) Forecast by Refrigerant Type, 2017 to 2033

Table 17: North America Market Value (US$ Million) Forecast by End User, 2017 to 2033

Table 18: North America Market Volume (Tons) Forecast by End User, 2017 to 2033

Table 19: North America Market Value (US$ Million) Forecast by Application, 2017 to 2033

Table 20: North America Market Volume (Tons) Forecast by Application, 2017 to 2033

Table 21: Latin America Market Value (US$ Million) Forecast by Country, 2017 to 2033

Table 22: Latin America Market Volume (Tons) Forecast by Country, 2017 to 2033

Table 23: Latin America Market Value (US$ Million) Forecast by Product Type, 2017 to 2033

Table 24: Latin America Market Volume (Tons) Forecast by Product Type, 2017 to 2033

Table 25: Latin America Market Value (US$ Million) Forecast by Refrigerant Type, 2017 to 2033

Table 26: Latin America Market Volume (Tons) Forecast by Refrigerant Type, 2017 to 2033

Table 27: Latin America Market Value (US$ Million) Forecast by End User, 2017 to 2033

Table 28: Latin America Market Volume (Tons) Forecast by End User, 2017 to 2033

Table 29: Latin America Market Value (US$ Million) Forecast by Application, 2017 to 2033

Table 30: Latin America Market Volume (Tons) Forecast by Application, 2017 to 2033

Table 31: Western Europe Market Value (US$ Million) Forecast by Country, 2017 to 2033

Table 32: Western Europe Market Volume (Tons) Forecast by Country, 2017 to 2033

Table 33: Western Europe Market Value (US$ Million) Forecast by Product Type, 2017 to 2033

Table 34: Western Europe Market Volume (Tons) Forecast by Product Type, 2017 to 2033

Table 35: Western Europe Market Value (US$ Million) Forecast by Refrigerant Type, 2017 to 2033

Table 36: Western Europe Market Volume (Tons) Forecast by Refrigerant Type, 2017 to 2033

Table 37: Western Europe Market Value (US$ Million) Forecast by End User, 2017 to 2033

Table 38: Western Europe Market Volume (Tons) Forecast by End User, 2017 to 2033

Table 39: Western Europe Market Value (US$ Million) Forecast by Application, 2017 to 2033

Table 40: Western Europe Market Volume (Tons) Forecast by Application, 2017 to 2033

Table 41: Eastern Europe Market Value (US$ Million) Forecast by Country, 2017 to 2033

Table 42: Eastern Europe Market Volume (Tons) Forecast by Country, 2017 to 2033

Table 43: Eastern Europe Market Value (US$ Million) Forecast by Product Type, 2017 to 2033

Table 44: Eastern Europe Market Volume (Tons) Forecast by Product Type, 2017 to 2033

Table 45: Eastern Europe Market Value (US$ Million) Forecast by Refrigerant Type, 2017 to 2033

Table 46: Eastern Europe Market Volume (Tons) Forecast by Refrigerant Type, 2017 to 2033

Table 47: Eastern Europe Market Value (US$ Million) Forecast by End User, 2017 to 2033

Table 48: Eastern Europe Market Volume (Tons) Forecast by End User, 2017 to 2033

Table 49: Eastern Europe Market Value (US$ Million) Forecast by Application, 2017 to 2033

Table 50: Eastern Europe Market Volume (Tons) Forecast by Application, 2017 to 2033

Table 51: South Asia and Pacific Market Value (US$ Million) Forecast by Country, 2017 to 2033

Table 52: South Asia and Pacific Market Volume (Tons) Forecast by Country, 2017 to 2033

Table 53: South Asia and Pacific Market Value (US$ Million) Forecast by Product Type, 2017 to 2033

Table 54: South Asia and Pacific Market Volume (Tons) Forecast by Product Type, 2017 to 2033

Table 55: South Asia and Pacific Market Value (US$ Million) Forecast by Refrigerant Type, 2017 to 2033

Table 56: South Asia and Pacific Market Volume (Tons) Forecast by Refrigerant Type, 2017 to 2033

Table 57: South Asia and Pacific Market Value (US$ Million) Forecast by End User, 2017 to 2033

Table 58: South Asia and Pacific Market Volume (Tons) Forecast by End User, 2017 to 2033

Table 59: South Asia and Pacific Market Value (US$ Million) Forecast by Application, 2017 to 2033

Table 60: South Asia and Pacific Market Volume (Tons) Forecast by Application, 2017 to 2033

Table 61: East Asia Market Value (US$ Million) Forecast by Country, 2017 to 2033

Table 62: East Asia Market Volume (Tons) Forecast by Country, 2017 to 2033

Table 63: East Asia Market Value (US$ Million) Forecast by Product Type, 2017 to 2033

Table 64: East Asia Market Volume (Tons) Forecast by Product Type, 2017 to 2033

Table 65: East Asia Market Value (US$ Million) Forecast by Refrigerant Type, 2017 to 2033

Table 66: East Asia Market Volume (Tons) Forecast by Refrigerant Type, 2017 to 2033

Table 67: East Asia Market Value (US$ Million) Forecast by End User, 2017 to 2033

Table 68: East Asia Market Volume (Tons) Forecast by End User, 2017 to 2033

Table 69: East Asia Market Value (US$ Million) Forecast by Application, 2017 to 2033

Table 70: East Asia Market Volume (Tons) Forecast by Application, 2017 to 2033

Table 71: Middle East and Africa Market Value (US$ Million) Forecast by Country, 2017 to 2033

Table 72: Middle East and Africa Market Volume (Tons) Forecast by Country, 2017 to 2033

Table 73: Middle East and Africa Market Value (US$ Million) Forecast by Product Type, 2017 to 2033

Table 74: Middle East and Africa Market Volume (Tons) Forecast by Product Type, 2017 to 2033

Table 75: Middle East and Africa Market Value (US$ Million) Forecast by Refrigerant Type, 2017 to 2033

Table 76: Middle East and Africa Market Volume (Tons) Forecast by Refrigerant Type, 2017 to 2033

Table 77: Middle East and Africa Market Value (US$ Million) Forecast by End User, 2017 to 2033

Table 78: Middle East and Africa Market Volume (Tons) Forecast by End User, 2017 to 2033

Table 79: Middle East and Africa Market Value (US$ Million) Forecast by Application, 2017 to 2033

Table 80: Middle East and Africa Market Volume (Tons) Forecast by Application, 2017 to 2033
Nikhil Kaitwade
Nikhil Kaitwade

Principal Consultant

Talk to Analyst

Find your sweet spots for generating winning opportunities in this market.

List of Charts

Figure 1: Global Market Value (US$ Million) by Product Type, 2023 to 2033

Figure 2: Global Market Value (US$ Million) by Refrigerant Type, 2023 to 2033

Figure 3: Global Market Value (US$ Million) by End User, 2023 to 2033

Figure 4: Global Market Value (US$ Million) by Application, 2023 to 2033

Figure 5: Global Market Value (US$ Million) by Region, 2023 to 2033

Figure 6: Global Market Value (US$ Million) Analysis by Region, 2017 to 2033

Figure 7: Global Market Volume (Tons) Analysis by Region, 2017 to 2033

Figure 8: Global Market Value Share (%) and BPS Analysis by Region, 2023 to 2033

Figure 9: Global Market Y-o-Y Growth (%) Projections by Region, 2023 to 2033

Figure 10: Global Market Value (US$ Million) Analysis by Product Type, 2017 to 2033

Figure 11: Global Market Volume (Tons) Analysis by Product Type, 2017 to 2033

Figure 12: Global Market Value Share (%) and BPS Analysis by Product Type, 2023 to 2033

Figure 13: Global Market Y-o-Y Growth (%) Projections by Product Type, 2023 to 2033

Figure 14: Global Market Value (US$ Million) Analysis by Refrigerant Type, 2017 to 2033

Figure 15: Global Market Volume (Tons) Analysis by Refrigerant Type, 2017 to 2033

Figure 16: Global Market Value Share (%) and BPS Analysis by Refrigerant Type, 2023 to 2033

Figure 17: Global Market Y-o-Y Growth (%) Projections by Refrigerant Type, 2023 to 2033

Figure 18: Global Market Value (US$ Million) Analysis by End User, 2017 to 2033

Figure 19: Global Market Volume (Tons) Analysis by End User, 2017 to 2033

Figure 20: Global Market Value Share (%) and BPS Analysis by End User, 2023 to 2033

Figure 21: Global Market Y-o-Y Growth (%) Projections by End User, 2023 to 2033

Figure 22: Global Market Value (US$ Million) Analysis by Application, 2017 to 2033

Figure 23: Global Market Volume (Tons) Analysis by Application, 2017 to 2033

Figure 24: Global Market Value Share (%) and BPS Analysis by Application, 2023 to 2033

Figure 25: Global Market Y-o-Y Growth (%) Projections by Application, 2023 to 2033

Figure 26: Global Market Attractiveness by Product Type, 2023 to 2033

Figure 27: Global Market Attractiveness by Refrigerant Type, 2023 to 2033

Figure 28: Global Market Attractiveness by End User, 2023 to 2033

Figure 29: Global Market Attractiveness by Application, 2023 to 2033

Figure 30: Global Market Attractiveness by Region, 2023 to 2033

Figure 31: North America Market Value (US$ Million) by Product Type, 2023 to 2033

Figure 32: North America Market Value (US$ Million) by Refrigerant Type, 2023 to 2033

Figure 33: North America Market Value (US$ Million) by End User, 2023 to 2033

Figure 34: North America Market Value (US$ Million) by Application, 2023 to 2033

Figure 35: North America Market Value (US$ Million) by Country, 2023 to 2033

Figure 36: North America Market Value (US$ Million) Analysis by Country, 2017 to 2033

Figure 37: North America Market Volume (Tons) Analysis by Country, 2017 to 2033

Figure 38: North America Market Value Share (%) and BPS Analysis by Country, 2023 to 2033

Figure 39: North America Market Y-o-Y Growth (%) Projections by Country, 2023 to 2033

Figure 40: North America Market Value (US$ Million) Analysis by Product Type, 2017 to 2033

Figure 41: North America Market Volume (Tons) Analysis by Product Type, 2017 to 2033

Figure 42: North America Market Value Share (%) and BPS Analysis by Product Type, 2023 to 2033

Figure 43: North America Market Y-o-Y Growth (%) Projections by Product Type, 2023 to 2033

Figure 44: North America Market Value (US$ Million) Analysis by Refrigerant Type, 2017 to 2033

Figure 45: North America Market Volume (Tons) Analysis by Refrigerant Type, 2017 to 2033

Figure 46: North America Market Value Share (%) and BPS Analysis by Refrigerant Type, 2023 to 2033

Figure 47: North America Market Y-o-Y Growth (%) Projections by Refrigerant Type, 2023 to 2033

Figure 48: North America Market Value (US$ Million) Analysis by End User, 2017 to 2033

Figure 49: North America Market Volume (Tons) Analysis by End User, 2017 to 2033

Figure 50: North America Market Value Share (%) and BPS Analysis by End User, 2023 to 2033

Figure 51: North America Market Y-o-Y Growth (%) Projections by End User, 2023 to 2033

Figure 52: North America Market Value (US$ Million) Analysis by Application, 2017 to 2033

Figure 53: North America Market Volume (Tons) Analysis by Application, 2017 to 2033

Figure 54: North America Market Value Share (%) and BPS Analysis by Application, 2023 to 2033

Figure 55: North America Market Y-o-Y Growth (%) Projections by Application, 2023 to 2033

Figure 56: North America Market Attractiveness by Product Type, 2023 to 2033

Figure 57: North America Market Attractiveness by Refrigerant Type, 2023 to 2033

Figure 58: North America Market Attractiveness by End User, 2023 to 2033

Figure 59: North America Market Attractiveness by Application, 2023 to 2033

Figure 60: North America Market Attractiveness by Country, 2023 to 2033

Figure 61: Latin America Market Value (US$ Million) by Product Type, 2023 to 2033

Figure 62: Latin America Market Value (US$ Million) by Refrigerant Type, 2023 to 2033

Figure 63: Latin America Market Value (US$ Million) by End User, 2023 to 2033

Figure 64: Latin America Market Value (US$ Million) by Application, 2023 to 2033

Figure 65: Latin America Market Value (US$ Million) by Country, 2023 to 2033

Figure 66: Latin America Market Value (US$ Million) Analysis by Country, 2017 to 2033

Figure 67: Latin America Market Volume (Tons) Analysis by Country, 2017 to 2033

Figure 68: Latin America Market Value Share (%) and BPS Analysis by Country, 2023 to 2033

Figure 69: Latin America Market Y-o-Y Growth (%) Projections by Country, 2023 to 2033

Figure 70: Latin America Market Value (US$ Million) Analysis by Product Type, 2017 to 2033

Figure 71: Latin America Market Volume (Tons) Analysis by Product Type, 2017 to 2033

Figure 72: Latin America Market Value Share (%) and BPS Analysis by Product Type, 2023 to 2033

Figure 73: Latin America Market Y-o-Y Growth (%) Projections by Product Type, 2023 to 2033

Figure 74: Latin America Market Value (US$ Million) Analysis by Refrigerant Type, 2017 to 2033

Figure 75: Latin America Market Volume (Tons) Analysis by Refrigerant Type, 2017 to 2033

Figure 76: Latin America Market Value Share (%) and BPS Analysis by Refrigerant Type, 2023 to 2033

Figure 77: Latin America Market Y-o-Y Growth (%) Projections by Refrigerant Type, 2023 to 2033

Figure 78: Latin America Market Value (US$ Million) Analysis by End User, 2017 to 2033

Figure 79: Latin America Market Volume (Tons) Analysis by End User, 2017 to 2033

Figure 80: Latin America Market Value Share (%) and BPS Analysis by End User, 2023 to 2033

Figure 81: Latin America Market Y-o-Y Growth (%) Projections by End User, 2023 to 2033

Figure 82: Latin America Market Value (US$ Million) Analysis by Application, 2017 to 2033

Figure 83: Latin America Market Volume (Tons) Analysis by Application, 2017 to 2033

Figure 84: Latin America Market Value Share (%) and BPS Analysis by Application, 2023 to 2033

Figure 85: Latin America Market Y-o-Y Growth (%) Projections by Application, 2023 to 2033

Figure 86: Latin America Market Attractiveness by Product Type, 2023 to 2033

Figure 87: Latin America Market Attractiveness by Refrigerant Type, 2023 to 2033

Figure 88: Latin America Market Attractiveness by End User, 2023 to 2033

Figure 89: Latin America Market Attractiveness by Application, 2023 to 2033

Figure 90: Latin America Market Attractiveness by Country, 2023 to 2033

Figure 91: Western Europe Market Value (US$ Million) by Product Type, 2023 to 2033

Figure 92: Western Europe Market Value (US$ Million) by Refrigerant Type, 2023 to 2033

Figure 93: Western Europe Market Value (US$ Million) by End User, 2023 to 2033

Figure 94: Western Europe Market Value (US$ Million) by Application, 2023 to 2033

Figure 95: Western Europe Market Value (US$ Million) by Country, 2023 to 2033

Figure 96: Western Europe Market Value (US$ Million) Analysis by Country, 2017 to 2033

Figure 97: Western Europe Market Volume (Tons) Analysis by Country, 2017 to 2033

Figure 98: Western Europe Market Value Share (%) and BPS Analysis by Country, 2023 to 2033

Figure 99: Western Europe Market Y-o-Y Growth (%) Projections by Country, 2023 to 2033

Figure 100: Western Europe Market Value (US$ Million) Analysis by Product Type, 2017 to 2033

Figure 101: Western Europe Market Volume (Tons) Analysis by Product Type, 2017 to 2033

Figure 102: Western Europe Market Value Share (%) and BPS Analysis by Product Type, 2023 to 2033

Figure 103: Western Europe Market Y-o-Y Growth (%) Projections by Product Type, 2023 to 2033

Figure 104: Western Europe Market Value (US$ Million) Analysis by Refrigerant Type, 2017 to 2033

Figure 105: Western Europe Market Volume (Tons) Analysis by Refrigerant Type, 2017 to 2033

Figure 106: Western Europe Market Value Share (%) and BPS Analysis by Refrigerant Type, 2023 to 2033

Figure 107: Western Europe Market Y-o-Y Growth (%) Projections by Refrigerant Type, 2023 to 2033

Figure 108: Western Europe Market Value (US$ Million) Analysis by End User, 2017 to 2033

Figure 109: Western Europe Market Volume (Tons) Analysis by End User, 2017 to 2033

Figure 110: Western Europe Market Value Share (%) and BPS Analysis by End User, 2023 to 2033

Figure 111: Western Europe Market Y-o-Y Growth (%) Projections by End User, 2023 to 2033

Figure 112: Western Europe Market Value (US$ Million) Analysis by Application, 2017 to 2033

Figure 113: Western Europe Market Volume (Tons) Analysis by Application, 2017 to 2033

Figure 114: Western Europe Market Value Share (%) and BPS Analysis by Application, 2023 to 2033

Figure 115: Western Europe Market Y-o-Y Growth (%) Projections by Application, 2023 to 2033

Figure 116: Western Europe Market Attractiveness by Product Type, 2023 to 2033

Figure 117: Western Europe Market Attractiveness by Refrigerant Type, 2023 to 2033

Figure 118: Western Europe Market Attractiveness by End User, 2023 to 2033

Figure 119: Western Europe Market Attractiveness by Application, 2023 to 2033

Figure 120: Western Europe Market Attractiveness by Country, 2023 to 2033

Figure 121: Eastern Europe Market Value (US$ Million) by Product Type, 2023 to 2033

Figure 122: Eastern Europe Market Value (US$ Million) by Refrigerant Type, 2023 to 2033

Figure 123: Eastern Europe Market Value (US$ Million) by End User, 2023 to 2033

Figure 124: Eastern Europe Market Value (US$ Million) by Application, 2023 to 2033

Figure 125: Eastern Europe Market Value (US$ Million) by Country, 2023 to 2033

Figure 126: Eastern Europe Market Value (US$ Million) Analysis by Country, 2017 to 2033

Figure 127: Eastern Europe Market Volume (Tons) Analysis by Country, 2017 to 2033

Figure 128: Eastern Europe Market Value Share (%) and BPS Analysis by Country, 2023 to 2033

Figure 129: Eastern Europe Market Y-o-Y Growth (%) Projections by Country, 2023 to 2033

Figure 130: Eastern Europe Market Value (US$ Million) Analysis by Product Type, 2017 to 2033

Figure 131: Eastern Europe Market Volume (Tons) Analysis by Product Type, 2017 to 2033

Figure 132: Eastern Europe Market Value Share (%) and BPS Analysis by Product Type, 2023 to 2033

Figure 133: Eastern Europe Market Y-o-Y Growth (%) Projections by Product Type, 2023 to 2033

Figure 134: Eastern Europe Market Value (US$ Million) Analysis by Refrigerant Type, 2017 to 2033

Figure 135: Eastern Europe Market Volume (Tons) Analysis by Refrigerant Type, 2017 to 2033

Figure 136: Eastern Europe Market Value Share (%) and BPS Analysis by Refrigerant Type, 2023 to 2033

Figure 137: Eastern Europe Market Y-o-Y Growth (%) Projections by Refrigerant Type, 2023 to 2033

Figure 138: Eastern Europe Market Value (US$ Million) Analysis by End User, 2017 to 2033

Figure 139: Eastern Europe Market Volume (Tons) Analysis by End User, 2017 to 2033

Figure 140: Eastern Europe Market Value Share (%) and BPS Analysis by End User, 2023 to 2033

Figure 141: Eastern Europe Market Y-o-Y Growth (%) Projections by End User, 2023 to 2033

Figure 142: Eastern Europe Market Value (US$ Million) Analysis by Application, 2017 to 2033

Figure 143: Eastern Europe Market Volume (Tons) Analysis by Application, 2017 to 2033

Figure 144: Eastern Europe Market Value Share (%) and BPS Analysis by Application, 2023 to 2033

Figure 145: Eastern Europe Market Y-o-Y Growth (%) Projections by Application, 2023 to 2033

Figure 146: Eastern Europe Market Attractiveness by Product Type, 2023 to 2033

Figure 147: Eastern Europe Market Attractiveness by Refrigerant Type, 2023 to 2033

Figure 148: Eastern Europe Market Attractiveness by End User, 2023 to 2033

Figure 149: Eastern Europe Market Attractiveness by Application, 2023 to 2033

Figure 150: Eastern Europe Market Attractiveness by Country, 2023 to 2033

Figure 151: South Asia and Pacific Market Value (US$ Million) by Product Type, 2023 to 2033

Figure 152: South Asia and Pacific Market Value (US$ Million) by Refrigerant Type, 2023 to 2033

Figure 153: South Asia and Pacific Market Value (US$ Million) by End User, 2023 to 2033

Figure 154: South Asia and Pacific Market Value (US$ Million) by Application, 2023 to 2033

Figure 155: South Asia and Pacific Market Value (US$ Million) by Country, 2023 to 2033

Figure 156: South Asia and Pacific Market Value (US$ Million) Analysis by Country, 2017 to 2033

Figure 157: South Asia and Pacific Market Volume (Tons) Analysis by Country, 2017 to 2033

Figure 158: South Asia and Pacific Market Value Share (%) and BPS Analysis by Country, 2023 to 2033

Figure 159: South Asia and Pacific Market Y-o-Y Growth (%) Projections by Country, 2023 to 2033

Figure 160: South Asia and Pacific Market Value (US$ Million) Analysis by Product Type, 2017 to 2033

Figure 161: South Asia and Pacific Market Volume (Tons) Analysis by Product Type, 2017 to 2033

Figure 162: South Asia and Pacific Market Value Share (%) and BPS Analysis by Product Type, 2023 to 2033

Figure 163: South Asia and Pacific Market Y-o-Y Growth (%) Projections by Product Type, 2023 to 2033

Figure 164: South Asia and Pacific Market Value (US$ Million) Analysis by Refrigerant Type, 2017 to 2033

Figure 165: South Asia and Pacific Market Volume (Tons) Analysis by Refrigerant Type, 2017 to 2033

Figure 166: South Asia and Pacific Market Value Share (%) and BPS Analysis by Refrigerant Type, 2023 to 2033

Figure 167: South Asia and Pacific Market Y-o-Y Growth (%) Projections by Refrigerant Type, 2023 to 2033

Figure 168: South Asia and Pacific Market Value (US$ Million) Analysis by End User, 2017 to 2033

Figure 169: South Asia and Pacific Market Volume (Tons) Analysis by End User, 2017 to 2033

Figure 170: South Asia and Pacific Market Value Share (%) and BPS Analysis by End User, 2023 to 2033

Figure 171: South Asia and Pacific Market Y-o-Y Growth (%) Projections by End User, 2023 to 2033

Figure 172: South Asia and Pacific Market Value (US$ Million) Analysis by Application, 2017 to 2033

Figure 173: South Asia and Pacific Market Volume (Tons) Analysis by Application, 2017 to 2033

Figure 174: South Asia and Pacific Market Value Share (%) and BPS Analysis by Application, 2023 to 2033

Figure 175: South Asia and Pacific Market Y-o-Y Growth (%) Projections by Application, 2023 to 2033

Figure 176: South Asia and Pacific Market Attractiveness by Product Type, 2023 to 2033

Figure 177: South Asia and Pacific Market Attractiveness by Refrigerant Type, 2023 to 2033

Figure 178: South Asia and Pacific Market Attractiveness by End User, 2023 to 2033

Figure 179: South Asia and Pacific Market Attractiveness by Application, 2023 to 2033

Figure 180: South Asia and Pacific Market Attractiveness by Country, 2023 to 2033

Figure 181: East Asia Market Value (US$ Million) by Product Type, 2023 to 2033

Figure 182: East Asia Market Value (US$ Million) by Refrigerant Type, 2023 to 2033

Figure 183: East Asia Market Value (US$ Million) by End User, 2023 to 2033

Figure 184: East Asia Market Value (US$ Million) by Application, 2023 to 2033

Figure 185: East Asia Market Value (US$ Million) by Country, 2023 to 2033

Figure 186: East Asia Market Value (US$ Million) Analysis by Country, 2017 to 2033

Figure 187: East Asia Market Volume (Tons) Analysis by Country, 2017 to 2033

Figure 188: East Asia Market Value Share (%) and BPS Analysis by Country, 2023 to 2033

Figure 189: East Asia Market Y-o-Y Growth (%) Projections by Country, 2023 to 2033

Figure 190: East Asia Market Value (US$ Million) Analysis by Product Type, 2017 to 2033

Figure 191: East Asia Market Volume (Tons) Analysis by Product Type, 2017 to 2033

Figure 192: East Asia Market Value Share (%) and BPS Analysis by Product Type, 2023 to 2033

Figure 193: East Asia Market Y-o-Y Growth (%) Projections by Product Type, 2023 to 2033

Figure 194: East Asia Market Value (US$ Million) Analysis by Refrigerant Type, 2017 to 2033

Figure 195: East Asia Market Volume (Tons) Analysis by Refrigerant Type, 2017 to 2033

Figure 196: East Asia Market Value Share (%) and BPS Analysis by Refrigerant Type, 2023 to 2033

Figure 197: East Asia Market Y-o-Y Growth (%) Projections by Refrigerant Type, 2023 to 2033

Figure 198: East Asia Market Value (US$ Million) Analysis by End User, 2017 to 2033

Figure 199: East Asia Market Volume (Tons) Analysis by End User, 2017 to 2033

Figure 200: East Asia Market Value Share (%) and BPS Analysis by End User, 2023 to 2033

Figure 201: East Asia Market Y-o-Y Growth (%) Projections by End User, 2023 to 2033

Figure 202: East Asia Market Value (US$ Million) Analysis by Application, 2017 to 2033

Figure 203: East Asia Market Volume (Tons) Analysis by Application, 2017 to 2033

Figure 204: East Asia Market Value Share (%) and BPS Analysis by Application, 2023 to 2033

Figure 205: East Asia Market Y-o-Y Growth (%) Projections by Application, 2023 to 2033

Figure 206: East Asia Market Attractiveness by Product Type, 2023 to 2033

Figure 207: East Asia Market Attractiveness by Refrigerant Type, 2023 to 2033

Figure 208: East Asia Market Attractiveness by End User, 2023 to 2033

Figure 209: East Asia Market Attractiveness by Application, 2023 to 2033

Figure 210: East Asia Market Attractiveness by Country, 2023 to 2033

Figure 211: Middle East and Africa Market Value (US$ Million) by Product Type, 2023 to 2033

Figure 212: Middle East and Africa Market Value (US$ Million) by Refrigerant Type, 2023 to 2033

Figure 213: Middle East and Africa Market Value (US$ Million) by End User, 2023 to 2033

Figure 214: Middle East and Africa Market Value (US$ Million) by Application, 2023 to 2033

Figure 215: Middle East and Africa Market Value (US$ Million) by Country, 2023 to 2033

Figure 216: Middle East and Africa Market Value (US$ Million) Analysis by Country, 2017 to 2033

Figure 217: Middle East and Africa Market Volume (Tons) Analysis by Country, 2017 to 2033

Figure 218: Middle East and Africa Market Value Share (%) and BPS Analysis by Country, 2023 to 2033

Figure 219: Middle East and Africa Market Y-o-Y Growth (%) Projections by Country, 2023 to 2033

Figure 220: Middle East and Africa Market Value (US$ Million) Analysis by Product Type, 2017 to 2033

Figure 221: Middle East and Africa Market Volume (Tons) Analysis by Product Type, 2017 to 2033

Figure 222: Middle East and Africa Market Value Share (%) and BPS Analysis by Product Type, 2023 to 2033

Figure 223: Middle East and Africa Market Y-o-Y Growth (%) Projections by Product Type, 2023 to 2033

Figure 224: Middle East and Africa Market Value (US$ Million) Analysis by Refrigerant Type, 2017 to 2033

Figure 225: Middle East and Africa Market Volume (Tons) Analysis by Refrigerant Type, 2017 to 2033

Figure 226: Middle East and Africa Market Value Share (%) and BPS Analysis by Refrigerant Type, 2023 to 2033

Figure 227: Middle East and Africa Market Y-o-Y Growth (%) Projections by Refrigerant Type, 2023 to 2033

Figure 228: Middle East and Africa Market Value (US$ Million) Analysis by End User, 2017 to 2033

Figure 229: Middle East and Africa Market Volume (Tons) Analysis by End User, 2017 to 2033

Figure 230: Middle East and Africa Market Value Share (%) and BPS Analysis by End User, 2023 to 2033

Figure 231: Middle East and Africa Market Y-o-Y Growth (%) Projections by End User, 2023 to 2033

Figure 232: Middle East and Africa Market Value (US$ Million) Analysis by Application, 2017 to 2033

Figure 233: Middle East and Africa Market Volume (Tons) Analysis by Application, 2017 to 2033

Figure 234: Middle East and Africa Market Value Share (%) and BPS Analysis by Application, 2023 to 2033

Figure 235: Middle East and Africa Market Y-o-Y Growth (%) Projections by Application, 2023 to 2033

Figure 236: Middle East and Africa Market Attractiveness by Product Type, 2023 to 2033

Figure 237: Middle East and Africa Market Attractiveness by Refrigerant Type, 2023 to 2033

Figure 238: Middle East and Africa Market Attractiveness by End User, 2023 to 2033

Figure 239: Middle East and Africa Market Attractiveness by Application, 2023 to 2033

Figure 240: Middle East and Africa Market Attractiveness by Country, 2023 to 2033

Recommendations

Chemicals & Materials

Cyclohexylbenzene Market

Published : June 2023

Explore Chemicals & Materials Insights

View Reports