Bottle Sealing Wax Market Size, Share & Forecast 2025 to 2035

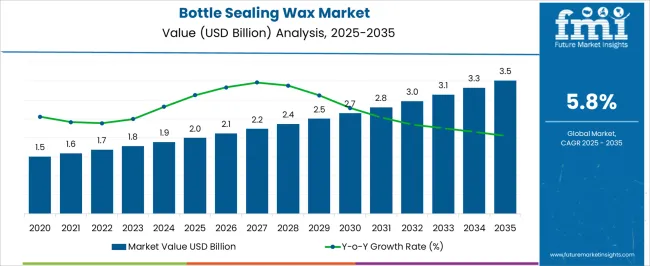
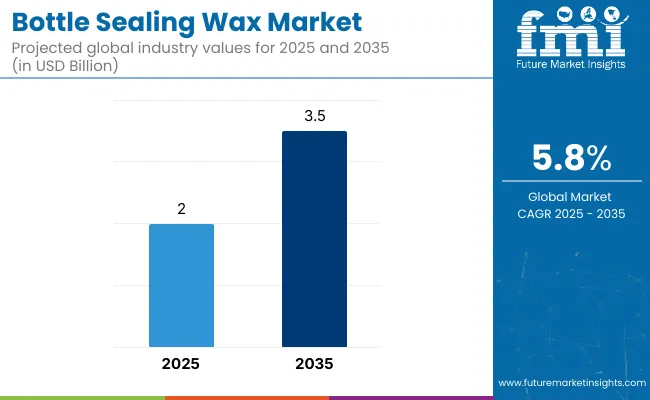
The global bottle sealing wax market is projected to grow from USD 2.0 billion in 2025 to USD 3.5 billion by 2035, registering a CAGR of 5.8% during the forecast period. Sales in 2024 were recorded at USD 1.8 billion. This impressive growth is primarily driven by the increasing use of wax seals in premium packaging for wine, spirits, gourmet food, and specialty personal care products.

Bottle sealing wax provides an artisanal touch and tamper-evident functionality, making it highly attractive to small-batch producers and luxury brands. Unlike standard closures, wax seals enable differentiation, storytelling, and aesthetic appeal that resonate with discerning consumers and gift buyers alike.
Quick Stats of Bottle Sealing Wax Market

  • Market Value (2025): USD 2.0 billion
  • Forecast Value (2035): USD 3.5 billion
  • Forecast CAGR: 5.8%
  • Type Leader in 2025: Paraffin Wax (38.2% market share)
  • Top Application: Wine Bottles (44.7% share)
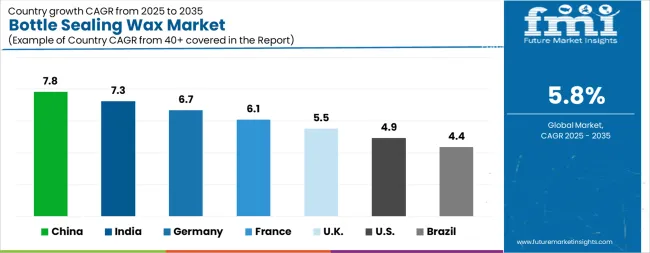
  • Key Growth Country: Asia Pacific (Japan is the fastest-growing market with 6.5% CAGR)

Bottle Sealing Wax Market

Metric Value
Industry Size (2025E) USD 2.0 billion
Industry Value (2035F) USD 3.5 billion
CAGR (2025 to 2035) 5.8%

Innovation in the bottle sealing wax market is driven by the convergence of sustainability, aesthetics, and production efficiency. Manufacturers are introducing biodegradable wax blends, paraffin-free formulas, and fast-dip low-drip coatings for seamless use on automated and manual sealing lines. Premium finishes including metallic, pearlized, and soft-matte coatings are being developed for enhanced shelf appeal. These product enhancements are accompanied by improvements in adhesion, printability, and temperature resistance, expanding their utility in both alcoholic and non-alcoholic premium beverages, as well as in high-end olive oils, vinegars, and syrups.

The market is witnessing robust traction in Europe, where heritage wine and spirit brands use wax sealing as a mark of authenticity and craftsmanship. Countries like France, Italy, and Spain remain key demand centers due to strong cultural ties to wax-sealed packaging. In North America, growth is driven by the expansion of the craft distillery movement and the adoption of wax seals in boutique food brands.

Asia Pacific is emerging as an opportunity-rich region, with a rising number of premium product launches in Japan, Australia, and India. The expanding use of wax sealing in gifting, e-commerce-ready packaging, and luxury private labels is expected to further diversify the market landscape.
Analyzing Bottle Sealing Wax Market by Top Investment Segment

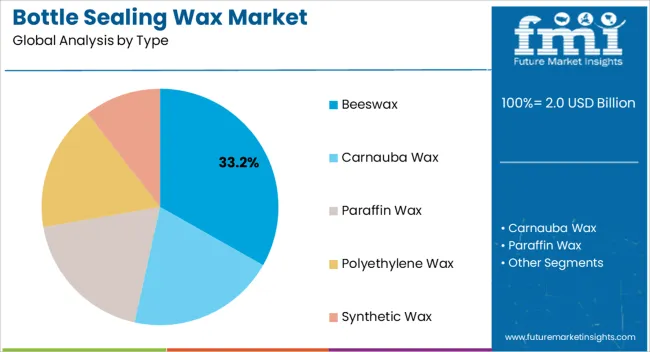
The market has been segmented based on type, application, product form, distribution channel, end use, and region. By type, key waxes include beeswax, carnauba wax, paraffin wax, polyethylene wax, and synthetic wax, each offering distinct melting points and finishes suitable for bottle aesthetics and protection.

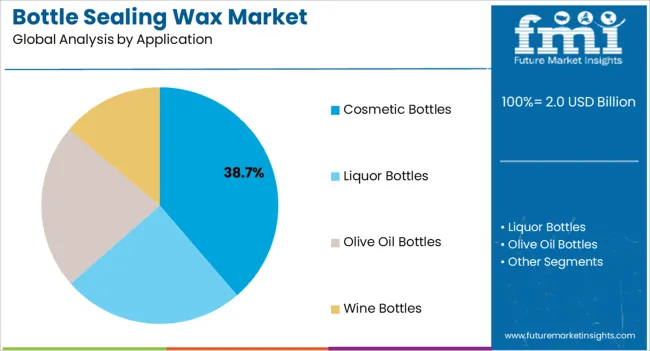
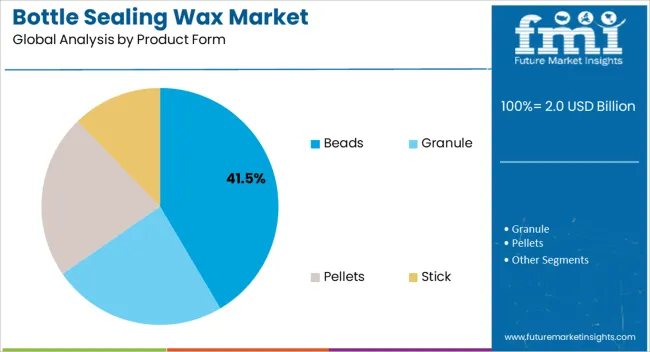
Applications are centered on wine bottles, olive oil bottles, liquor bottles, and cosmetic bottles, where sealing wax ensures tamper evidence, premium appeal, and long-term preservation. The product form ranges from beads, granules, pellets, to sticks, supporting automated as well as artisanal sealing operations.

Distribution is spread across offline (retail, wholesale) and online (direct websites, e-commerce platforms), with online channels gaining traction due to small-batch and custom wax seal trends. End-use industries include commercial, industrial, and residential sectors, each valuing wax sealing for branding and product integrity.

Regionally, segmentation includes North America, Latin America, Asia Pacific, Western Europe, Eastern Europe, and the Middle East & Africa, where growing premium beverage markets and artisanal packaging trends are key drivers of wax seal demand.

Paraffin Wax Segment to Dominate Due to Cost-Effectiveness and Ease of Use

Bottle Sealing Wax Market By Type

The paraffin wax segment is anticipated to account for the highest share of 38.2% in 2025 in the global bottle sealing wax market. Its dominance stems from its widespread availability, economical price point, and ease of melting and application across both manual and automated sealing operations. Paraffin wax also offers excellent moisture resistance and a smooth, glossy finish, making it ideal for both functional and decorative sealing applications.

Owing to its low viscosity and compatibility with dyes and fragrances, paraffin wax is increasingly favored by boutique distilleries, artisanal beverage producers, and cosmetic brands for branding differentiation.

Paraffin wax enables a uniform seal that protects cork closures from contamination or oxidation. These properties, combined with its low shrinkage and high pliability, are contributing to sustained demand across packaging lines, particularly in the alcoholic beverage and specialty food sectors.

Wine Bottles Application Leads with Premium Branding Appeal

Bottle Sealing Wax Market By Application

The wine bottles segment is projected to lead the application category with a 44.7% market share in 2025. Wax sealing has gained renewed importance in the wine industry not only for preserving the integrity of cork stoppers but also for enhancing the premium aesthetic of bottled products. Sealing wax acts as a tamper-evident feature while reinforcing vintage or artisanal branding for wineries.

Wax-sealed wine bottles are perceived as more luxurious and are increasingly used for limited-edition releases, organic wines, and exports. The growing number of micro-wineries and the expansion of the global wine tourism economy especially in regions like France, Italy, California, and Australia have accelerated the adoption of decorative wax finishes. The segment is further supported by a rising trend toward handcrafted and small-batch wine presentations aimed at high-end retail and e-commerce packaging formats.

Bottle Sealing Wax Market Dynamics

One of the significant factors that will contribute to the growth of the global bottle sealing wax market is the increasing disposable income of the middle income group and the developing tendency amongst high net-worth individuals to use premium packaged products. Another important factor that will contribute to the growth of the global bottle sealing wax market is the ease in availability of sealed wax products.

This has been made possible by the progress made by the retail sector in terms of supermarket, hypermarket, and e-commerce. In addition to this, the handling efficiency required to open bottles without knives or cutter and with no foil cuts on the bottle will drive the growth for the global bottle sealing wax market.

In addition to this, the introduction of a new line of bottle sealing wax referred to as “CalGlo” is also expected to drive growth for the global bottle sealing wax market. CalGlo wax glows in the absence of light which essentially sets apart the product from its competitor. However, the wide usage and variety of cap liners are expected to hinder the global bottle sealing wax market. Though the sealing wax is waterproof in nature, it is not waterproof against the action of alcohol which makes the sealing wax soft which results in dropping off of sealing wax.

Moreover, additional cost to manufacturers and retailers in order to provide proper storage facility is expected to hamper the growth of the global bottle sealing wax market as the bottle sealing wax is too sensitive to climate influence and temperature variation.

Furthermore, the technological advancement in terms of anti-counterfeit packaging solution is also expected to hinder the growth of global bottle sealing wax market as the secondary purpose of sealing wax is to validate the authenticity of the product.

Bottle Sealing Wax Market Regional Outlook

Geographically, the bottle sealing wax market can be segmented into North America, Latin America, Europe, Asia Pacific (APAC), and Middle East & Africa (MEA). The growth of the global bottle sealing wax market is expected to witness a steady CAGR over the forecast period of 2025 to 2035. North America is expected to be the biggest contributor in terms of value and volume.

This will be made possible primarily by the increased disposable income as well as the growing standard of living. Moreover, the rise of the retail sector in India and China is expected to account for a significant market volume share of the global bottle sealing wax market in the Asia-Pacific region.

These lucrative economies will contribute fairly to the growth of global bottle sealing wax market. Europe, on the other hand, is expected to occupy a significant market value share of the global bottle sealing wax market. This will be made possible by the huge consumption of alcoholic beverages.

Bottle Sealing Wax Market- Major Players

The research report presents a comprehensive assessment of the market and contains thoughtful insights, facts, historical data, and statistically supported and industry-validated market data. It also contains projections using a suitable set of assumptions and methodologies. The research report provides analysis and information according to market segments such as geography, technology and applications.

Key Companies

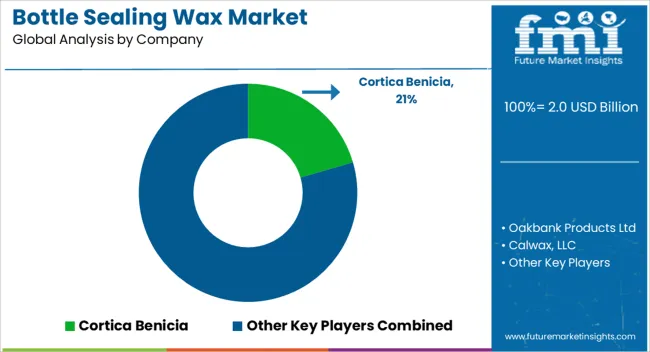
  • Cortica Benicia
  • Oakbank Products Ltd
  • Calwax, LLC
  • Darent Wax Co. Ltd.
  • The British Wax Refining Co. Ltd
  • Australian Wax Company
  • Southwest Wax LLC

The report covers exhaustive analysis on

  • Market Segments
  • Market Dynamics
  • Market Size
  • Supply & Demand
  • Current Trends/Issues/Challenges
  • Competition & Companies involved
  • Technology
  • Value Chain

Regional analysis includes

  • North America (USA, Canada)
  • Latin America (Mexico, Brazil, Rest of Latin America)
  • Europe (EU5 Countries, Nordic countries, BENELUX, Poland, Russia, Rest of Europe)
  • APAC (China, India, ASEAN, Australia & New Zealand, Japan)
  • MEA (GCC Countries, S. Africa, N. Africa)

The report is a compilation of first-hand information, qualitative and quantitative assessment by industry analysts, inputs from industry experts and industry participants across the value chain.

The report provides in-depth analysis of parent market trends, macro-economic indicators and governing factors along with market attractiveness as per segments. The report also maps the qualitative impact of various market factors on market segments and geographies.

Bottle Sealing Wax Market Segmentation

By Type:

  • Beeswax
  • Carnauba Wax
  • Paraffin Wax
  • Polyethylene Wax
  • Synthetic Wax

By Application:

  • Cosmetic Bottles
  • Liquor Bottles
  • Olive Oil Bottles
  • Wine Bottles

By Product Form:

  • Beads
  • Granule
  • Pellets
  • Stick

By Distribution Channel:

  • Offline
  • Retail
  • Wholesale
  • Online
  • Direct Website
  • E-Commerce Platforms

By End Use:

  • Commercial
  • Industrial
  • Residential

By Region:

  • North America
  • Latin America
  • Asia Pacific
  • Western Europe
  • Eastern Europe
  • Middle East & Africa

Table of Content

  1. Executive Summary
    • Global Market Outlook
    • Demand-side Trends
    • Supply-side Trends
    • Technology Roadmap Analysis
    • Analysis and Recommendations
  2. Market Overview
    • Market Coverage / Taxonomy
    • Market Definition / Scope / Limitations
  3. Market Background
    • Market Dynamics
      • Drivers
      • Restraints
      • Opportunity
      • Trends
    • Scenario Forecast
      • Demand in Optimistic Scenario
      • Demand in Likely Scenario
      • Demand in Conservative Scenario
    • Opportunity Map Analysis
    • Product Life Cycle Analysis
    • Supply Chain Analysis
      • Supply Side Participants and their Roles
        • Producers
        • Mid-Level Participants (Traders/ Agents/ Brokers)
        • Wholesalers and Distributors
      • Value Added and Value Created at Node in the Supply Chain
      • List of Raw Material Suppliers
      • List of Existing and Potential Buyer’s
    • Investment Feasibility Matrix
    • Value Chain Analysis
      • Profit Margin Analysis
      • Wholesalers and Distributors
      • Retailers
    • PESTLE and Porter’s Analysis
    • Regulatory Landscape
      • By Key Regions
      • By Key Countries
    • Regional Parent Market Outlook
    • Production and Consumption Statistics
    • Import and Export Statistics
  4. Global Market Analysis 2020 to 2024 and Forecast, 2025 to 2035
    • Historical Market Size Value (USD Million) & Volume (Units) Analysis, 2020 to 2024
    • Current and Future Market Size Value (USD Million) & Volume (Units) Projections, 2025 to 2035
      • Y-o-Y Growth Trend Analysis
      • Absolute $ Opportunity Analysis
  5. Global Market Pricing Analysis 2020 to 2024 and Forecast 2025 to 2035
  6. Global Market Analysis 2020 to 2024 and Forecast 2025 to 2035, By Type
    • Introduction / Key Findings
    • Historical Market Size Value (USD Million) & Volume (Units) Analysis By Type, 2020 to 2024
    • Current and Future Market Size Value (USD Million) & Volume (Units) Analysis and Forecast By Type, 2025 to 2035
      • Beeswax
      • Carnauba Wax
      • Paraffin Wax
      • Polyethylene Wax
      • Synthetic Wax
    • Y-o-Y Growth Trend Analysis By Type, 2020 to 2024
    • Absolute $ Opportunity Analysis By Type, 2025 to 2035
  7. Global Market Analysis 2020 to 2024 and Forecast 2025 to 2035, By Application
    • Introduction / Key Findings
    • Historical Market Size Value (USD Million) & Volume (Units) Analysis By Application, 2020 to 2024
    • Current and Future Market Size Value (USD Million) & Volume (Units) Analysis and Forecast By Application, 2025 to 2035
      • Cosmetic Bottles
      • Liquor Bottles
      • Olive Oil Bottles
      • Wine Bottles
    • Y-o-Y Growth Trend Analysis By Application, 2020 to 2024
    • Absolute $ Opportunity Analysis By Application, 2025 to 2035
  8. Global Market Analysis 2020 to 2024 and Forecast 2025 to 2035, By Product Form
    • Introduction / Key Findings
    • Historical Market Size Value (USD Million) & Volume (Units) Analysis By Product Form, 2020 to 2024
    • Current and Future Market Size Value (USD Million) & Volume (Units) Analysis and Forecast By Product Form, 2025 to 2035
      • Beads
      • Granule
      • Pellets
      • Stick
    • Y-o-Y Growth Trend Analysis By Product Form, 2020 to 2024
    • Absolute $ Opportunity Analysis By Product Form, 2025 to 2035
  9. Global Market Analysis 2020 to 2024 and Forecast 2025 to 2035, By Distribution Channel
    • Introduction / Key Findings
    • Historical Market Size Value (USD Million) & Volume (Units) Analysis By Distribution Channel, 2020 to 2024
    • Current and Future Market Size Value (USD Million) & Volume (Units) Analysis and Forecast By Distribution Channel, 2025 to 2035
      • Offline
      • Retail
      • Wholesale
      • Online
      • Direct Website
      • E-Commerce Platforms
    • Y-o-Y Growth Trend Analysis By Distribution Channel, 2020 to 2024
    • Absolute $ Opportunity Analysis By Distribution Channel, 2025 to 2035
  10. Global Market Analysis 2020 to 2024 and Forecast 2025 to 2035, By End Use
    • Introduction / Key Findings
    • Historical Market Size Value (USD Million) & Volume (Units) Analysis By End Use, 2020 to 2024
    • Current and Future Market Size Value (USD Million) & Volume (Units) Analysis and Forecast By End Use, 2025 to 2035
      • Commercial
      • Industrial
      • Residential
    • Y-o-Y Growth Trend Analysis By End Use, 2020 to 2024
    • Absolute $ Opportunity Analysis By End Use, 2025 to 2035
  11. Global Market Analysis 2020 to 2024 and Forecast 2025 to 2035, By Region
    • Introduction
    • Historical Market Size Value (USD Million) & Volume (Units) Analysis By Region, 2020 to 2024
    • Current Market Size Value (USD Million) & Volume (Units) Analysis and Forecast By Region, 2025 to 2035
      • North America
      • Latin America
      • Europe
      • East Asia
      • South Asia
      • Oceania
      • MEA
    • Market Attractiveness Analysis By Region
  12. North America Market Analysis 2020 to 2024 and Forecast 2025 to 2035, By Country
    • Historical Market Size Value (USD Million) & Volume (Units) Trend Analysis By Market Taxonomy, 2020 to 2024
    • Market Size Value (USD Million) & Volume (Units) Forecast By Market Taxonomy, 2025 to 2035
      • By Country
        • USA
        • Canada
      • By Type
      • By Application
      • By Product Form
      • By Distribution Channel
      • By End Use
    • Market Attractiveness Analysis
      • By Country
      • By Type
      • By Application
      • By Product Form
      • By Distribution Channel
      • By End Use
    • Key Takeaways
  13. Latin America Market Analysis 2020 to 2024 and Forecast 2025 to 2035, By Country
    • Historical Market Size Value (USD Million) & Volume (Units) Trend Analysis By Market Taxonomy, 2020 to 2024
    • Market Size Value (USD Million) & Volume (Units) Forecast By Market Taxonomy, 2025 to 2035
      • By Country
        • Brazil
        • Mexico
        • Argentina
        • Chile
        • Peru
        • Rest of Latin America
      • By Type
      • By Application
      • By Product Form
      • By Distribution Channel
      • By End Use
    • Market Attractiveness Analysis
      • By Country
      • By Type
      • By Application
      • By Product Form
      • By Distribution Channel
      • By End Use
    • Key Takeaways
  14. Europe Market Analysis 2020 to 2024 and Forecast 2025 to 2035, By Country
    • Historical Market Size Value (USD Million) & Volume (Units) Trend Analysis By Market Taxonomy, 2020 to 2024
    • Market Size Value (USD Million) & Volume (Units) Forecast By Market Taxonomy, 2025 to 2035
      • By Country
        • Germany
        • Italy
        • France
        • UK
        • Spain
        • Russia
        • BENELUX
        • Rest of Europe
      • By Type
      • By Application
      • By Product Form
      • By Distribution Channel
      • By End Use
    • Market Attractiveness Analysis
      • By Country
      • By Type
      • By Application
      • By Product Form
      • By Distribution Channel
      • By End Use
    • Key Takeaways
  15. East Asia Market Analysis 2020 to 2024 and Forecast 2025 to 2035, By Country
    • Historical Market Size Value (USD Million) & Volume (Units) Trend Analysis By Market Taxonomy, 2020 to 2024
    • Market Size Value (USD Million) & Volume (Units) Forecast By Market Taxonomy, 2025 to 2035
      • By Country
        • China
        • Japan
        • South Korea
      • By Type
      • By Application
      • By Product Form
      • By Distribution Channel
      • By End Use
    • Market Attractiveness Analysis
      • By Country
      • By Type
      • By Application
      • By Product Form
      • By Distribution Channel
      • By End Use
    • Key Takeaways
  16. South Asia Market Analysis 2020 to 2024 and Forecast 2025 to 2035, By Country
    • Historical Market Size Value (USD Million) & Volume (Units) Trend Analysis By Market Taxonomy, 2020 to 2024
    • Market Size Value (USD Million) & Volume (Units) Forecast By Market Taxonomy, 2025 to 2035
      • By Country
        • India
        • Thailand
        • Malaysia
        • Indonesia
        • Rest of South Asia
      • By Type
      • By Application
      • By Product Form
      • By Distribution Channel
      • By End Use
    • Market Attractiveness Analysis
      • By Country
      • By Type
      • By Application
      • By Product Form
      • By Distribution Channel
      • By End Use
    • Key Takeaways
  17. Oceania Market Analysis 2020 to 2024 and Forecast 2025 to 2035, By Country
    • Historical Market Size Value (USD Million) & Volume (Units) Trend Analysis By Market Taxonomy, 2020 to 2024
    • Market Size Value (USD Million) & Volume (Units) Forecast By Market Taxonomy, 2025 to 2035
      • By Country
        • Australia
        • New Zealand
      • By Type
      • By Application
      • By Product Form
      • By Distribution Channel
      • By End Use
    • Market Attractiveness Analysis
      • By Country
      • By Type
      • By Application
      • By Product Form
      • By Distribution Channel
      • By End Use
    • Key Takeaways
  18. MEA Market Analysis 2020 to 2024 and Forecast 2025 to 2035, By Country
    • Historical Market Size Value (USD Million) & Volume (Units) Trend Analysis By Market Taxonomy, 2020 to 2024
    • Market Size Value (USD Million) & Volume (Units) Forecast By Market Taxonomy, 2025 to 2035
      • By Country
        • GCC
        • Rest of MEA
      • By Type
      • By Application
      • By Product Form
      • By Distribution Channel
      • By End Use
    • Market Attractiveness Analysis
      • By Country
      • By Type
      • By Application
      • By Product Form
      • By Distribution Channel
      • By End Use
    • Key Takeaways
  19. Key Countries Market Analysis
    • USA
      • Pricing Analysis
      • Market Share Analysis, 2024
        • By Type
        • By Application
        • By Product Form
        • By Distribution Channel
        • By End Use
    • Canada
      • Pricing Analysis
      • Market Share Analysis, 2024
        • By Type
        • By Application
        • By Product Form
        • By Distribution Channel
        • By End Use
    • Brazil
      • Pricing Analysis
      • Market Share Analysis, 2024
        • By Type
        • By Application
        • By Product Form
        • By Distribution Channel
        • By End Use
    • Mexico
      • Pricing Analysis
      • Market Share Analysis, 2024
        • By Type
        • By Application
        • By Product Form
        • By Distribution Channel
        • By End Use
    • Argentina
      • Pricing Analysis
      • Market Share Analysis, 2024
        • By Type
        • By Application
        • By Product Form
        • By Distribution Channel
        • By End Use
  20. Market Structure Analysis
    • Competition Dashboard
    • Competition Benchmarking
    • Market Share Analysis of Top Players
      • By Regional
      • By Type
      • By Application
      • By Product Form
      • By Distribution Channel
      • By End Use
  21. Competition Analysis
    • Competition Deep Dive
      • Cortica Benicia
        • Overview
        • Product Portfolio
        • Profitability by Market Segments (Product/Age /Sales Channel/Region)
        • Sales Footprint
        • Strategy Overview
          • Marketing Strategy
          • Product Strategy
          • Channel Strategy
      • Oakbank Products Ltd
        • Overview
        • Product Portfolio
        • Profitability by Market Segments (Product/Age /Sales Channel/Region)
        • Sales Footprint
        • Strategy Overview
          • Marketing Strategy
          • Product Strategy
          • Channel Strategy
      • Calwax, LLC
        • Overview
        • Product Portfolio
        • Profitability by Market Segments (Product/Age /Sales Channel/Region)
        • Sales Footprint
        • Strategy Overview
          • Marketing Strategy
          • Product Strategy
          • Channel Strategy
      • Darent Wax Co. Ltd.
        • Overview
        • Product Portfolio
        • Profitability by Market Segments (Product/Age /Sales Channel/Region)
        • Sales Footprint
        • Strategy Overview
          • Marketing Strategy
          • Product Strategy
          • Channel Strategy
      • The British Wax Refining Co. Ltd
        • Overview
        • Product Portfolio
        • Profitability by Market Segments (Product/Age /Sales Channel/Region)
        • Sales Footprint
        • Strategy Overview
          • Marketing Strategy
          • Product Strategy
          • Channel Strategy
      • Australian Wax Company
        • Overview
        • Product Portfolio
        • Profitability by Market Segments (Product/Age /Sales Channel/Region)
        • Sales Footprint
        • Strategy Overview
          • Marketing Strategy
          • Product Strategy
          • Channel Strategy
      • Southwest Wax LLC
        • Overview
        • Product Portfolio
        • Profitability by Market Segments (Product/Age /Sales Channel/Region)
        • Sales Footprint
        • Strategy Overview
          • Marketing Strategy
          • Product Strategy
          • Channel Strategy
  22. Assumptions & Acronyms Used
  23. Research Methodology

List of Tables

  • Table 1: Global Market Value (USD Million) Forecast by Region, 2020-2035
  • Table 2: Global Market Volume (Units) Forecast by Region, 2020-2035
  • Table 3: Global Market Value (USD Million) Forecast by Type, 2020-2035
  • Table 4: Global Market Volume (Units) Forecast by Type, 2020-2035
  • Table 5: Global Market Value (USD Million) Forecast by Application, 2020-2035
  • Table 6: Global Market Volume (Units) Forecast by Application, 2020-2035
  • Table 7: Global Market Value (USD Million) Forecast by Product Form, 2020-2035
  • Table 8: Global Market Volume (Units) Forecast by Product Form, 2020-2035
  • Table 9: Global Market Value (USD Million) Forecast by Distribution Channel, 2020-2035
  • Table 10: Global Market Volume (Units) Forecast by Distribution Channel, 2020-2035
  • Table 11: Global Market Value (USD Million) Forecast by End Use, 2020-2035
  • Table 12: Global Market Volume (Units) Forecast by End Use, 2020-2035
  • Table 13: North America Market Value (USD Million) Forecast by Country, 2020-2035
  • Table 14: North America Market Volume (Units) Forecast by Country, 2020-2035
  • Table 15: North America Market Value (USD Million) Forecast by Type, 2020-2035
  • Table 16: North America Market Volume (Units) Forecast by Type, 2020-2035
  • Table 17: North America Market Value (USD Million) Forecast by Application, 2020-2035
  • Table 18: North America Market Volume (Units) Forecast by Application, 2020-2035
  • Table 19: North America Market Value (USD Million) Forecast by Product Form, 2020-2035
  • Table 20: North America Market Volume (Units) Forecast by Product Form, 2020-2035
  • Table 21: North America Market Value (USD Million) Forecast by Distribution Channel, 2020-2035
  • Table 22: North America Market Volume (Units) Forecast by Distribution Channel, 2020-2035
  • Table 23: North America Market Value (USD Million) Forecast by End Use, 2020-2035
  • Table 24: North America Market Volume (Units) Forecast by End Use, 2020-2035
  • Table 25: Latin America Market Value (USD Million) Forecast by Country, 2020-2035
  • Table 26: Latin America Market Volume (Units) Forecast by Country, 2020-2035
  • Table 27: Latin America Market Value (USD Million) Forecast by Type, 2020-2035
  • Table 28: Latin America Market Volume (Units) Forecast by Type, 2020-2035
  • Table 29: Latin America Market Value (USD Million) Forecast by Application, 2020-2035
  • Table 30: Latin America Market Volume (Units) Forecast by Application, 2020-2035
  • Table 31: Latin America Market Value (USD Million) Forecast by Product Form, 2020-2035
  • Table 32: Latin America Market Volume (Units) Forecast by Product Form, 2020-2035
  • Table 33: Latin America Market Value (USD Million) Forecast by Distribution Channel, 2020-2035
  • Table 34: Latin America Market Volume (Units) Forecast by Distribution Channel, 2020-2035
  • Table 35: Latin America Market Value (USD Million) Forecast by End Use, 2020-2035
  • Table 36: Latin America Market Volume (Units) Forecast by End Use, 2020-2035
  • Table 37: Europe Market Value (USD Million) Forecast by Country, 2020-2035
  • Table 38: Europe Market Volume (Units) Forecast by Country, 2020-2035
  • Table 39: Europe Market Value (USD Million) Forecast by Type, 2020-2035
  • Table 40: Europe Market Volume (Units) Forecast by Type, 2020-2035
  • Table 41: Europe Market Value (USD Million) Forecast by Application, 2020-2035
  • Table 42: Europe Market Volume (Units) Forecast by Application, 2020-2035
  • Table 43: Europe Market Value (USD Million) Forecast by Product Form, 2020-2035
  • Table 44: Europe Market Volume (Units) Forecast by Product Form, 2020-2035
  • Table 45: Europe Market Value (USD Million) Forecast by Distribution Channel, 2020-2035
  • Table 46: Europe Market Volume (Units) Forecast by Distribution Channel, 2020-2035
  • Table 47: Europe Market Value (USD Million) Forecast by End Use, 2020-2035
  • Table 48: Europe Market Volume (Units) Forecast by End Use, 2020-2035
  • Table 49: East Asia Market Value (USD Million) Forecast by Country, 2020-2035
  • Table 50: East Asia Market Volume (Units) Forecast by Country, 2020-2035
  • Table 51: East Asia Market Value (USD Million) Forecast by Type, 2020-2035
  • Table 52: East Asia Market Volume (Units) Forecast by Type, 2020-2035
  • Table 53: East Asia Market Value (USD Million) Forecast by Application, 2020-2035
  • Table 54: East Asia Market Volume (Units) Forecast by Application, 2020-2035
  • Table 55: East Asia Market Value (USD Million) Forecast by Product Form, 2020-2035
  • Table 56: East Asia Market Volume (Units) Forecast by Product Form, 2020-2035
  • Table 57: East Asia Market Value (USD Million) Forecast by Distribution Channel, 2020-2035
  • Table 58: East Asia Market Volume (Units) Forecast by Distribution Channel, 2020-2035
  • Table 59: East Asia Market Value (USD Million) Forecast by End Use, 2020-2035
  • Table 60: East Asia Market Volume (Units) Forecast by End Use, 2020-2035
  • Table 61: South Asia Market Value (USD Million) Forecast by Country, 2020-2035
  • Table 62: South Asia Market Volume (Units) Forecast by Country, 2020-2035
  • Table 63: South Asia Market Value (USD Million) Forecast by Type, 2020-2035
  • Table 64: South Asia Market Volume (Units) Forecast by Type, 2020-2035
  • Table 65: South Asia Market Value (USD Million) Forecast by Application, 2020-2035
  • Table 66: South Asia Market Volume (Units) Forecast by Application, 2020-2035
  • Table 67: South Asia Market Value (USD Million) Forecast by Product Form, 2020-2035
  • Table 68: South Asia Market Volume (Units) Forecast by Product Form, 2020-2035
  • Table 69: South Asia Market Value (USD Million) Forecast by Distribution Channel, 2020-2035
  • Table 70: South Asia Market Volume (Units) Forecast by Distribution Channel, 2020-2035
  • Table 71: South Asia Market Value (USD Million) Forecast by End Use, 2020-2035
  • Table 72: South Asia Market Volume (Units) Forecast by End Use, 2020-2035
  • Table 73: Oceania Market Value (USD Million) Forecast by Country, 2020-2035
  • Table 74: Oceania Market Volume (Units) Forecast by Country, 2020-2035
  • Table 75: Oceania Market Value (USD Million) Forecast by Type, 2020-2035
  • Table 76: Oceania Market Volume (Units) Forecast by Type, 2020-2035
  • Table 77: Oceania Market Value (USD Million) Forecast by Application, 2020-2035
  • Table 78: Oceania Market Volume (Units) Forecast by Application, 2020-2035
  • Table 79: Oceania Market Value (USD Million) Forecast by Product Form, 2020-2035
  • Table 80: Oceania Market Volume (Units) Forecast by Product Form, 2020-2035
  • Table 81: Oceania Market Value (USD Million) Forecast by Distribution Channel, 2020-2035
  • Table 82: Oceania Market Volume (Units) Forecast by Distribution Channel, 2020-2035
  • Table 83: Oceania Market Value (USD Million) Forecast by End Use, 2020-2035
  • Table 84: Oceania Market Volume (Units) Forecast by End Use, 2020-2035
  • Table 85: MEA Market Value (USD Million) Forecast by Country, 2020-2035
  • Table 86: MEA Market Volume (Units) Forecast by Country, 2020-2035
  • Table 87: MEA Market Value (USD Million) Forecast by Type, 2020-2035
  • Table 88: MEA Market Volume (Units) Forecast by Type, 2020-2035
  • Table 89: MEA Market Value (USD Million) Forecast by Application, 2020-2035
  • Table 90: MEA Market Volume (Units) Forecast by Application, 2020-2035
  • Table 91: MEA Market Value (USD Million) Forecast by Product Form, 2020-2035
  • Table 92: MEA Market Volume (Units) Forecast by Product Form, 2020-2035
  • Table 93: MEA Market Value (USD Million) Forecast by Distribution Channel, 2020-2035
  • Table 94: MEA Market Volume (Units) Forecast by Distribution Channel, 2020-2035
  • Table 95: MEA Market Value (USD Million) Forecast by End Use, 2020-2035
  • Table 96: MEA Market Volume (Units) Forecast by End Use, 2020-2035

List of Figures

  • Figure 1: Global Market Volume (Units) Forecast 2020-2035
  • Figure 2: Global Market Pricing Analysis
  • Figure 3: Global Market Value (USD Million) Forecast 2020-2035
  • Figure 4: Global Market Value Share and BPS Analysis by Type, 2025 and 2035
  • Figure 5: Global Market Y-o-Y Growth Comparison by Type, 2025-2035
  • Figure 6: Global Market Attractiveness Analysis by Type
  • Figure 7: Global Market Value Share and BPS Analysis by Application, 2025 and 2035
  • Figure 8: Global Market Y-o-Y Growth Comparison by Application, 2025-2035
  • Figure 9: Global Market Attractiveness Analysis by Application
  • Figure 10: Global Market Value Share and BPS Analysis by Product Form, 2025 and 2035
  • Figure 11: Global Market Y-o-Y Growth Comparison by Product Form, 2025-2035
  • Figure 12: Global Market Attractiveness Analysis by Product Form
  • Figure 13: Global Market Value Share and BPS Analysis by Distribution Channel, 2025 and 2035
  • Figure 14: Global Market Y-o-Y Growth Comparison by Distribution Channel, 2025-2035
  • Figure 15: Global Market Attractiveness Analysis by Distribution Channel
  • Figure 16: Global Market Value Share and BPS Analysis by End Use, 2025 and 2035
  • Figure 17: Global Market Y-o-Y Growth Comparison by End Use, 2025-2035
  • Figure 18: Global Market Attractiveness Analysis by End Use
  • Figure 19: Global Market Value (USD Million) Share and BPS Analysis by Region, 2025 and 2035
  • Figure 20: Global Market Y-o-Y Growth Comparison by Region, 2025-2035
  • Figure 21: Global Market Attractiveness Analysis by Region
  • Figure 22: North America Market Incremental $ Opportunity, 2025-2035
  • Figure 23: Latin America Market Incremental $ Opportunity, 2025-2035
  • Figure 24: Europe Market Incremental $ Opportunity, 2025-2035
  • Figure 25: East Asia Market Incremental $ Opportunity, 2025-2035
  • Figure 26: South Asia Market Incremental $ Opportunity, 2025-2035
  • Figure 27: Oceania Market Incremental $ Opportunity, 2025-2035
  • Figure 28: MEA Market Incremental $ Opportunity, 2025-2035
  • Figure 29: North America Market Value Share and BPS Analysis by Country, 2025 and 2035
  • Figure 30: North America Market Value Share and BPS Analysis by Type, 2025 and 2035
  • Figure 31: North America Market Y-o-Y Growth Comparison by Type, 2025-2035
  • Figure 32: North America Market Attractiveness Analysis by Type
  • Figure 33: North America Market Value Share and BPS Analysis by Application, 2025 and 2035
  • Figure 34: North America Market Y-o-Y Growth Comparison by Application, 2025-2035
  • Figure 35: North America Market Attractiveness Analysis by Application
  • Figure 36: North America Market Value Share and BPS Analysis by Product Form, 2025 and 2035
  • Figure 37: North America Market Y-o-Y Growth Comparison by Product Form, 2025-2035
  • Figure 38: North America Market Attractiveness Analysis by Product Form
  • Figure 39: North America Market Value Share and BPS Analysis by Distribution Channel, 2025 and 2035
  • Figure 40: North America Market Y-o-Y Growth Comparison by Distribution Channel, 2025-2035
  • Figure 41: North America Market Attractiveness Analysis by Distribution Channel
  • Figure 42: North America Market Value Share and BPS Analysis by End Use, 2025 and 2035
  • Figure 43: North America Market Y-o-Y Growth Comparison by End Use, 2025-2035
  • Figure 44: North America Market Attractiveness Analysis by End Use
  • Figure 45: Latin America Market Value Share and BPS Analysis by Country, 2025 and 2035
  • Figure 46: Latin America Market Value Share and BPS Analysis by Type, 2025 and 2035
  • Figure 47: Latin America Market Y-o-Y Growth Comparison by Type, 2025-2035
  • Figure 48: Latin America Market Attractiveness Analysis by Type
  • Figure 49: Latin America Market Value Share and BPS Analysis by Application, 2025 and 2035
  • Figure 50: Latin America Market Y-o-Y Growth Comparison by Application, 2025-2035
  • Figure 51: Latin America Market Attractiveness Analysis by Application
  • Figure 52: Latin America Market Value Share and BPS Analysis by Product Form, 2025 and 2035
  • Figure 53: Latin America Market Y-o-Y Growth Comparison by Product Form, 2025-2035
  • Figure 54: Latin America Market Attractiveness Analysis by Product Form
  • Figure 55: Latin America Market Value Share and BPS Analysis by Distribution Channel, 2025 and 2035
  • Figure 56: Latin America Market Y-o-Y Growth Comparison by Distribution Channel, 2025-2035
  • Figure 57: Latin America Market Attractiveness Analysis by Distribution Channel
  • Figure 58: Latin America Market Value Share and BPS Analysis by End Use, 2025 and 2035
  • Figure 59: Latin America Market Y-o-Y Growth Comparison by End Use, 2025-2035
  • Figure 60: Latin America Market Attractiveness Analysis by End Use
  • Figure 61: Europe Market Value Share and BPS Analysis by Country, 2025 and 2035
  • Figure 62: Europe Market Value Share and BPS Analysis by Type, 2025 and 2035
  • Figure 63: Europe Market Y-o-Y Growth Comparison by Type, 2025-2035
  • Figure 64: Europe Market Attractiveness Analysis by Type
  • Figure 65: Europe Market Value Share and BPS Analysis by Application, 2025 and 2035
  • Figure 66: Europe Market Y-o-Y Growth Comparison by Application, 2025-2035
  • Figure 67: Europe Market Attractiveness Analysis by Application
  • Figure 68: Europe Market Value Share and BPS Analysis by Product Form, 2025 and 2035
  • Figure 69: Europe Market Y-o-Y Growth Comparison by Product Form, 2025-2035
  • Figure 70: Europe Market Attractiveness Analysis by Product Form
  • Figure 71: Europe Market Value Share and BPS Analysis by Distribution Channel, 2025 and 2035
  • Figure 72: Europe Market Y-o-Y Growth Comparison by Distribution Channel, 2025-2035
  • Figure 73: Europe Market Attractiveness Analysis by Distribution Channel
  • Figure 74: Europe Market Value Share and BPS Analysis by End Use, 2025 and 2035
  • Figure 75: Europe Market Y-o-Y Growth Comparison by End Use, 2025-2035
  • Figure 76: Europe Market Attractiveness Analysis by End Use
  • Figure 77: East Asia Market Value Share and BPS Analysis by Country, 2025 and 2035
  • Figure 78: East Asia Market Value Share and BPS Analysis by Type, 2025 and 2035
  • Figure 79: East Asia Market Y-o-Y Growth Comparison by Type, 2025-2035
  • Figure 80: East Asia Market Attractiveness Analysis by Type
  • Figure 81: East Asia Market Value Share and BPS Analysis by Application, 2025 and 2035
  • Figure 82: East Asia Market Y-o-Y Growth Comparison by Application, 2025-2035
  • Figure 83: East Asia Market Attractiveness Analysis by Application
  • Figure 84: East Asia Market Value Share and BPS Analysis by Product Form, 2025 and 2035
  • Figure 85: East Asia Market Y-o-Y Growth Comparison by Product Form, 2025-2035
  • Figure 86: East Asia Market Attractiveness Analysis by Product Form
  • Figure 87: East Asia Market Value Share and BPS Analysis by Distribution Channel, 2025 and 2035
  • Figure 88: East Asia Market Y-o-Y Growth Comparison by Distribution Channel, 2025-2035
  • Figure 89: East Asia Market Attractiveness Analysis by Distribution Channel
  • Figure 90: East Asia Market Value Share and BPS Analysis by End Use, 2025 and 2035
  • Figure 91: East Asia Market Y-o-Y Growth Comparison by End Use, 2025-2035
  • Figure 92: East Asia Market Attractiveness Analysis by End Use
  • Figure 93: South Asia Market Value Share and BPS Analysis by Country, 2025 and 2035
  • Figure 94: South Asia Market Value Share and BPS Analysis by Type, 2025 and 2035
  • Figure 95: South Asia Market Y-o-Y Growth Comparison by Type, 2025-2035
  • Figure 96: South Asia Market Attractiveness Analysis by Type
  • Figure 97: South Asia Market Value Share and BPS Analysis by Application, 2025 and 2035
  • Figure 98: South Asia Market Y-o-Y Growth Comparison by Application, 2025-2035
  • Figure 99: South Asia Market Attractiveness Analysis by Application
  • Figure 100: South Asia Market Value Share and BPS Analysis by Product Form, 2025 and 2035
  • Figure 101: South Asia Market Y-o-Y Growth Comparison by Product Form, 2025-2035
  • Figure 102: South Asia Market Attractiveness Analysis by Product Form
  • Figure 103: South Asia Market Value Share and BPS Analysis by Distribution Channel, 2025 and 2035
  • Figure 104: South Asia Market Y-o-Y Growth Comparison by Distribution Channel, 2025-2035
  • Figure 105: South Asia Market Attractiveness Analysis by Distribution Channel
  • Figure 106: South Asia Market Value Share and BPS Analysis by End Use, 2025 and 2035
  • Figure 107: South Asia Market Y-o-Y Growth Comparison by End Use, 2025-2035
  • Figure 108: South Asia Market Attractiveness Analysis by End Use
  • Figure 109: Oceania Market Value Share and BPS Analysis by Country, 2025 and 2035
  • Figure 110: Oceania Market Value Share and BPS Analysis by Type, 2025 and 2035
  • Figure 111: Oceania Market Y-o-Y Growth Comparison by Type, 2025-2035
  • Figure 112: Oceania Market Attractiveness Analysis by Type
  • Figure 113: Oceania Market Value Share and BPS Analysis by Application, 2025 and 2035
  • Figure 114: Oceania Market Y-o-Y Growth Comparison by Application, 2025-2035
  • Figure 115: Oceania Market Attractiveness Analysis by Application
  • Figure 116: Oceania Market Value Share and BPS Analysis by Product Form, 2025 and 2035
  • Figure 117: Oceania Market Y-o-Y Growth Comparison by Product Form, 2025-2035
  • Figure 118: Oceania Market Attractiveness Analysis by Product Form
  • Figure 119: Oceania Market Value Share and BPS Analysis by Distribution Channel, 2025 and 2035
  • Figure 120: Oceania Market Y-o-Y Growth Comparison by Distribution Channel, 2025-2035
  • Figure 121: Oceania Market Attractiveness Analysis by Distribution Channel
  • Figure 122: Oceania Market Value Share and BPS Analysis by End Use, 2025 and 2035
  • Figure 123: Oceania Market Y-o-Y Growth Comparison by End Use, 2025-2035
  • Figure 124: Oceania Market Attractiveness Analysis by End Use
  • Figure 125: MEA Market Value Share and BPS Analysis by Country, 2025 and 2035
  • Figure 126: MEA Market Value Share and BPS Analysis by Type, 2025 and 2035
  • Figure 127: MEA Market Y-o-Y Growth Comparison by Type, 2025-2035
  • Figure 128: MEA Market Attractiveness Analysis by Type
  • Figure 129: MEA Market Value Share and BPS Analysis by Application, 2025 and 2035
  • Figure 130: MEA Market Y-o-Y Growth Comparison by Application, 2025-2035
  • Figure 131: MEA Market Attractiveness Analysis by Application
  • Figure 132: MEA Market Value Share and BPS Analysis by Product Form, 2025 and 2035
  • Figure 133: MEA Market Y-o-Y Growth Comparison by Product Form, 2025-2035
  • Figure 134: MEA Market Attractiveness Analysis by Product Form
  • Figure 135: MEA Market Value Share and BPS Analysis by Distribution Channel, 2025 and 2035
  • Figure 136: MEA Market Y-o-Y Growth Comparison by Distribution Channel, 2025-2035
  • Figure 137: MEA Market Attractiveness Analysis by Distribution Channel
  • Figure 138: MEA Market Value Share and BPS Analysis by End Use, 2025 and 2035
  • Figure 139: MEA Market Y-o-Y Growth Comparison by End Use, 2025-2035
  • Figure 140: MEA Market Attractiveness Analysis by End Use
  • Figure 141: Global Market - Tier Structure Analysis
  • Figure 142: Global Market - Company Share Analysis

Explore Similar Insights

Future Market Insights

Bottle Sealing Wax Market