Waxed Paper Market Size and Share Forecast Outlook From 2024 to 2034

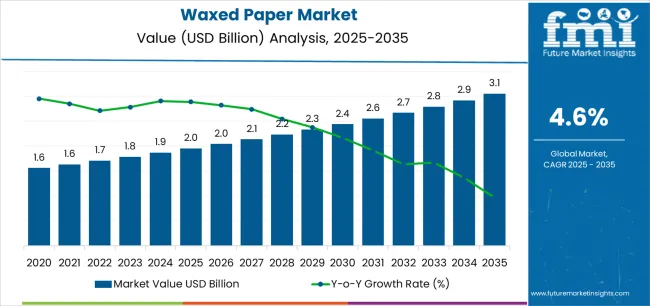
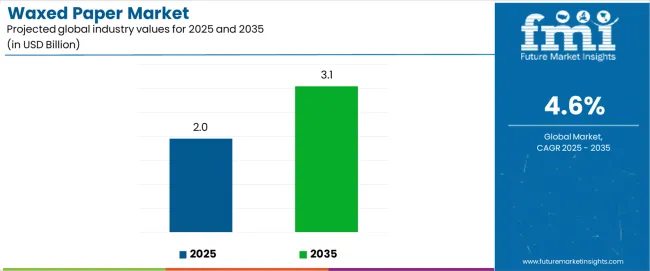
The global waxed paper market is estimated to be valued at USD 1,863.7 million in 2024. Global demand for waxed paper is predicted to rise at a steady CAGR of 4.8% throughout the forecast period. By 2034, the market is expected to reach USD 2,991.8 million.

Attributes Key Insights
Base Value (2023) USD 1,796.3 million
Estimated Global Waxed Paper Market Size (2024E) USD 1,863.7 million
Projected Waxed Paper Market Value (2034F) USD 2,991.8 million
Value-based CAGR (2024 to 2034) 4.8%

Top Highlights of the Waxed Paper Market

  • The market is projected to generate an incremental growth opportunity of USD 1,195 million and is predicted to expand 1.6 times the current market value by 2034.
  • Exponential expansion of food delivery services is contributing to the growth of the waxed paper market.
  • Rising inclination toward customization is creating high demand for custom-printed waxed paper specially designed according to the end-use purpose.
  • Growing demand for food delivery services and increasing fast food consumption are driving demand for waxed paper.
  • Increasing consumption of packaged food necessitates the use of packaging that maintains its freshness and quality, leading to growing adoption of wax paper.
  • Growing demand for extended product shelf life is driving the widespread use of waxed paper in food packaging due to its barrier properties.
  • Wide applications of waxed paper in food and increasing utilization in non-food industries are contributing to market growth.

Comparison of Historical vs Future Outlook for the Waxed Paper Market (2019 to 2023 vs 2024 to 2034)

From 2019 to 2023, the global waxed paper market experienced a CAGR of 1.8%.

  • Manufacturers developed waxed paper grades like paraffin, vegetable, and synthetic wax for specific applications. They offered enhanced printability, moisture resistance, and compatibility with several food types.
  • Initially used for food packaging, waxed paper has since expanded to non-food industries due to its moisture resistance and protective properties.
  • Waxed paper producers have developed product formats, sizes, and customization options to cater to changing consumer tastes and market conditions, offering custom printing, branding, and embossing capabilities.
  • Advancements in coating technology and manufacturing procedures have enabled better performance and cost-effectiveness in waxing paper production, improving quality and uniformity.
  • The waxed paper industry has experienced market consolidation, with large corporations acquiring small-scale competitors to expand their product offerings and market penetration.
  • Globalization has led to manufacturers expanding their operations abroad to serve regional markets and capitalize on developing economies.

Key Trends Shaping the Waxed Paper Market

  • Food, beverage, cosmetics, and pharmaceutical industries recognize the growing demand for sustainable packaging solutions, particularly in producing eco-friendly waxed paper.
  • New coating technology advancements improve barrier, grease, and moisture resistance in waxed paper goods.
  • Companies are developing new formulations and application techniques for several packaging applications.
  • Health-conscious customers demand natural and organic products, leading to increasing need for waxed paper packaging due to its perceived naturalness and sustainability.
  • E-commerce growth is driving demand for packaging solutions that offer product protection, branding, and sustainability.
  • Wax paper is set to be a popular choice for packaging food, cosmetics, and personal hygiene products.
  • The waxed paper industry is leveraging partnerships among manufacturers, suppliers, retailers, and package converters to promote innovation, sustainability, waste reduction, sustainable sourcing, and research & development.

Challenges for Companies/Manufacturers in the Waxed Paper Market

  • Waxed paper faces competition from alternatives such as plastic wrap and aluminum foil. It is expected to decrease demand if it offers superior barrier qualities, ease of use, or affordability.
  • Consumers are moving toward packaging solutions that are more environmentally friendly and sustainable. Demand for waxed paper is set to decline due to this change in consumer behavior.
  • Price fluctuations of raw materials are expected to impact waxed paper products' total cost structure.

Semi-annual Market Update for the Waxed Paper Market

The table presents the expected CAGR for waxed paper market over several semi-annual periods spanning from 2023 to 2034. In the first half (H1) of the decade from 2023 to 2033, the market is predicted to surge at a CAGR of 4.9%, followed by a slightly lower growth rate of 4.2% in the second half (H2) of the same decade.

Moving into the subsequent period, from H1 2024 to H2 2034, the CAGR is projected to increase to 5.1% in the first half and lower growth rate at 4.4% in the second half.

Particular Value CAGR
H1 4.9% (2023 to 2033)
H2 4.2% (2023 to 2033)
H1 5.1% (2024 to 2034)
H2 4.4% (2024 to 2034)

Analysis of Top Countries Producing, Formulating, Packaging, Distributing, and Using Waxed Paper

The table below shows the anticipated growth rates of several countries. India, Japan, and South Africa are expected to record high CAGRs of 8.2%, 7.0%, and 7.1%, respectively, through 2034.

Countries Value-based CAGR (2024 to 2034)
United States 4.2%
Canada 5.3%
Brazil 4.4 %
Mexico 5.1%
Germany 2.4%
France 3.9%
United Kingdom 4.7%
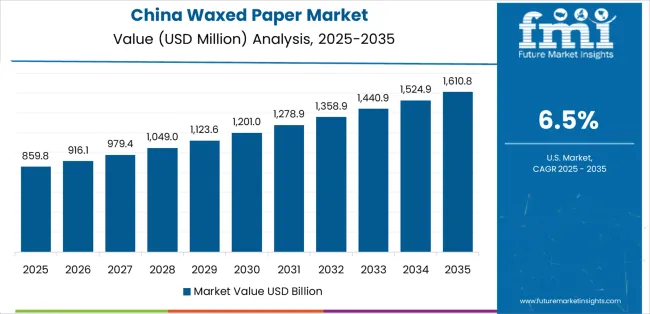
China 6.6%
India 8.2%
Japan 7.0%
GCC Countries 5.0%
South Africa 7.1%

Increasing Revenue of Food Service Industry in the United States Augments Sales

The waxed paper industry in the United States is expected to expand at a CAGR of 4.2%. Key factors supporting the market growth are:

  • Adoption of waxed paper in the United States is being driven by rising consumer preferences for on-the-go snacks and fast food.
  • In line with international trends, the United States is experiencing a surging importance of sustainable packaging options.
  • Wax paper is becoming increasingly well-liked as a sustainable substitute for traditional plastic packaging.
  • It is mainly gaining prominence across industries where products are manufactured from renewable resources and have biodegradable coatings.

Rising Government Norms and Regulations Driving Demand in Germany

The waxed paper market in Germany is expected to surge at a CAGR of 2.4% through 2034. This is attributable to a combination of factors, including:

  • Local and foreign firms are vying for dominance in Germany’s fiercely competitive wax paper market.
  • The country’s government is implementing norms and regulations controlling food packaging materials to guarantee food safety and consumer protection.
  • To ensure the security and caliber of their goods, manufacturers of wax paper must abide by all applicable laws, particularly those about food contact materials and packaging standards.

Booming Food and Beverage Sector Fueling Sales in South Africa

South Africa is expected to surge at 7.1% CAGR through 2034. Top factors supporting the market expansion in the country include:
  • South Africa’s quick economic development and urbanization are surging food product consumption, raising the need for packaging materials like waxed paper.
  • Demand for practical and hygienic food packaging solutions is increasing due to the growing middle class, urbanization trends, and changing lifestyles.
  • Growing disposable income, eating patterns, and desire for convenience meals contribute to South Africa’s food and beverage sector's strong expansion.

Eco-friendliness of Waxed Paper Expected to Proliferate Product Sales in China

The waxed paper market in China is expected to surge at a CAGR of 6.6% by 2034. Emerging patterns in China are as follows:

  • Improvements in quality, performance, and cost-effectiveness are driven by technological developments in processes used to manufacture waxed paper, coating technologies, and product innovations.
  • Manufacturers invest in research & development to create cutting-edge coatings, increase production efficiency, and improve product quality to fulfill the market's changing demands.

Highly Developed E-commerce Industry to Boost Demand in India

India's waxed paper market is projected to surge at an 8.2% CAGR during the forecast period. Key factors driving the market growth are as follows:

  • Demand for packaging materials appropriate for online retail applications is rising due to India's explosive growth in the e-commerce industry.
  • Wax paper is utilized in several sectors, including food packaging, industrial packaging, medicines, cosmetics, and flower arrangements. This is due to its adaptability and protective properties.

Waxed Paper Industry Analysis by Top Investment Segments

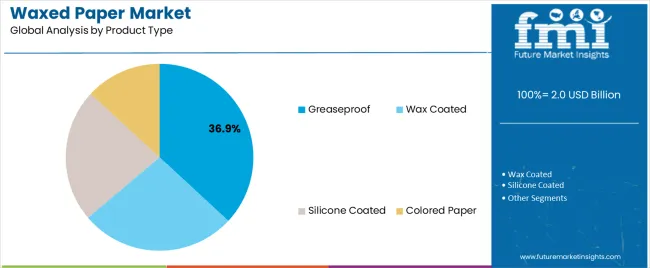
The section offers profound insights into leading segments in the global waxed paper market. Based on product type, the greaseproof segment currently dominates the global market and is expected to surge at 3.9% CAGR through 2034. In terms of end-use, the food segment is anticipated to register a steady CAGR of 4.6% through 2034.

Segment Value CAGR (2024 to 2034)
Food (End-use) 4.6%
Greaseproof (Product Type) 3.9%

Multiple Advantages of Greaseproof Paper to Make Them Popular

  • Significant use of greaseproof paper in food packaging contributes to high demand for greaseproof paper through 2034.
  • Fast food companies are widely adopting greaseproof paper, and the increasing popularity of online food delivery is contributing to its wide adoption.
  • Increasing focus on branding and customization is expected to surge demand for colored paper during the forecast period.

Food Industry Captures a Dominating Share in Waxed Paper Market

  • Waxed paper is an ideal solution for food packaging applications spurred by its ability to prevent oil and grease penetration.
  • Waxed paper is coated with food-safe wax, is suitable for food contact, and is normally used for packaging & wrapping different types of foodstuff.
  • Waxed paper is used for packaging or wrapping ready-to-eat food, bakery, confectionery, dairy, and meat products characterized by high humidity.
  • Growing food consumption and increased application of specialty paper in packaging are expected to attain a leading market share.

Competitive Landscape of the Waxed Paper Market

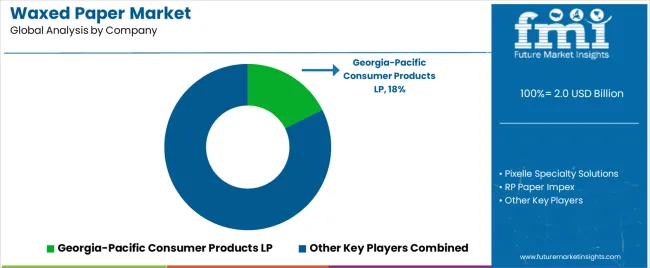
Leading companies are embracing sustainability by incorporating recyclable and biodegradable features in waxed paper. They are adhering to global environmental trends to meet increasing demand for eco-friendly packaging. Key market players emphasize customization services such as custom printing, embossing, or branding on waxed paper products.

Leading companies also focus on developing innovative wax coatings with safe coating materials and enhanced properties. They are researching and developing proprietary coating technologies that provide superior performance.

Recent activities and developments implemented by leading players in the market

  • In July 2023, Pixelle Specialty Solutions launched FlexArmor for uncoated applications and SelectArmor with a coated surface for enhanced printability, its new barrier paper solutions brand.
  • In March 2023, Ahlstrom and Istituto Stampa developed a compostable butter and margarine packaging.
  • In December 2023, Georgia-Pacific invested USD 425 million to expand its Dixie facility in Jackson, Tennessee.

Leading Companies in the Waxed Paper Market

  • Georgia-Pacific Consumer Products LP
  • Pixelle Specialty Solutions
  • RP Paper Impex
  • Nordic paper
  • Asia Pulp & Paper Group
  • MPI Papermills Inc.
  • Ahlstrom-Munksjo Oyj
  • Reynolds Group
  • Delfort Group Ag
  • Cosmoplast
  • JK Paper Ltd.
  • Drewsen Spezialpapiere GmbH & Co. KG
  • Metsä Group
  • Vizille paper mills
  • Sun Pack Corporation
  • Segezha Group
  • Pregis LLC
  • SIMPAC Inc.
  • KRPA Holding CZ a.s.
  • Napco National
  • The Griff Network
  • BiOrigin Specialty Products (BSP)

Key Coverage in the Waxed Paper Market Report

  • Adjacent Study on Paraffin Paper Market, Greaseproof Paper Market, and Paraffin-Coated Paper Market
  • Information about Wax-Coated Paper Market
  • Detailed Analysis of Waxed Paper Products
  • Wax-Coated Packaging Market Vs. Water-Resistant Paper Market Analysis
  • Factors Propelling the Waxed Paper Sheets Market Growth
  • Growth Prospects for Food Grade Waxed Paper Market in India
  • Trend in the Waxed Paper Rolls Market
  • Sales of Waxed Paper
  • Food Grade Waxed Paper Applications
  • Waxed Paper Sheets Market Outlook
  • Top Players in the Waxed Paper Packaging Market

Scope and Coverage of the Waxed Paper Market Report

By Thickness:

  • Up to 50 GSM
  • 50 to 100 GSM
  • Above 100 GSM

By Paper Grade:

  • Bleached
  • Unbleached

By Product Type:

  • Wax Coated
  • Greaseproof
  • Silicone Coated
  • Colored Paper

By End-use:

  • Food
    • Ready to Eat Food
    • Bakery & Confectionery
    • Dairy Products
    • Other Food
  • Other Industrial

By Application:

  • Printing
  • Packaging

By Region:

  • North America
  • Latin America
  • Europe
  • Middle East and Africa
  • East Asia
  • South Asia
  • Oceania

Table of Content

  • 1. Executive Summary
  • 2. Market Overview
  • 3. Key Market Trends
  • 4. Key Success Factors
  • 5. Global Market Demand Analysis 2019 to 2023 and Forecast, 2024 to 2034
  • 6. Global Market - Pricing Analysis
  • 7. Global Market Demand (in Value or Size in USD million) Analysis 2019 to 2023 and Forecast, 2024 to 2034
  • 8. Market Background
  • 9. Global Market Analysis 2019 to 2023 and Forecast 2024 to 2034, By Thickness
    • 9.1. Up to 50 GSM
    • 9.2. 50 to 100 GSM
    • 9.3. Above 100 GSM
  • 10. Global Market Analysis 2019 to 2023 and Forecast 2024 to 2034, By Product Type
    • 10.1. Wax Coated
    • 10.2. Greaseproof
    • 10.3. Silicone Coated
    • 10.4. Colored Paper
  • 11. Global Market Analysis 2019 to 2023 and Forecast 2024 to 2034, By Paper Grade
    • 11.1. Bleached
    • 11.2. Unbleached
  • 12. Global Market Analysis 2019 to 2023 and Forecast 2024 to 2034, By Applications
    • 12.1. Printing
    • 12.2. Packaging
  • 13. Global Market Analysis 2019 to 2023 and Forecast 2024 to 2034, By End Use
    • 13.1. Food
      • 13.1.1. Ready to Eat Food
      • 13.1.2. Bakery & Confectionery
      • 13.1.3. Dairy Products
      • 13.1.4. Other Food
    • 13.2. Other Industrial
  • 14. Global Market Analysis 2019 to 2023 and Forecast 2024 to 2034, By Region
    • 14.1. North America
    • 14.2. Latin America
    • 14.3. East Asia
    • 14.4. South Asia
    • 14.5. Europe
    • 14.6. Middle East and Africa
    • 14.7. Oceania
  • 15. North America Market Analysis 2019 to 2023 and Forecast 2024 to 2034
  • 16. Latin America Market Analysis 2019 to 2023 and Forecast 2024 to 2034
  • 17. East Asia Market Analysis 2019 to 2023 and Forecast 2024 to 2034
  • 18. South Asia Market Analysis 2019 to 2023 and Forecast 2024 to 2034
  • 19. Europe Market Analysis 2019 to 2023 and Forecast 2024 to 2034
  • 20. Middle East and Africa Market Analysis 2019 to 2023 and Forecast 2024 to 2034
  • 21. Oceania Market Analysis 2019 to 2023 and Forecast 2024 to 2034
  • 22. Country wise Market Analysis 2024 to 2034
  • 23. Market Structure Analysis
  • 24. Competition Analysis
    • 24.1. Georgia-Pacific Consumer Products LP
    • 24.2. Pixelle Speciality Solutions
    • 24.3. RP Paper Impex
    • 24.4. Nordic paper
    • 24.5. Asia Pulp & Paper Group
    • 24.6. MPI Papermills Inc.
    • 24.7. Ahlstrom-Munksjo Oyj
    • 24.8. Reynolds Group
    • 24.9. Delfort Group Ag
    • 24.10. Cosmoplast
    • 24.11. JK Paper Ltd
    • 24.12. Drewsen Spezialpapiere GmbH & Co. KG
    • 24.13. Metsä Group
    • 24.14. Vizille paper mills
    • 24.15. Sun Pack Corporation
    • 24.16. Segezha Group
    • 24.17. Pregis LLC
    • 24.18. SIMPAC Inc
    • 24.19. KRPA Holding CZ a.s.
    • 24.20. Napco National
    • 24.21. The Griff Network
    • 24.22. BiOrigin Specialty Products (BSP)
  • 25. Assumptions and Acronyms Used
  • 26. Research Methodology

List of Tables

Table 01: Global Market Value (US$ million) By Thickness, 2019H to 2034F

Table 02: Global Market Volume (tons) By Thickness, 2019H to 2034F

Table 03: Global Market Value (US$ million) by Product Type, 2019H to 2034F

Table 04: Global Market Volume (tons) by Product Type, 2019H to 2034F

Table 05: Global Market Value (US$ million) by Application, 2019H to 2034F

Table 06: Global Market Volume (tons) by Application, 2019H to 2034F

Table 07: Global Market Value (US$ million) by Paper Grade, 2019H to 2034F

Table 08: Global Market Volume (US$ million) by Paper Grade, 2019H to 2034F

Table 09: Global Market Value (US$ million) by End-use, 2019H to 2034F

Table 10: Global Market Value (US$ million) by End-use, 2019H to 2034F

Table 11: Global Market Volume (tons) by End-use, 2019H to 2034F

Table 12: Global Market Volume (tons) by End-use, 2019H to 2034F

Table 13: Global Market Value (US$ million) by Region, 2019H to 2034F

Table 14: Global Market Volume (tons) by Region, 2019H to 2034F

Table 15: North America Market Value (US$ million) By Thickness, 2019H to 2034F

Table 16: North America Market Volume (tons) By Thickness, 2019H to 2034F

Table 17: North America Market Value (US$ million) by Product Type, 2019H to 2034F

Table 18: North America Market Volume (tons) by Product Type, 2019H to 2034F

Table 19: North America Market Value (US$ million) by Application, 2019H to 2034F

Table 20: North America Market Volume (tons) by Application, 2019H to 2034F

Table 21: North America Market Value (US$ million) by Paper Grade, 2019H to 2034F

Table 22: North America Market Volume (tons) by Paper Grade, 2019H to 2034F

Table 23: North America Market Value (US$ million) by End-use, 2019H to 2034F

Table 24: North America Market Value (US$ million) by End-use, 2019H to 2034F

Table 25: North America Market Volume (tons) by End-use, 2019H to 2034F

Table 26: North America Market Volume (tons) by End-use, 2019H to 2034F

Table 27: North America Market Value (US$ million) by Country, 2019H to 2034F

Table 28: North America Market Volume (tons) by Country, 2019H to 2034F

Table 29: Latin America Market Value (US$ million) By Thickness, 2019H to 2034F

Table 30: Latin America Market Volume (tons) By Thickness, 2019H to 2034F

Table 31: Latin America Market Value (US$ million) by Product Type, 2019H to 2034F

Table 32: Latin America Market Volume (tons) by Product Type, 2019H to 2034F

Table 33: Latin America Market Value (US$ million) by Application, 2019H to 2034F

Table 34: Latin America Market Volume (tons) by Application, 2019H to 2034F

Table 35: Latin America Market Value (US$ million) by Paper Grade, 2019H to 2034F

Table 36: Latin America Market Volume (tons) by Paper Grade, 2019H to 2034F

Table 37: Latin America Market Value (US$ million) by End-use, 2019H to 2034F

Table 38: Latin America Market Value (US$ million) by End-use, 2019H to 2034F

Table 39: Latin America Market Volume (tons) by End-use, 2019H to 2034F

Table 40: Latin America Market Volume (tons) by End-use, 2019H to 2034F

Table 41: Latin America Market Value (US$ million) by Country, 2019H to 2034F

Table 42: Latin America Market Volume (tons) by Country, 2019H to 2034F

Table 43: East Asia Market Value (US$ million) By Thickness, 2019H to 2034F

Table 44: East Asia Market Volume (tons) By Thickness, 2019H to 2034F

Table 45: East Asia Market Value (US$ million) by Product Type, 2019H to 2034F

Table 46: East Asia Market Volume (tons) by Product Type, 2019H to 2034F

Table 47: East Asia Market Value (US$ million) by Application, 2019H to 2034F

Table 48: East Asia Market Volume (tons) by Application, 2019H to 2034F

Table 49: East Asia Market Value (US$ million) by Paper Grade, 2019H to 2034F

Table 50: East Asia Market Volume (tons) by Paper Grade, 2019H to 2034F

Table 51: East Asia Market Value (US$ million) by End-use, 2019H to 2034F

Table 52: East Asia Market Value (US$ million) by End-use, 2019H to 2034F

Table 53: East Asia Market Volume (tons) by End-use, 2019H to 2034F

Table 54: East Asia Market Volume (tons) by End-use, 2019H to 2034F

Table 55: East Asia Market Value (US$ million) by Country, 2019H to 2034F

Table 56: East Asia Market Volume (tons) by Country, 2019H to 2034F

Table 57: Europe Market Value (US$ million) By Thickness, 2019H to 2034F

Table 58: Europe Market Volume (tons) By Thickness, 2019H to 2034F

Table 59: Europe Market Value (US$ million) by Product Type, 2019H to 2034F

Table 60: Europe Market Volume (tons) by Product Type, 2019H to 2034F

Table 61: Europe Market Value (US$ million) by Application, 2019H to 2034F

Table 62: Europe Market Volume (tons) by Application, 2019H to 2034F

Table 63: Europe Market Value (US$ million) by Paper Grade, 2019H to 2034F

Table 64: Europe Market Volume (tons) by Paper Grade, 2019H to 2034F

Table 65: Europe Market Value (US$ million) by End-use, 2019H to 2034F

Table 66: Europe Market Volume (tons) by End-use, 2019H to 2034F

Table 67: Europe Market Value (US$ million) by Country, 2019H to 2034F

Table 68: Europe Market Volume (tons) by Country, 2019H to 2034F

Table 69: Middle East and Africa Market Value (US$ million) By Thickness, 2019H to 2034F

Table 70: Middle East and Africa Market Volume (tons) By Thickness, 2019H to 2034F

Table 71: Middle East and Africa Market Value (US$ million) by Product Type, 2019H to 2034F

Table 72: Middle East and Africa Market Volume (tons) by Product Type, 2019H to 2034F

Table 73: Middle East and Africa Market Value (US$ million) by Application, 2019H to 2034F

Table 74: Middle East and Africa Market Volume (tons) by Application, 2019H to 2034F

Table 75: Middle East and Africa Market Value (US$ million) by Paper Grade, 2019H to 2034F

Table 76: Middle East and Africa Market Volume (tons) by Paper Grade, 2019H to 2034F

Table 77: Middle East and Africa Market Value (US$ million) by End-use, 2019H to 2034F

Table 78: Middle East and Africa Market Volume (tons) by End-use, 2019H to 2034F

Table 79: Middle East and Africa Market Value (US$ million) by Country, 2019H to 2034F

Table 80: Middle East and Africa Market Volume (tons) by Country, 2019H to 2034F

Table 81: South Asia Market Value (US$ million) By Thickness, 2019H to 2034F

Table 82: South Asia Market Volume (tons) By Thickness, 2019H to 2034F

Table 83: South Asia Market Value (US$ million) by Product Type, 2019H to 2034F

Table 84: South Asia Market Volume (tons) by Product Type, 2019H to 2034F

Table 85: South Asia Market Value (US$ million) by Application, 2019H to 2034F

Table 86: South Asia Market Volume (tons) by Application, 2019H to 2034F

Table 87: South Asia Market Value (US$ million) by Paper Grade, 2019H to 2034F

Table 88: South Asia Market Volume (tons) by Paper Grade, 2019H to 2034F

Table 89: South Asia Market Value (US$ million) by End-use, 2019H to 2034F

Table 90: South Asia Market Value (US$ million) by End-use, 2019H to 2034F

Table 91: South Asia Market Volume (tons) by End-use, 2019H to 2034F

Table 92: South Asia Market Volume (tons) by End-use, 2019H to 2034F

Table 93: South Asia Market Value (US$ million) by Country, 2019H to 2034F

Table 94: South Asia Market Volume (tons) by Country, 2019H to 2034F

Table 95: Oceania Market Volume (tons) By Thickness, 2019H to 2034F

Table 96: Oceania Market Value (US$ million) by Product Type, 2019H to 2034F

Table 97: Oceania Market Volume (tons) by Product Type, 2019H to 2034F

Table 98: Oceania Market Value (US$ million) by Application, 2019H to 2034F

Table 99: Oceania Market Volume (tons) by Application, 2019H to 2034F

Table 100: Oceania Market Value (US$ million) by Paper Grade, 2019H to 2034F

Table 101: Oceania Market Volume (tons) by Paper Grade, 2019H to 2034F

Table 102: Oceania Market Value (US$ million) by End-use, 2019H to 2034F

Table 103: Oceania Market Value (US$ million) by End-use, 2019H to 2034F

Table 104: Oceania Market Volume (tons) by End-use, 2019H to 2034F

Table 105: Oceania Market Volume (tons) by End-use, 2019H to 2034F

Table 106: Oceania Market Value (US$ million) by Country, 2019H to 2034F

Table 107: Oceania Market Volume (tons) by Country, 2019H to 2034F

List of Figures

Figure 01: Global Market Share Analysis, by Thickness, 2023E to 2034F

Figure 02: Global Market Y-o-Y Analysis, by Thickness, 2019H to 2034F

Figure 03: Global Market Attractiveness Analysis, by Thickness, 2023E to 2034F

Figure 04: Global Market Share Analysis, by Product, 2023E to 2034F

Figure 05: Global Market Y-o-Y Analysis, by Product, 2019H to 2034F

Figure 06: Global Market Attractiveness Analysis, by Product, 2023E to 2034F

Figure 07: Global Market Share Analysis, by Application, 2023E to 2034F

Figure 08: Global Market Y-o-Y Analysis, by Application, 2019H to 2034F

Figure 09: Global Market Attractiveness Analysis, by Application, 2023E to 2034F

Figure 10: Global Market Share Analysis, by Paper Grade, 2023E to 2034F

Figure 11: Global Market Y-o-Y Analysis, by Paper Grade, 2019H to 2034F

Figure 12: Global Market Attractiveness Analysis, by Paper Grade, 2023E to 2034F

Figure 13: Global Market Share Analysis, by End-use, 2023E to 2034F

Figure 14: Global Market Y-o-Y Analysis, by End-use, 2019H to 2034F

Figure 15: Global Market Attractiveness Analysis, by End-use, 2023E to 2034F

Figure 16: Global Market Share Analysis, by Region, 2023E to 2034F

Figure 17: Global Market Y-o-Y Analysis, by Region, 2019H to 2034F

Figure 18: Global Market Attractiveness Analysis, by Region, 2023E to 2034F

Figure 19: North America Market Attractiveness Analysis, By Thickness, 2023E to 2034F

Figure 20: North America Market Y-o-Y Analysis, by Product, 2019H to 2034F

Figure 21: North America Market Value Share Analysis, by Application 2023(E)

Figure 22: North America Market Value Share Analysis, by Paper Grade 2023(E)

Figure 23: North America Market Value Share Analysis, by End Use 2023(E)

Figure 24: North America Market Share Analysis, by Country, 2023E to 2034F

Figure 25: Latin America Market Y-o-Y Analysis, By Thickness, 2019H to 2034F

Figure 26: Latin America Market Y-o-Y Analysis, by Product, 2019H to 2034F

Figure 27: Latin America Market Value Share Analysis, by Application 2023(E)

Figure 28: Latin America Market Value Share Analysis, by Paper Grade 2023(E)

Figure 29: Latin America Market Value Share Analysis, by End Use 2023(E)

Figure 30: Latin America Market Share Analysis, by Country, 2023E to 2034F

Figure 31: East Asia Market Y-o-Y Analysis, By Thickness, 2019H to 2034F

Figure 32: East Asia Market Y-o-Y Analysis, by Product, 2019H to 2034F

Figure 33: East Asia Market Value Share Analysis, by Application 2023(E)

Figure 34: East Asia Market Value Share Analysis, by Paper Grade 2023(E)

Figure 35: East Asia Market Value Share Analysis, by End Use 2023(E)

Figure 36: East Asia Market Share Analysis, by Country, 2023E to 2034F

Figure 37: East Asia Market Y-o-Y Analysis, By Thickness, 2019H to 2034F

Figure 38: Europe Market Y-o-Y Analysis, By Thickness, 2019H to 2034F

Figure 39: Europe Market Y-o-Y Analysis, by Product, 2019H to 2034F

Figure 40: Europe Market Value Share Analysis, by Application 2023(E)

Figure 41: Europe Market Value Share Analysis, by Paper Grade 2023(E)

Figure 42: Europe Market Value Share Analysis, by End Use 2023(E)

Figure 43: Middle East and Africa Market Y-o-Y Analysis, By Thickness, 2019H to 2034F

Figure 44: Middle East and Africa Market Y-o-Y Analysis, by Product, 2019H to 2034F

Figure 45: Middle East and Africa Market Value Share Analysis, by Paper Grade 2023(E)

Figure 46: Middle East and Africa Market Share Analysis, by Country, 2023E to 2034F

Figure 47: South Asia Market Y-o-Y Analysis, By Thickness, 2019H to 2034F

Figure 48: South Asia Market Y-o-Y Analysis, by Product, 2019H to 2034F

Figure 49: South Asia Market Value Share Analysis, by Paper Grade 2023(E)

Figure 50: South Asia Market Share Analysis, by Country, 2023E to 2034F

Figure 51: Oceania Market Y-o-Y Analysis, By Thickness, 2019H to 2034F

Figure 52: Oceania Market Y-o-Y Analysis, by Product, 2019H to 2034F

Figure 53: Oceania Market Value Share Analysis, by Paper Grade 2023(E)

Figure 54: Oceania Market Share Analysis, by Country, 2023E to 2034F

Frequently Asked Questions

How big is the waxed paper market?

The global waxed paper market is estimated to reach USD 1,863.7 million in 2024.

What is the demand outlook for waxed paper?

Global waxed paper demand is set to expand at 4.8% CAGR through 2034.

What is the expected market size for 2034?

The global waxed paper market is anticipated to reach USD 2,991.8 million by 2034.

What is driving the global waxed paper market?

Barrier and transfer-proof properties of waxed paper to maintain freshness of food.

Who are the leading manufacturers of waxed paper?

Asia Pulp & Paper Group, Nordic Paper AS, and Metsä Group are the leading players.

Explore Paper Packaging Insights

Future Market Insights

Waxed Paper Market