The Paperboard Partition market is experiencing steady growth owing to the rising demand for sustainable, lightweight, and cost-efficient packaging solutions across industries. Increasing awareness toward environmental conservation and the growing preference for recyclable and biodegradable packaging materials have significantly driven the adoption of paperboard partitions.
The market outlook is supported by the expansion of e-commerce, food delivery, and logistics sectors where protective packaging plays a crucial role in ensuring product safety and reducing material waste. Continuous advancements in paperboard manufacturing and coating technologies have enhanced the strength, moisture resistance, and visual appeal of partitions, making them suitable for a wider range of applications.
Moreover, the transition of major packaging manufacturers toward eco-friendly materials and the implementation of global sustainability standards have reinforced the market’s positive trajectory As industries continue to prioritize circular economy practices and consumers favor green packaging, the paperboard partition market is expected to witness sustained expansion globally.
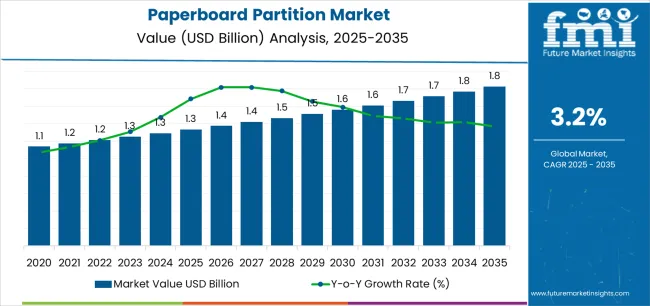
| Metric | Value |
|---|---|
| Paperboard Partition Market Estimated Value in (2025E) | USD 1.3 billion |
| Paperboard Partition Market Forecast Value in (2035F) | USD 1.8 billion |
| Forecast CAGR (2025 to 2035) | 3.2% |
The market is segmented by Grade, Product, and End use and region. By Grade, the market is divided into Bleached and Unbleached. In terms of Product, the market is classified into White kraft and Brown kraft. Based on End use, the market is segmented into Food and beverages, Personal care, Electronic goods, Automotive, Pharmaceuticals, and Other industrial. Regionally, the market is classified into North America, Latin America, Western Europe, Eastern Europe, Balkan & Baltic Countries, Russia & Belarus, Central Asia, East Asia, South Asia & Pacific, and the Middle East & Africa.
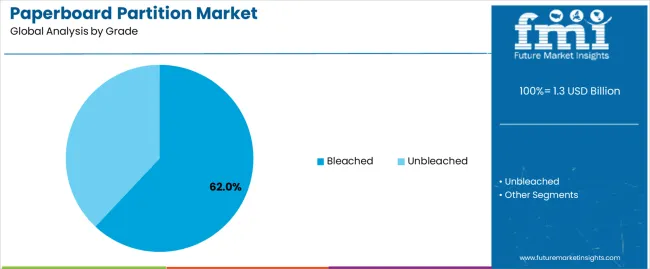
The bleached grade segment is projected to hold 62.00% of the paperboard partition market revenue share in 2025, making it the leading grade type. This dominance has been driven by the superior appearance, cleanliness, and printability associated with bleached paperboard, which enhances brand presentation and consumer appeal.
The growing use of premium packaging in food, beverage, cosmetics, and pharmaceutical sectors has significantly contributed to the expansion of this segment. Additionally, the improved surface quality and brightness of bleached paperboard support advanced printing techniques and labeling, thereby strengthening its demand among brand-conscious manufacturers.
The ability to provide consistent performance, along with excellent strength and durability, has positioned this segment as a preferred choice for packaging that requires both protection and aesthetic value The rising consumer inclination toward high-quality, visually appealing, and sustainable packaging materials continues to propel the growth of the bleached grade segment in the paperboard partition market.
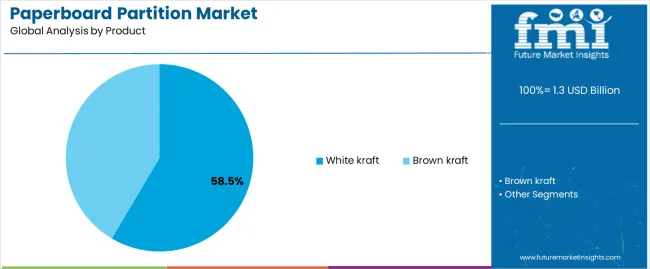
The white kraft product segment is expected to capture 58.50% of the paperboard partition market revenue share in 2025, making it the dominant product type. This growth has been influenced by the segment’s high strength-to-weight ratio, recyclability, and suitability for heavy-duty applications. White kraft partitions are extensively utilized for packaging fragile and perishable goods due to their superior resistance to tearing and moisture absorption.
The segment has gained traction from the expanding use of eco-friendly packaging in consumer goods and industrial sectors, where durability and sustainability are key considerations. The visual appeal of white kraft material also enhances its adoption in retail and branded packaging applications.
Furthermore, advancements in pulp refining and coating technologies have improved the structural integrity and printability of kraft-based partitions, driving their acceptance across multiple industries The combination of strength, environmental compatibility, and aesthetic performance continues to support the segment’s leadership in the global paperboard partition market.
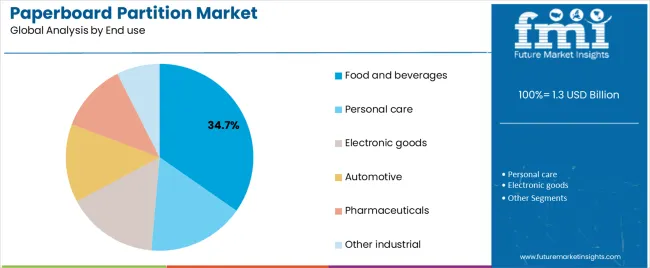
The food and beverages segment is anticipated to account for 34.70% of the paperboard partition market revenue in 2025, making it the leading end-use category. The growth of this segment has been driven by the increasing demand for safe, sustainable, and cost-effective packaging solutions for food products, beverages, and ready-to-eat meals. Paperboard partitions are widely adopted to prevent product damage during storage and transit while maintaining hygiene and product integrity.
The segment’s expansion is supported by the rising consumption of packaged and convenience foods, coupled with strict regulations promoting eco-friendly packaging materials. Furthermore, food and beverage manufacturers are increasingly opting for recyclable paperboard partitions to align with sustainability goals and reduce carbon footprint.
The ability to customize partitions based on product type and packaging format enhances operational efficiency and visual branding The continued shift toward environmentally responsible packaging and the growing scale of the global food and beverage industry are expected to sustain the dominance of this segment in the coming years.
The below table presents the expected CAGR for the global paperboard partition market over several semi-annual periods spanning from 2025 to 2035.
| Particular | Value CAGR |
|---|---|
| H1 | 3.0% (2025 to 2035) |
| H2 | 3.4% (2025 to 2035) |
| H1 | 2.8% (2025 to 2035) |
| H2 | 3.6% (2025 to 2035) |
In the first half (H1) of the decade from 2025 to 2035, the business is predicted to surge at a CAGR of 3.0%, followed by a slightly higher growth rate of 3.4% in the second half (H2) of the same decade.
Moving into the subsequent period, from H1 2025 to H2 2035, the CAGR is projected to decrease slightly to 2.8% in the first half and remain relatively moderate at 3.6% in the second half. In the first half (H1) the market witnessed a decrease of 20 BPS while in the second half (H2), the market witnessed an increase of 20 BPS.
Alcoholic Beverage Industry Growth Spurs Demand for Protective Paperboard Partitions
Paperboard partitions are extensively used in the packaging of food & beverages, chemicals, consumer goods and pharmaceuticals. The beverage packaging industry holds major applications for the paperboard partitions market.
Paperboard partitions are used for packaging various beverages, especially alcoholic beverages made of glass such as wines, beers and spirits that require extra care during shipping and transit. Packaging partitions are used to package two or more wine or spirits bottles together so that the bottles do not collide with each other during transportation and handling making them less prone to breakage.
High consumption of alcoholic beverages in both developed and emerging economies in the Asia Pacific region is expected to fuel the demand for paperboard partitions. As per the study from the Indian Brand Equity Foundation, the alcoholic beverage industry in India experienced a 20% year-on-year growth with a valuation of USD 1.3 million in 2025.
The high consumption of alcoholic beverages, especially in the emerging economies in the Asia Pacific region is one of the prominent factors that are driving the paperboard partitions market.
Growing Preference for Sustainable and Ecofriendly Packaging to Drive the Market
With rising concerns regarding the waste generated by packaging solutions and its impact on the ecosystem, the need for recyclable packaging products is on the rise. Various government organizations have banned the use of non-recyclable materials like plastic and created awareness for the use of paper and paperboard because of their minimal impact on the environment.
Due to the rising awareness of sustainable packaging products, consumers and companies have shifted from paperboard partitions to plastic partitions. By using such packaging materials, manufacturers engaged in the making of paperboard partitions are focusing to reduce the dependency on finite resources and also reduce the amount of pollution created by traditional packaging materials.
Paper as a packaging material has the highest recycling rate in comparison to other packaging materials, as stated by the European Commission. Many food and beverage, automotive spare parts and electronic goods companies are using paperboard packaging materials as their contribution and highlight their commitments towards sustainable development, which leads to attention seeking from environment-conscious consumers.
Due to the primary focus on sustainable packaging practices in terms of its production and disposal and to minimize the use of material the demand for eco-friendly packaging products like paperboard partition is experiencing burgeoning demand.
Product Visibility Hurdles May Hinder Paperboard Partition Market Growth.
Intending to have a competitive edge over their competitors, the end-use manufacturers are inclining towards visually communicative packaging. Although the usage of paperboard partition enables the packaging of multiple products in one box or carton, it doesn’t offer visibility of the products which affects the branding and advertising of those products.
As maintaining a good brand reputation gets tougher due to ever-increasing competition in the market, manufacturers and brands prefer packaging solutions that offer brand-building and product differentiation across the supply chain. The paperboard partition market may therefore face challenges due to the development and growing trend of using packaging solutions that enable product protection, at the same not compromising on product visibility.
The global paperboard partition market recorded a CAGR of 2.3% during the historical period between 2020 and 2025. Market growth of paperboard partition was positive as it reached a value of USD 1,238.3 million in 2025 from USD 1,131.2 million in 2020.
The paperboard partition market is experiencing growth due to its increased usage for food and beverage, medical, cosmetics and personal care, electronic goods and automotive industries because of their characteristic features to safeguard the products from any type of damage at the time of storage, warehousing, domestic and international transport.
Paperboard partitions are used in packaging to create compartments or divisions within boxes or containers. They are made from bleached or unbleached paper and available in different product types such as brown kraft paperboard partition and white kraft paperboard partition, each of them having peculiarities and applications in the above-mentioned end-use industries.
The partitions are known for packaging multiple product configurations in one single box, for space optimization, protecting and organizing products during transit, and preventing damage from collisions or shifting.
Paperboard partition improves the visual presentation of products by creating a neat and orderly appearance, which is crucial for enhancing brand perception and customer experience.
These beneficial characteristics encourage paperboard partition manufacturers to innovate among the materials used for making paperboard portions with improved strength and minimal impact on the environment. The rise in demand for safe packaging options from several end users is expected to create opportunities for the market.
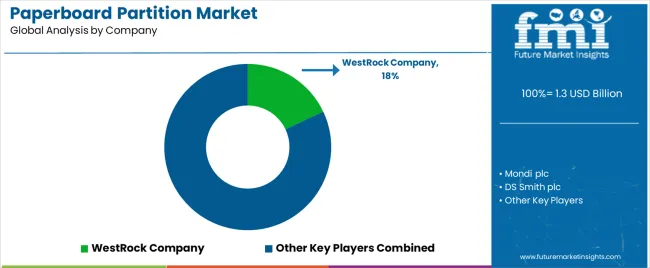
Tier 1 companies comprise market leaders with a market revenue of above USD 40 million capturing significant market share of 15% to 20% in global market. These market leaders are characterized by high production capacity and a wide product portfolio. These market leaders are distinguished by their extensive expertise in manufacturing across multiple packaging formats and a broad geographical reach, underpinned by a robust consumer base.
They provide a wide range of series including recycling and manufacturing utilizing the latest technology and meeting the regulatory standards providing the highest quality. Prominent companies within tier 1 include Mondi plc, DS Smith plc, International Paper, WestRock Company, Stora Enso Oyj, Nippon Paper Industries Co., Ltd, Smurfit Kappa Group plc and NEFAB GROUP.
Tier 2 companies include mid-size players with revenue of USD 10 to 40 million having presence in specific regions and highly influencing the local market. These are characterized by a strong presence overseas and strong market knowledge. These market players have good technology and ensure regulatory compliance but may not have advanced technology and wide global reach.
Prominent companies in tier 2 include RTS Packaging, LLC., M & M Box Partitions Co., Mil-Spec Packaging of GA, Inc., Innerpak Of Wisconsin, Inc., Multicell Packaging Inc., Micor Packaging Pty Ltd and Cactus Corrugated Containers Inc.
Tier 3 includes the majority of small-scale companies operating at the local presence and serving niche markets having revenue below USD 10 million. These companies are notably oriented towards fulfilling local market demands and are consequently classified within the tier 3 share segment.
They are small-scale players and have limited geographical reach. Tier 3, within this context, is recognized as an unorganized market, denoting a sector characterized by a lack of extensive structure and formalization when compared to organized competitors.
The section below covers the future forecast for the paperboard partition market in terms of countries. Information on key countries in several parts of the globe, including North America, Latin America, East Asia, South Asia and Pacific, Western Europe, Eastern Europe and MEA is provided. USA is anticipated to remain at the forefront in North America, with a CAGR of 1.6% through 2035. In South Asia and Pacific, India is projected to witness a CAGR of 5.5% by 2035.
| Countries | Value CAGR (2025 to 2035) |
|---|---|
| USA | 1.6% |
| Germany | 1.4% |
| China | 4.7% |
| UK | 1.7% |
| Spain | 2.9% |
| India | 1.8% |
| Canada | 1.6% |
The paperboard partition market in the USA is projected to grow at a CAGR of 1.6% compared to other countries in the North American region by 2035.
Paperboard partitions are used widely for the packaging of multiple glass bottles containing wine and other alcoholic beverages like beers, spirits, etc. According to WineAmerica, USA accounts for 12% of the world’s wine production with more than 10,000 wineries producing 900,000,000 gallons of wine every year. These partitions are used for packing multiple wine bottles such as 12, 20 and 25 into boxes and cartons to optimize packaging efficiency.
Instead of single packaging, these partitions offer gathered packaging which is efficient in transporting the glass wine bottles to various locations from production unit to warehouse, distributors and domestic and international export. Paperboard partitions possess the essential strength and sturdiness for securely organizing and protecting wine bottles during transportation and storage.
They ensure breakage due to collision and chances of spoiling from external factors such as high temperature and other factors. Thus, the growth of wine production in the USA will augment the demand for paperboard partition in the assessment period.
The paperboard partition market in UK offers a lot of opportunities amid expansion and growing retail sales in cosmetics & personal care industry. The country is anticipated to record a CAGR of 1.7% during the evaluation period.
The rising cultural influence for personal care products in the UK is spurring the demand for various cosmetics and personal care products through the retail sales channel. As per the survey from, CTPA (the Cosmetic, Toiletry and Perfumery Association), the UK exhibited 5.4% growth in the personal care products industry generating £1.3 billion in 2025.
Protective packaging solutions are required for the transport of lotions, creams, shampoos, perfumes and many other personal care products from the production sites to warehouses and retail stores. The ability of paperboard partitions to store numerous products into a single large box or container offers retailers with improved space efficiency during its storage, which leads to abundant availability of stock and fulfilling the ever-increasing demand of the customers.
These partitions are used for brand marketing strategies such as combo packaging of products such as perfumes, shower gels, lotions, etc. in packs of threes, packs of five, etc. with discounts that convince the consumers to purchase the products.
Another benefit provided by paperboard partitions is that, due to their less occupancy and more product storage, it also reduces the transportation activities consequently reducing the use of fuel and minimizing environmental impact. Due to these factors, the growing retail sales of personal care and cosmetic products the paperboard partition is gaining impetus demand.
The section contains information about the leading segments in the industry. In terms of product, brown kraft is estimated to account for a share of 67.8% by 2035. By end use, the food and beverage segment is projected to dominate by holding a share of 29.3% by the end 2035.
| Product | Brown Kraft |
|---|---|
| Value CAGR (2035) | 2.9% |
Of the two products, brown kraft is expected to lead the paperboard partition market during the forecast period. Brown kraft is anticipated to rise at a CAGR of 2.9%, and hold for 67.8% of the total market share till the end of 2035.
Brown kraft paper is generally made from natural unbleached wood pulp. As these materials are environmentally friendly and recyclable, brown kraft paper significantly contributes towards environmental sustainability. This is one of the key reasons for its high preference over other products from end-use industries like food and beverage, pharmaceuticals, personal care and electronics.
Additionally, brown kraft paper is relatively inexpensive, becoming an affordable packaging solution for companies looking to minimize packaging costs. The natural fibers in the brown kraft paperboard provide a certain level of resistance towards moisture and grease which offers additional protection to the products.
Although it is made from natural sources it possesses the required strength and durability for providing the necessary protection during storage and transport, especially for commercial and industrial applications. Due to these benefits, brown kraft paperboard partitions are expected to experience huge demand in the upcoming years.
| End Use | Food and Beverage |
|---|---|
| Value CAGR (2035) | 3.4% |
The food and beverage industry among other end users like pharmaceuticals, automotive, electronic goods, personal care products is estimated to lead the paperboard partition market with a CAGR of 3.4% till 2035.
Paperboard partitions are used widely in the food and beverage industry for packaging numerous products including glass bottles containing beers, wines, carbonated drinks, spirits, etc. and jars of jams, pickles, and sauces to prevent breakage during transportation and storage, bakery products like cupcakes, pastries, and macaron to maintain their shape and prevent it from being crushed.
Paperboard partitions provide better organization and stacking of products within a package ensuring safe and hygienic packaging by maintaining food hygiene standards optimizing space usage and improving the efficiency of storage and shipping.
Their barrier and thermal insulations protect the food from contaminants and temperature-sensitive food items from external temperature variations during transportation. These ideal properties for protective food and beverage packaging solutions are propelling the paperboard partition market.
Key players of paperboard partition industry are developing and launching new products in the market. They are integrating with different firms and extending their geographical presence. Few of them are also collaborating and partnering with local brands and start-up companies for new product development.
Key Developments in Paperboard Partition Market
A few of the grades in the paperboard partition market include bleached and unbleached.
In terms of product, the paperboard partition market is divided into brown kraft and white kraft.
Some of end users related to paperboard partition market include food and beverage, personal care, electronic goods, automotive, pharmaceuticals and other industrial.
Key countries of North America, Latin America, East Asia, South Asia and Pacific, Western Europe, Eastern Europe, Middle East and Africa are covered.
The global paperboard partition market is estimated to be valued at USD 1.3 billion in 2025.
The market size for the paperboard partition market is projected to reach USD 1.8 billion by 2035.
The paperboard partition market is expected to grow at a 3.2% CAGR between 2025 and 2035.
The key product types in paperboard partition market are bleached and unbleached.
In terms of product, white kraft segment to command 58.5% share in the paperboard partition market in 2025.


Our Research Products

The "Full Research Suite" delivers actionable market intel, deep dives on markets or technologies, so clients act faster, cut risk, and unlock growth.

The Leaderboard benchmarks and ranks top vendors, classifying them as Established Leaders, Leading Challengers, or Disruptors & Challengers.

Locates where complements amplify value and substitutes erode it, forecasting net impact by horizon

We deliver granular, decision-grade intel: market sizing, 5-year forecasts, pricing, adoption, usage, revenue, and operational KPIs—plus competitor tracking, regulation, and value chains—across 60 countries broadly.

Spot the shifts before they hit your P&L. We track inflection points, adoption curves, pricing moves, and ecosystem plays to show where demand is heading, why it is changing, and what to do next across high-growth markets and disruptive tech

Real-time reads of user behavior. We track shifting priorities, perceptions of today’s and next-gen services, and provider experience, then pace how fast tech moves from trial to adoption, blending buyer, consumer, and channel inputs with social signals (#WhySwitch, #UX).

Partner with our analyst team to build a custom report designed around your business priorities. From analysing market trends to assessing competitors or crafting bespoke datasets, we tailor insights to your needs.
Supplier Intelligence
Discovery & Profiling
Capacity & Footprint
Performance & Risk
Compliance & Governance
Commercial Readiness
Who Supplies Whom
Scorecards & Shortlists
Playbooks & Docs
Category Intelligence
Definition & Scope
Demand & Use Cases
Cost Drivers
Market Structure
Supply Chain Map
Trade & Policy
Operating Norms
Deliverables
Buyer Intelligence
Account Basics
Spend & Scope
Procurement Model
Vendor Requirements
Terms & Policies
Entry Strategy
Pain Points & Triggers
Outputs
Pricing Analysis
Benchmarks
Trends
Should-Cost
Indexation
Landed Cost
Commercial Terms
Deliverables
Brand Analysis
Positioning & Value Prop
Share & Presence
Customer Evidence
Go-to-Market
Digital & Reputation
Compliance & Trust
KPIs & Gaps
Outputs
Full Research Suite comprises of:
Market outlook & trends analysis
Interviews & case studies
Strategic recommendations
Vendor profiles & capabilities analysis
5-year forecasts
8 regions and 60+ country-level data splits
Market segment data splits
12 months of continuous data updates
DELIVERED AS:
PDF EXCEL ONLINE
Paperboard Packaging Market Size and Share Forecast Outlook 2025 to 2035
Paperboard Mailer Market Growth - Demand & Forecast 2025 to 2035
Paperboard Tray Market Growth - Trends & Forecast 2025 to 2035
Paperboard Jar Market Analysis – Size, Demand & Forecast 2024-2034
Paperboard Jewellery Box Market Growth & Trends Forecast 2024-2034
Paperboard Clamshell Boxes Market
Paperboard Bowl Market
Partition inserter machines Market
Food Partition Trays Market
Paper Paperboard Wood Recycling Market Size and Share Forecast Outlook 2025 to 2035
Push-up Paperboard Tube Market Size and Share Forecast Outlook 2025 to 2035
Industry Share & Competitive Positioning in Push-up Paperboard Tube Market
Folding Paperboard Boxes Market
Paper and Paperboard Packaging Market Forecast and Outlook 2025 to 2035
Poly Coated Paperboard Market
Coated Recycled Paperboard Market Size and Share Forecast Outlook 2025 to 2035
Competitive Landscape of Coated Recycled Paperboard Providers
Unbleached Kraft Paperboard Market Analysis by Product type, Coating type, and End Use through 2025 to 2035
Aseptic Packaging Paperboard Market Size and Share Forecast Outlook 2025 to 2035

Thank you!
You will receive an email from our Business Development Manager. Please be sure to check your SPAM/JUNK folder too.
Chat With
MaRIA