Sealing and Strapping Packaging Tape Market Size and Share Forecast Outlook From 2024 to 2034

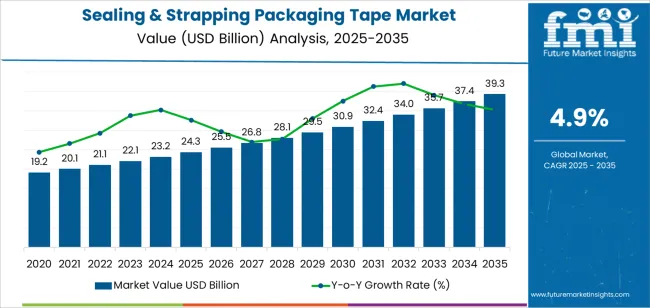
The sealing and strapping packaging tape market is expected to be valued at USD 23.2 billion in 2024. The demand for sealing and strapping packaging tape is expected to rise at a CAGR of 4.9% from 2024 to 2034. By the end of the forecast period, the industry value is expected to reach USD 37.6 billion.

Sealing and Strapping Packaging Tape Market Report

  • The demand for sealing and strapping packaging tapes is rising due to their cost-effectiveness for various applications.
  • End-users for the packaging tapes are plenty, with the product finding application in common household tasks as well as in large industrial undertakings.
  • As the packaging industry expands, the need for packaging materials is increasing, and the demand for sealing and strapping packaging tapes is getting bolstered.
  • Sealing and strapping packaging tapes are flexible packaging solutions, and as the industrial need for flexible packaging rises, the market stands to benefit.
  • With the desire for fast turnaround times in industries, efficient packaging solutions are highly considered by customers. The easy and simple-to-use nature of sealing and strapping packaging tapes is thus endearing the product to industrialists.
Attributes Details
Sealing and Strapping Packaging Tape Market Value, 2024 USD 23.2 billion
Projected Market Value, 2034 USD 37.6 billion
Value-based CAGR, 2024 to 2034 4.9%

Top Trends Shaping the Sealing and Strapping Packaging Tape Market

  • Sealing and strapping tapes are being increasingly adopted in industries for the security and protection of the material inside from humidity.
  • The increasing interchange of goods between developed and developing countries is leading to a rise in demand for flexible but tough packaging materials like sealing and strapping packaging tapes.
  • E-commerce has given a boost to sales of consumer products that have expensive packaging needs, needs that are being met by sealing and strapping packing tapes.
  • Digital printing on tapes is providing the makers of goods an opportunity to further advertise, and thus, industrialists are adopting tapes into their packaging material.
  • In line with the rising popularity of recyclable material, sealing and strapping tapes are being made from recyclable material, making the product popular among both industrialists and consumers.
  • Sealing and strapping packaging tapes are made from materials like polypropylene and polyvinyl chloride, which often have volatile prices that make the manufacturing effort strenuous.
  • Enterprises in the sealing and strapping packaging tape industry have to deal with the standards imposed by regulatory authorities, as industries with significant chemical use are being monitored heavily.

Sealing and Strapping Packaging Tape Industry Analysis by Top Investment Segments

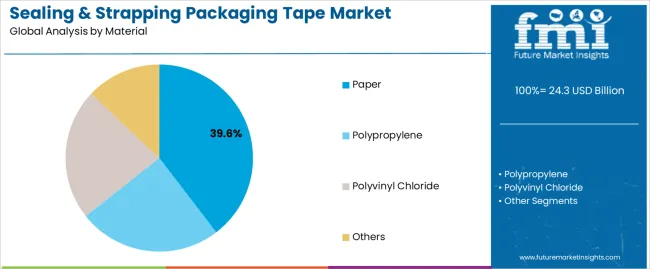
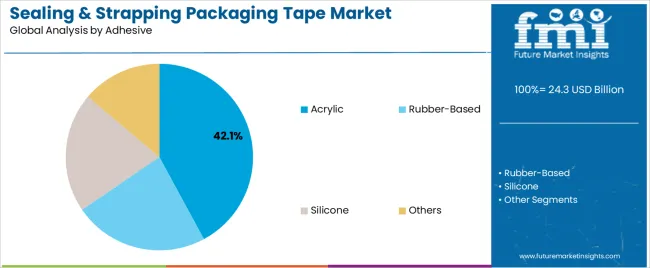
Paper is the most commonly used material in the making of sealing and strapping packing tapes. On the other hand, the adhesive most associated with sealing and strapping adhesive tapes is acrylic.

Paper’s Ability to be Effectively Meet Regulatory Standards

Attributes Details
Top Material Paper
CAGR (2024 to 2034) 4.6%

The paper segment is expected to progress at a CAGR of 4.6% over the forecast period. Factors driving the growth of the segment are:

  • The production of sealing and strapping packaging tapes is subject to severe regulatory pressure and paper is helping producers meet the standards, while still not skimping on quality.
  • While there has been a drive to incorporate sustainable and recyclable materials in the product, these materials are often expensive. The use of paper is a cost-friendly and sustainable option.

Acrylic is the Primary Adhesive Used in Sealing and Packaging Tapes

Attributes Details
Top Adhesive Acrylic
CAGR (2024 to 2034) 4.5%

Acrylic is predicted to register a CAGR of 4.5% over the forecast period. Some of the factors for the growth of the acrylic segment are:

  • Acrylic is renowned for its ability to withstand harsh conditions, offering abilities like UV resistance and chemical exposure. Thus, acrylic has earned the confidence of manufacturers.
  • Acrylic is long-lasting that provides security to the packaging by adding another layer.

Analysis of Top Countries, Manufacturing and Using Sealing and Strapping Packaging Tapes

The packaging sector is receiving encouragement from governments in the Asia Pacific region, which is propelling the market. The packaging sector’s advancement is part of the overall drive for industrial upgradation in the region.

The demand for sealing and strapping packaging tapes is surging in the healthcare sector in North America. Meanwhile in Europe, the ever-increasing number of factories is a boon for the market.

Countries CAGR (2024 to 2034)
United States 5.2%
United Kingdom 5.5%
China 5.7%
Japan 5.4%
South Korea 7.3%

Rise in Online Sales of Consumer Products Boosting the Market in South Korea

The market in South Korea is anticipated to register a CAGR of 7.3% over the forecast period. Some of the factors driving the promising growth of the market in the country are:

  • The South Korean population’s online presence is ever-increasing, and as part of it, e-commerce sales are rising. Rise in the sale of consumer products online is contributing to the demand for sealing and strapping packaging in the country.
  • South Korea’s burgeoning food and beverage industry is making extensive use of sealing and strapping packaging tapes as a way to seal the food inside more readily.

Sealing and Strapping Packaging Tapes Enhance Export Capabilities in Japan

The market in Japan is set to expand at a CAGR of 5.4% over the forecast period. Prominent factors driving the growth of the market are:

  • The export of domestically-made goods is a prominent business in Japan. The export of these goods, especially to Western countries, is aided by sealing and strapping packaging tapes, which help products to arrive at their destination securely.
  • Japan has a number of small-scale shops specializing in areas like handicrafts and figurines, and sealing and strapping packaging tapes are being used to package these modest products.

China’s Humungous Textile Sector Driving Market Demand

The market in China is expected to register a CAGR of 5.7% through 2034. Some of the factors driving the growth of the market in China are as follows:

  • China is reputed for its textile industry, which is considered to be the largest in the world. The textile industry in China thus represents a significant base for income generation for sealing and strapping packaging tape manufacturers.
  • The considerable population of China is witnessing an exponential rise in food packaging needs in the country, aiding the growth of the market.

Focus on Recycling in the United Kingdom

The market in the United Kingdom is set to progress at a CAGR of 5.5% through 2034. Factors influencing the growth of the market in the United Kingdom include:

  • The focus on recyclability in the United Kingdom is driving the demand for sealing and strapping packaging tapes made from recyclable materials.
  • Experimentation with the adhesives and size of the tapes is common in the United Kingdom, making sure the demand for the product is flexible and not rigid.

Use of Sealing and Strapping Packaging Tapes for Marketing Purposes in the United States

The market in the United States is expected to register a CAGR of 5.2% through 2034. Some of the reasons for the growth of sealing and strapping packaging tape sales are:
  • Vendors in the United States are taking advantage of the opportunity provided by tapes on the side of the packaged product for branding purposes.
  • The United States is a significant importer of goods and sealing and strapping tapes are used to make sure the goods arrive in the desired shape.

Key Players and Market Concentration in the Sealing and Strapping Packaging Tape Industry

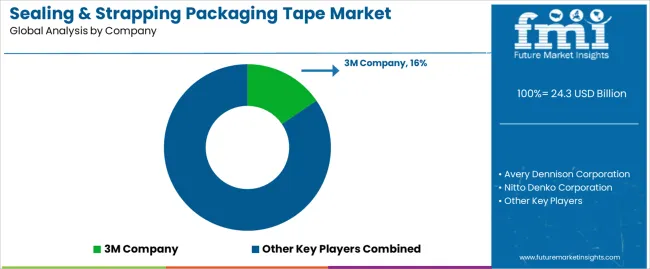
The market for sealing and strapping packaging tape is highly fragmented, with many small outfits dotting the landscape. The manufacture of these tapes is even being achieved by outfits being run from the homes of the properties.

The development of tougher materials and tapes that long last is a priority for market players. With the extensive use of tapes in the export and import of goods, there is scope for geographic expansion for market players.

Recent Developments in the Sealing and Strapping Packaging Tape Market

  • In November 2023, Ball and Doggett expanded its product line, with sealing and strapping tapes among them.
  • In September 2023, Intertape Polymer Group launched the 170e water-based acrylic pressure-sensitive carton sealing tape, made with recyclable material.
  • In June 2023, Tesa introduced a range of tapes, including sealing and strapping tapes, made with sustainability in mind and containing recyclable material.
  • In September 2019, 3M launched the Scothch High Tack Box Sealing Tape 375+, a sealing tape with a wide array of packaging applications.

Leading Suppliers in the Global Sealing and Strapping Packaging Tape Market

  • 3M Company
  • Avery Dennison Corporation
  • Nitto Denko Corporation
  • Tesa SE
  • Intertape Polymer Group

Key Shifting Preferences Covered in the Sealing and Strapping Packaging Tape Market Report

  • Current trends in the Sealing & Strapping Packaging Tapes Market
  • Sealing and Strapping Packaging Tape Production Analysis
  • Competitive Strategies Adopted by Sealing and Strapping Packaging Tape Manufacturers
  • Innovations in Sealing and Strapping Packaging Tape
  • Risk Mitigation and Management

Top Segments Studied in the Sealing and Strapping Packaging Tape Market

By Material:

  • Paper
  • Polypropylene
  • Polyvinyl Chloride
  • Others

By Adhesive:

  • Acrylic
  • Rubber-based
  • Silicone
  • Others

By Application:

  • Carton Sealing and Inner Packaging
  • Strapping and Bundling

By Region:

  • North America
  • Latin America
  • Europe
  • South Asia
  • East Asia
  • Oceania
  • Middle East and Africa (MEA)

Table of Content

  • 1. Executive Summary
  • 2. Market Overview
  • 3. Market Background
  • 4. Global Market Analysis 2019 to 2023 and Forecast, 2024 to 2034
  • 5. Global Market Analysis 2019 to 2023 and Forecast 2024 to 2034, By Material
    • 5.1. Paper
    • 5.2. Polypropylene
    • 5.3. Polyvinyl Chloride
    • 5.4. Others
  • 6. Global Market Analysis 2019 to 2023 and Forecast 2024 to 2034, By Adhesive
    • 6.1. Acrylic
    • 6.2. Rubber-based
    • 6.3. Silicone
    • 6.4. Others
  • 7. Global Market Analysis 2019 to 2023 and Forecast 2024 to 2034, By Application
    • 7.1. Carton Sealing & Inner Packaging
    • 7.2. Strapping & Bundling
  • 8. Global Market Analysis 2019 to 2023 and Forecast 2024 to 2034, By Region
    • 8.1. North America
    • 8.2. Latin America
    • 8.3. Western Europe
    • 8.4. Eastern Europe
    • 8.5. South Asia and Pacific
    • 8.6. East Asia
    • 8.7. Middle East and Africa
  • 9. North America Market Analysis 2019 to 2023 and Forecast 2024 to 2034, By Country
  • 10. Latin America Market Analysis 2019 to 2023 and Forecast 2024 to 2034, By Country
  • 11. Western Europe Market Analysis 2019 to 2023 and Forecast 2024 to 2034, By Country
  • 12. Eastern Europe Market Analysis 2019 to 2023 and Forecast 2024 to 2034, By Country
  • 13. South Asia and Pacific Market Analysis 2019 to 2023 and Forecast 2024 to 2034, By Country
  • 14. East Asia Market Analysis 2019 to 2023 and Forecast 2024 to 2034, By Country
  • 15. Middle East and Africa Market Analysis 2019 to 2023 and Forecast 2024 to 2034, By Country
  • 16. Key Countries Market Analysis
  • 17. Market Structure Analysis
  • 18. Competition Analysis
    • 18.1. 3M Company
    • 18.2. Avery Dennison Corporation
    • 18.3. Nitto Denko Corporation
    • 18.4. Tesa SE
    • 18.5. Intertape Polymer Group
    • 18.6. Scapa Group plc
    • 18.7. Wuhan HuaxiaNanfeng Adhesive Tapes
    • 18.8. Shrutapes
    • 18.9. Mactac
    • 18.10. Nichiban
  • 19. Assumptions & Acronyms Used
  • 20. Research Methodology

List of Tables

Table 1: Global Market Value (US$ Million) Forecast by Region, 2019 to 2034

Table 2: Global Market Volume (Units) Forecast by Region, 2019 to 2034

Table 3: Global Market Value (US$ Million) Forecast by Material, 2019 to 2034

Table 4: Global Market Volume (Units) Forecast by Material, 2019 to 2034

Table 5: Global Market Value (US$ Million) Forecast by Adhesive, 2019 to 2034

Table 6: Global Market Volume (Units) Forecast by Adhesive, 2019 to 2034

Table 7: Global Market Value (US$ Million) Forecast by Application, 2019 to 2034

Table 8: Global Market Volume (Units) Forecast by Application, 2019 to 2034

Table 9: North America Market Value (US$ Million) Forecast by Country, 2019 to 2034

Table 10: North America Market Volume (Units) Forecast by Country, 2019 to 2034

Table 11: North America Market Value (US$ Million) Forecast by Material, 2019 to 2034

Table 12: North America Market Volume (Units) Forecast by Material, 2019 to 2034

Table 13: North America Market Value (US$ Million) Forecast by Adhesive, 2019 to 2034

Table 14: North America Market Volume (Units) Forecast by Adhesive, 2019 to 2034

Table 15: North America Market Value (US$ Million) Forecast by Application, 2019 to 2034

Table 16: North America Market Volume (Units) Forecast by Application, 2019 to 2034

Table 17: Latin America Market Value (US$ Million) Forecast by Country, 2019 to 2034

Table 18: Latin America Market Volume (Units) Forecast by Country, 2019 to 2034

Table 19: Latin America Market Value (US$ Million) Forecast by Material, 2019 to 2034

Table 20: Latin America Market Volume (Units) Forecast by Material, 2019 to 2034

Table 21: Latin America Market Value (US$ Million) Forecast by Adhesive, 2019 to 2034

Table 22: Latin America Market Volume (Units) Forecast by Adhesive, 2019 to 2034

Table 23: Latin America Market Value (US$ Million) Forecast by Application, 2019 to 2034

Table 24: Latin America Market Volume (Units) Forecast by Application, 2019 to 2034

Table 25: Western Europe Market Value (US$ Million) Forecast by Country, 2019 to 2034

Table 26: Western Europe Market Volume (Units) Forecast by Country, 2019 to 2034

Table 27: Western Europe Market Value (US$ Million) Forecast by Material, 2019 to 2034

Table 28: Western Europe Market Volume (Units) Forecast by Material, 2019 to 2034

Table 29: Western Europe Market Value (US$ Million) Forecast by Adhesive, 2019 to 2034

Table 30: Western Europe Market Volume (Units) Forecast by Adhesive, 2019 to 2034

Table 31: Western Europe Market Value (US$ Million) Forecast by Application, 2019 to 2034

Table 32: Western Europe Market Volume (Units) Forecast by Application, 2019 to 2034

Table 33: Eastern Europe Market Value (US$ Million) Forecast by Country, 2019 to 2034

Table 34: Eastern Europe Market Volume (Units) Forecast by Country, 2019 to 2034

Table 35: Eastern Europe Market Value (US$ Million) Forecast by Material, 2019 to 2034

Table 36: Eastern Europe Market Volume (Units) Forecast by Material, 2019 to 2034

Table 37: Eastern Europe Market Value (US$ Million) Forecast by Adhesive, 2019 to 2034

Table 38: Eastern Europe Market Volume (Units) Forecast by Adhesive, 2019 to 2034

Table 39: Eastern Europe Market Value (US$ Million) Forecast by Application, 2019 to 2034

Table 40: Eastern Europe Market Volume (Units) Forecast by Application, 2019 to 2034

Table 41: South Asia and Pacific Market Value (US$ Million) Forecast by Country, 2019 to 2034

Table 42: South Asia and Pacific Market Volume (Units) Forecast by Country, 2019 to 2034

Table 43: South Asia and Pacific Market Value (US$ Million) Forecast by Material, 2019 to 2034

Table 44: South Asia and Pacific Market Volume (Units) Forecast by Material, 2019 to 2034

Table 45: South Asia and Pacific Market Value (US$ Million) Forecast by Adhesive, 2019 to 2034

Table 46: South Asia and Pacific Market Volume (Units) Forecast by Adhesive, 2019 to 2034

Table 47: South Asia and Pacific Market Value (US$ Million) Forecast by Application, 2019 to 2034

Table 48: South Asia and Pacific Market Volume (Units) Forecast by Application, 2019 to 2034

Table 49: East Asia Market Value (US$ Million) Forecast by Country, 2019 to 2034

Table 50: East Asia Market Volume (Units) Forecast by Country, 2019 to 2034

Table 51: East Asia Market Value (US$ Million) Forecast by Material, 2019 to 2034

Table 52: East Asia Market Volume (Units) Forecast by Material, 2019 to 2034

Table 53: East Asia Market Value (US$ Million) Forecast by Adhesive, 2019 to 2034

Table 54: East Asia Market Volume (Units) Forecast by Adhesive, 2019 to 2034

Table 55: East Asia Market Value (US$ Million) Forecast by Application, 2019 to 2034

Table 56: East Asia Market Volume (Units) Forecast by Application, 2019 to 2034

Table 57: Middle East and Africa Market Value (US$ Million) Forecast by Country, 2019 to 2034

Table 58: Middle East and Africa Market Volume (Units) Forecast by Country, 2019 to 2034

Table 59: Middle East and Africa Market Value (US$ Million) Forecast by Material, 2019 to 2034

Table 60: Middle East and Africa Market Volume (Units) Forecast by Material, 2019 to 2034

Table 61: Middle East and Africa Market Value (US$ Million) Forecast by Adhesive, 2019 to 2034

Table 62: Middle East and Africa Market Volume (Units) Forecast by Adhesive, 2019 to 2034

Table 63: Middle East and Africa Market Value (US$ Million) Forecast by Application, 2019 to 2034

Table 64: Middle East and Africa Market Volume (Units) Forecast by Application, 2019 to 2034

List of Figures

Figure 1: Global Market Value (US$ Million) by Material, 2024 to 2034

Figure 2: Global Market Value (US$ Million) by Adhesive, 2024 to 2034

Figure 3: Global Market Value (US$ Million) by Application, 2024 to 2034

Figure 4: Global Market Value (US$ Million) by Region, 2024 to 2034

Figure 5: Global Market Value (US$ Million) Analysis by Region, 2019 to 2034

Figure 6: Global Market Volume (Units) Analysis by Region, 2019 to 2034

Figure 7: Global Market Value Share (%) and BPS Analysis by Region, 2024 to 2034

Figure 8: Global Market Y-o-Y Growth (%) Projections by Region, 2024 to 2034

Figure 9: Global Market Value (US$ Million) Analysis by Material, 2019 to 2034

Figure 10: Global Market Volume (Units) Analysis by Material, 2019 to 2034

Figure 11: Global Market Value Share (%) and BPS Analysis by Material, 2024 to 2034

Figure 12: Global Market Y-o-Y Growth (%) Projections by Material, 2024 to 2034

Figure 13: Global Market Value (US$ Million) Analysis by Adhesive, 2019 to 2034

Figure 14: Global Market Volume (Units) Analysis by Adhesive, 2019 to 2034

Figure 15: Global Market Value Share (%) and BPS Analysis by Adhesive, 2024 to 2034

Figure 16: Global Market Y-o-Y Growth (%) Projections by Adhesive, 2024 to 2034

Figure 17: Global Market Value (US$ Million) Analysis by Application, 2019 to 2034

Figure 18: Global Market Volume (Units) Analysis by Application, 2019 to 2034

Figure 19: Global Market Value Share (%) and BPS Analysis by Application, 2024 to 2034

Figure 20: Global Market Y-o-Y Growth (%) Projections by Application, 2024 to 2034

Figure 21: Global Market Attractiveness by Material, 2024 to 2034

Figure 22: Global Market Attractiveness by Adhesive, 2024 to 2034

Figure 23: Global Market Attractiveness by Application, 2024 to 2034

Figure 24: Global Market Attractiveness by Region, 2024 to 2034

Figure 25: North America Market Value (US$ Million) by Material, 2024 to 2034

Figure 26: North America Market Value (US$ Million) by Adhesive, 2024 to 2034

Figure 27: North America Market Value (US$ Million) by Application, 2024 to 2034

Figure 28: North America Market Value (US$ Million) by Country, 2024 to 2034

Figure 29: North America Market Value (US$ Million) Analysis by Country, 2019 to 2034

Figure 30: North America Market Volume (Units) Analysis by Country, 2019 to 2034

Figure 31: North America Market Value Share (%) and BPS Analysis by Country, 2024 to 2034

Figure 32: North America Market Y-o-Y Growth (%) Projections by Country, 2024 to 2034

Figure 33: North America Market Value (US$ Million) Analysis by Material, 2019 to 2034

Figure 34: North America Market Volume (Units) Analysis by Material, 2019 to 2034

Figure 35: North America Market Value Share (%) and BPS Analysis by Material, 2024 to 2034

Figure 36: North America Market Y-o-Y Growth (%) Projections by Material, 2024 to 2034

Figure 37: North America Market Value (US$ Million) Analysis by Adhesive, 2019 to 2034

Figure 38: North America Market Volume (Units) Analysis by Adhesive, 2019 to 2034

Figure 39: North America Market Value Share (%) and BPS Analysis by Adhesive, 2024 to 2034

Figure 40: North America Market Y-o-Y Growth (%) Projections by Adhesive, 2024 to 2034

Figure 41: North America Market Value (US$ Million) Analysis by Application, 2019 to 2034

Figure 42: North America Market Volume (Units) Analysis by Application, 2019 to 2034

Figure 43: North America Market Value Share (%) and BPS Analysis by Application, 2024 to 2034

Figure 44: North America Market Y-o-Y Growth (%) Projections by Application, 2024 to 2034

Figure 45: North America Market Attractiveness by Material, 2024 to 2034

Figure 46: North America Market Attractiveness by Adhesive, 2024 to 2034

Figure 47: North America Market Attractiveness by Application, 2024 to 2034

Figure 48: North America Market Attractiveness by Country, 2024 to 2034

Figure 49: Latin America Market Value (US$ Million) by Material, 2024 to 2034

Figure 50: Latin America Market Value (US$ Million) by Adhesive, 2024 to 2034

Figure 51: Latin America Market Value (US$ Million) by Application, 2024 to 2034

Figure 52: Latin America Market Value (US$ Million) by Country, 2024 to 2034

Figure 53: Latin America Market Value (US$ Million) Analysis by Country, 2019 to 2034

Figure 54: Latin America Market Volume (Units) Analysis by Country, 2019 to 2034

Figure 55: Latin America Market Value Share (%) and BPS Analysis by Country, 2024 to 2034

Figure 56: Latin America Market Y-o-Y Growth (%) Projections by Country, 2024 to 2034

Figure 57: Latin America Market Value (US$ Million) Analysis by Material, 2019 to 2034

Figure 58: Latin America Market Volume (Units) Analysis by Material, 2019 to 2034

Figure 59: Latin America Market Value Share (%) and BPS Analysis by Material, 2024 to 2034

Figure 60: Latin America Market Y-o-Y Growth (%) Projections by Material, 2024 to 2034

Figure 61: Latin America Market Value (US$ Million) Analysis by Adhesive, 2019 to 2034

Figure 62: Latin America Market Volume (Units) Analysis by Adhesive, 2019 to 2034

Figure 63: Latin America Market Value Share (%) and BPS Analysis by Adhesive, 2024 to 2034

Figure 64: Latin America Market Y-o-Y Growth (%) Projections by Adhesive, 2024 to 2034

Figure 65: Latin America Market Value (US$ Million) Analysis by Application, 2019 to 2034

Figure 66: Latin America Market Volume (Units) Analysis by Application, 2019 to 2034

Figure 67: Latin America Market Value Share (%) and BPS Analysis by Application, 2024 to 2034

Figure 68: Latin America Market Y-o-Y Growth (%) Projections by Application, 2024 to 2034

Figure 69: Latin America Market Attractiveness by Material, 2024 to 2034

Figure 70: Latin America Market Attractiveness by Adhesive, 2024 to 2034

Figure 71: Latin America Market Attractiveness by Application, 2024 to 2034

Figure 72: Latin America Market Attractiveness by Country, 2024 to 2034

Figure 73: Western Europe Market Value (US$ Million) by Material, 2024 to 2034

Figure 74: Western Europe Market Value (US$ Million) by Adhesive, 2024 to 2034

Figure 75: Western Europe Market Value (US$ Million) by Application, 2024 to 2034

Figure 76: Western Europe Market Value (US$ Million) by Country, 2024 to 2034

Figure 77: Western Europe Market Value (US$ Million) Analysis by Country, 2019 to 2034

Figure 78: Western Europe Market Volume (Units) Analysis by Country, 2019 to 2034

Figure 79: Western Europe Market Value Share (%) and BPS Analysis by Country, 2024 to 2034

Figure 80: Western Europe Market Y-o-Y Growth (%) Projections by Country, 2024 to 2034

Figure 81: Western Europe Market Value (US$ Million) Analysis by Material, 2019 to 2034

Figure 82: Western Europe Market Volume (Units) Analysis by Material, 2019 to 2034

Figure 83: Western Europe Market Value Share (%) and BPS Analysis by Material, 2024 to 2034

Figure 84: Western Europe Market Y-o-Y Growth (%) Projections by Material, 2024 to 2034

Figure 85: Western Europe Market Value (US$ Million) Analysis by Adhesive, 2019 to 2034

Figure 86: Western Europe Market Volume (Units) Analysis by Adhesive, 2019 to 2034

Figure 87: Western Europe Market Value Share (%) and BPS Analysis by Adhesive, 2024 to 2034

Figure 88: Western Europe Market Y-o-Y Growth (%) Projections by Adhesive, 2024 to 2034

Figure 89: Western Europe Market Value (US$ Million) Analysis by Application, 2019 to 2034

Figure 90: Western Europe Market Volume (Units) Analysis by Application, 2019 to 2034

Figure 91: Western Europe Market Value Share (%) and BPS Analysis by Application, 2024 to 2034

Figure 92: Western Europe Market Y-o-Y Growth (%) Projections by Application, 2024 to 2034

Figure 93: Western Europe Market Attractiveness by Material, 2024 to 2034

Figure 94: Western Europe Market Attractiveness by Adhesive, 2024 to 2034

Figure 95: Western Europe Market Attractiveness by Application, 2024 to 2034

Figure 96: Western Europe Market Attractiveness by Country, 2024 to 2034

Figure 97: Eastern Europe Market Value (US$ Million) by Material, 2024 to 2034

Figure 98: Eastern Europe Market Value (US$ Million) by Adhesive, 2024 to 2034

Figure 99: Eastern Europe Market Value (US$ Million) by Application, 2024 to 2034

Figure 100: Eastern Europe Market Value (US$ Million) by Country, 2024 to 2034

Figure 101: Eastern Europe Market Value (US$ Million) Analysis by Country, 2019 to 2034

Figure 102: Eastern Europe Market Volume (Units) Analysis by Country, 2019 to 2034

Figure 103: Eastern Europe Market Value Share (%) and BPS Analysis by Country, 2024 to 2034

Figure 104: Eastern Europe Market Y-o-Y Growth (%) Projections by Country, 2024 to 2034

Figure 105: Eastern Europe Market Value (US$ Million) Analysis by Material, 2019 to 2034

Figure 106: Eastern Europe Market Volume (Units) Analysis by Material, 2019 to 2034

Figure 107: Eastern Europe Market Value Share (%) and BPS Analysis by Material, 2024 to 2034

Figure 108: Eastern Europe Market Y-o-Y Growth (%) Projections by Material, 2024 to 2034

Figure 109: Eastern Europe Market Value (US$ Million) Analysis by Adhesive, 2019 to 2034

Figure 110: Eastern Europe Market Volume (Units) Analysis by Adhesive, 2019 to 2034

Figure 111: Eastern Europe Market Value Share (%) and BPS Analysis by Adhesive, 2024 to 2034

Figure 112: Eastern Europe Market Y-o-Y Growth (%) Projections by Adhesive, 2024 to 2034

Figure 113: Eastern Europe Market Value (US$ Million) Analysis by Application, 2019 to 2034

Figure 114: Eastern Europe Market Volume (Units) Analysis by Application, 2019 to 2034

Figure 115: Eastern Europe Market Value Share (%) and BPS Analysis by Application, 2024 to 2034

Figure 116: Eastern Europe Market Y-o-Y Growth (%) Projections by Application, 2024 to 2034

Figure 117: Eastern Europe Market Attractiveness by Material, 2024 to 2034

Figure 118: Eastern Europe Market Attractiveness by Adhesive, 2024 to 2034

Figure 119: Eastern Europe Market Attractiveness by Application, 2024 to 2034

Figure 120: Eastern Europe Market Attractiveness by Country, 2024 to 2034

Figure 121: South Asia and Pacific Market Value (US$ Million) by Material, 2024 to 2034

Figure 122: South Asia and Pacific Market Value (US$ Million) by Adhesive, 2024 to 2034

Figure 123: South Asia and Pacific Market Value (US$ Million) by Application, 2024 to 2034

Figure 124: South Asia and Pacific Market Value (US$ Million) by Country, 2024 to 2034

Figure 125: South Asia and Pacific Market Value (US$ Million) Analysis by Country, 2019 to 2034

Figure 126: South Asia and Pacific Market Volume (Units) Analysis by Country, 2019 to 2034

Figure 127: South Asia and Pacific Market Value Share (%) and BPS Analysis by Country, 2024 to 2034

Figure 128: South Asia and Pacific Market Y-o-Y Growth (%) Projections by Country, 2024 to 2034

Figure 129: South Asia and Pacific Market Value (US$ Million) Analysis by Material, 2019 to 2034

Figure 130: South Asia and Pacific Market Volume (Units) Analysis by Material, 2019 to 2034

Figure 131: South Asia and Pacific Market Value Share (%) and BPS Analysis by Material, 2024 to 2034

Figure 132: South Asia and Pacific Market Y-o-Y Growth (%) Projections by Material, 2024 to 2034

Figure 133: South Asia and Pacific Market Value (US$ Million) Analysis by Adhesive, 2019 to 2034

Figure 134: South Asia and Pacific Market Volume (Units) Analysis by Adhesive, 2019 to 2034

Figure 135: South Asia and Pacific Market Value Share (%) and BPS Analysis by Adhesive, 2024 to 2034

Figure 136: South Asia and Pacific Market Y-o-Y Growth (%) Projections by Adhesive, 2024 to 2034

Figure 137: South Asia and Pacific Market Value (US$ Million) Analysis by Application, 2019 to 2034

Figure 138: South Asia and Pacific Market Volume (Units) Analysis by Application, 2019 to 2034

Figure 139: South Asia and Pacific Market Value Share (%) and BPS Analysis by Application, 2024 to 2034

Figure 140: South Asia and Pacific Market Y-o-Y Growth (%) Projections by Application, 2024 to 2034

Figure 141: South Asia and Pacific Market Attractiveness by Material, 2024 to 2034

Figure 142: South Asia and Pacific Market Attractiveness by Adhesive, 2024 to 2034

Figure 143: South Asia and Pacific Market Attractiveness by Application, 2024 to 2034

Figure 144: South Asia and Pacific Market Attractiveness by Country, 2024 to 2034

Figure 145: East Asia Market Value (US$ Million) by Material, 2024 to 2034

Figure 146: East Asia Market Value (US$ Million) by Adhesive, 2024 to 2034

Figure 147: East Asia Market Value (US$ Million) by Application, 2024 to 2034

Figure 148: East Asia Market Value (US$ Million) by Country, 2024 to 2034

Figure 149: East Asia Market Value (US$ Million) Analysis by Country, 2019 to 2034

Figure 150: East Asia Market Volume (Units) Analysis by Country, 2019 to 2034

Figure 151: East Asia Market Value Share (%) and BPS Analysis by Country, 2024 to 2034

Figure 152: East Asia Market Y-o-Y Growth (%) Projections by Country, 2024 to 2034

Figure 153: East Asia Market Value (US$ Million) Analysis by Material, 2019 to 2034

Figure 154: East Asia Market Volume (Units) Analysis by Material, 2019 to 2034

Figure 155: East Asia Market Value Share (%) and BPS Analysis by Material, 2024 to 2034

Figure 156: East Asia Market Y-o-Y Growth (%) Projections by Material, 2024 to 2034

Figure 157: East Asia Market Value (US$ Million) Analysis by Adhesive, 2019 to 2034

Figure 158: East Asia Market Volume (Units) Analysis by Adhesive, 2019 to 2034

Figure 159: East Asia Market Value Share (%) and BPS Analysis by Adhesive, 2024 to 2034

Figure 160: East Asia Market Y-o-Y Growth (%) Projections by Adhesive, 2024 to 2034

Figure 161: East Asia Market Value (US$ Million) Analysis by Application, 2019 to 2034

Figure 162: East Asia Market Volume (Units) Analysis by Application, 2019 to 2034

Figure 163: East Asia Market Value Share (%) and BPS Analysis by Application, 2024 to 2034

Figure 164: East Asia Market Y-o-Y Growth (%) Projections by Application, 2024 to 2034

Figure 165: East Asia Market Attractiveness by Material, 2024 to 2034

Figure 166: East Asia Market Attractiveness by Adhesive, 2024 to 2034

Figure 167: East Asia Market Attractiveness by Application, 2024 to 2034

Figure 168: East Asia Market Attractiveness by Country, 2024 to 2034

Figure 169: Middle East and Africa Market Value (US$ Million) by Material, 2024 to 2034

Figure 170: Middle East and Africa Market Value (US$ Million) by Adhesive, 2024 to 2034

Figure 171: Middle East and Africa Market Value (US$ Million) by Application, 2024 to 2034

Figure 172: Middle East and Africa Market Value (US$ Million) by Country, 2024 to 2034

Figure 173: Middle East and Africa Market Value (US$ Million) Analysis by Country, 2019 to 2034

Figure 174: Middle East and Africa Market Volume (Units) Analysis by Country, 2019 to 2034

Figure 175: Middle East and Africa Market Value Share (%) and BPS Analysis by Country, 2024 to 2034

Figure 176: Middle East and Africa Market Y-o-Y Growth (%) Projections by Country, 2024 to 2034

Figure 177: Middle East and Africa Market Value (US$ Million) Analysis by Material, 2019 to 2034

Figure 178: Middle East and Africa Market Volume (Units) Analysis by Material, 2019 to 2034

Figure 179: Middle East and Africa Market Value Share (%) and BPS Analysis by Material, 2024 to 2034

Figure 180: Middle East and Africa Market Y-o-Y Growth (%) Projections by Material, 2024 to 2034

Figure 181: Middle East and Africa Market Value (US$ Million) Analysis by Adhesive, 2019 to 2034

Figure 182: Middle East and Africa Market Volume (Units) Analysis by Adhesive, 2019 to 2034

Figure 183: Middle East and Africa Market Value Share (%) and BPS Analysis by Adhesive, 2024 to 2034

Figure 184: Middle East and Africa Market Y-o-Y Growth (%) Projections by Adhesive, 2024 to 2034

Figure 185: Middle East and Africa Market Value (US$ Million) Analysis by Application, 2019 to 2034

Figure 186: Middle East and Africa Market Volume (Units) Analysis by Application, 2019 to 2034

Figure 187: Middle East and Africa Market Value Share (%) and BPS Analysis by Application, 2024 to 2034

Figure 188: Middle East and Africa Market Y-o-Y Growth (%) Projections by Application, 2024 to 2034

Figure 189: Middle East and Africa Market Attractiveness by Material, 2024 to 2034

Figure 190: Middle East and Africa Market Attractiveness by Adhesive, 2024 to 2034

Figure 191: Middle East and Africa Market Attractiveness by Application, 2024 to 2034

Figure 192: Middle East and Africa Market Attractiveness by Country, 2024 to 2034

Frequently Asked Questions

How Big is the Sealing and Strapping Packaging Tape Market?

The size of the sealing and strapping packaging tape market is estimated to be USD 23.2 billion in 2024.

Which are the Key Companies in the Sealing and Strapping Packaging Tape Market?

3M Company, Avery Dennison Corporation, Nitto Denko Corporation, and Tesa SE. are some of the key companies in the market.

How Big will the Sealing and Strapping Packaging Tape Market Be by 2034?

The sealing and strapping packaging tape market is expected to reach a valuation of USD 37.6 billion by 2034.

Which Material is Used for the Production of Sealing and Strapping Packaging Tapes?

Paper is the most common material found in sealing and strapping packaging tapes. The segment is predicted to rise at a CAGR of 4.6% over the forecast period.

What are the Key Trends in the Market?

The increase in the import and export of goods and rising eCommerce sales are two of the trends in the market.

At what Rate is the Market Expected to Progress through 2034?

The sealing and strapping packaging tape market is expected to progress at a CAGR of 4.9% from 2024 to 2034.

Explore Packaging Consumables and Supplies Insights

Future Market Insights

Sealing & Strapping Packaging Tape Market