BOPP Packaging Tapes Market
Market Insights on BOPP Packaging Tapes covering sales outlook, demand forecast & up-to-date key trends
BOPP Packaging Tapes Market By Adhesive (Hot Melt Rubber, Hot Melt Acrylic), Thickness (35 - 50 Micron, 51- 65 Micron, Above 65 Micron), Width (11mm -30 mm, 31mm - 70 mm, Above 70 mm) & Region Forecast to 2022 - 2029
BOPP Packaging Tapes Market Outlook (2022-2029)
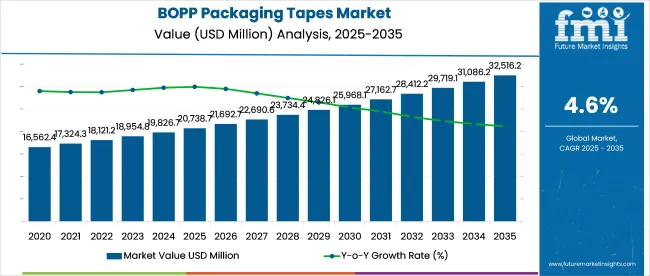
[250 Pages Report] The global BOPP packaging tapes market is bound to reach US$ 23.8 Bn by the year 2029 at a CAGR of 4.5% between 2022 and 2029.
BOPP Packaging Tapes Market Size (2022) |
US$ 17.5 Bn |
Projected Market Value (2029) |
US$ 23.8 Bn |
Global Market Growth Rate (2022-2029) |
4.5% CAGR |
Collective Value Share: Top 5 Companies (2022E) |
17.20% |
The global BOPP Packaging Tapes market was valued at US$ 15.5 Bn in 2018, and is expected to exhibit a CAGR of 4.3% during the forecast period of 2019-2029. Europe, South Asia, and East Asia are expected to hold collective revenue share of 70% in the global market for BOPP Packaging Tapes by the end of 2029.
Let us know your requirement to get
100% FREE customization
BOPP Packaging Tapes Demand Analysis (2014 to 2021) Vs Market Outlook (2022 to 2029)
BOPP packaging tapes are among the most cost-efficient and effective components in packaging solutions. Their versatility is making them useful in multiple applications. The basic structure of BOPP packaging tapes comprises thermoplastic polymer. In other words, BOPP packaging tapes can be used in both - cool and hot temperatures.
The BOPP packaging tapes have a rugged structure that provides high tensile strength for packaging. Properties like these render uniqueness to BOPP packaging tapes, thereby keeping the cash registers ringing for BOPP packaging tapes market.
Usage of BOPP packaging tapes is easy, which makes it feel its presence in sealing and packaging in the manufacturing & warehousing verticals. It could be easily inferred that there is no stoppage to BOPP packaging tapes market in the near future.
Which Vertical takes the Pie?
“e-Commerce Vertical holds the Baton”
The rise in disposable income has motivated individuals to spend more, leading to an increase in online shopping as it not only saves time of consumers but also opens window to a wide range of products at a single click. This has accelerated the e-Commerce market at a substantial rate.
The awareness among the manufacturers has boosted the online websites’ revenue as they are helpful in direct sales of their manufactured products, thereby saving their distribution costs. Emerging economies have started relying more on e-Commerce platforms to conventional methodology to increase their revenue as the involvement of distributors’ margin is out of question.
Find your sweet spots for generating winning opportunities in this market.
Talk to AnalystWhat’s with Customized BOPP Packaging Tapes?
“Customized BOPP Packaging Tapes to dominate the Retail Sector”
The retail market has reformed in the last few year. These days, customers are more fascinated to the packaging of the product. Moreover, customization is being welcomed all over. So, customized BOPP packaging tapes are used for packaging and sealing of products with the company’s brand name on them. This move has resulted in a swift demand for BOPP packaging tapes in the market.
Prominent restaurants have initiated customization of tapes for their take away food for packaging, thereby augmenting its brand image among the customers. The retail market for emerging economies has recently adopted the customized BOPP packaging tapes for packaging, which is bound to keep the hopes high for BOPP packaging tapes market.
What’s with Asia’s BOPP Packaging Tapes Market?
“Asian Market to witness Maximum Turbulence”
Availability of cost-effective raw materials and labor has influenced the multi-national companies to move their production plants to the Asian region. This would, thus, put the Asian market into limelight. The world is eyeing Asia-Pacific, especially Taiwan, as it has grown at a faster pace than China in the past 2 years regarding the production of corrugated sealing tapes.
Top manufacturers of BOPP packaging tapes are setting up their production base in this region due to the reasons mentioned above. The demand for corrugated boxes in the Asian market grew by 20% in the year 2021. This is indicative of the demand for BOPP packaging tapes in the region and this streak is expected to continue all through 2029 as well.

An unified Market Research Subscription Platform, built for today’s disparate research needs.
How has Covid-19 Impacted the BOPP packaging Tapes Market?
The outbreak of Covid-19 had certainly brought the manufacturing industry to a standstill since March 2020. However, normalcy has started setting in now. The packaging industry is picking up, which will result in the market for BOPP packaging tapes taking a catalytic turn in the upcoming period.
This will also help in getting away with monotony. In other words, innovation would certainly be tried out in BOPP packaging tapes, which will help in keeping the BOPP packaging tapes market on the toes. This healthy competition is there to foster the key players herein.
Thus, it could be inferred that Covid-19, though resulting in a temporary blip, would help in welcoming novelty in the BOPP packaging tapes market in the near future.
Competitive Landscape
The global BOPP packaging tapes market competitive landscape includes new product launch, partnerships,, joint ventures, mergers, and acquisitions.
- IPG paves the way for complete line of industrial packaging tape (Pressure-Sensitive Carton-Sealing Tape). It is known as a key manufacturer of superlative quality tape to retail and industrial channels.
BOPP packaging tapes Industry Report Scope
Attribute |
Details |
Forecast Period |
2022-2029 |
Historical Data Available for |
2014-2021 |
Market Analysis |
US$ Mn/Bn for Value |
Key Regions Covered |
North America, Latin America, Europe, South Asia, East Asia, Oceania, and the Middle East & Africa |
Key Countries Covered |
U.S., Canada, Brazil, Mexico, Germany, U.K., France, Italy, Spain, Benelux, Russia, China, Japan, South Korea, India, Thailand, Indonesia, Malaysia, Singapore, China, Japan, South Korea, Australia, New Zealand, Turkey, Egypt, North Africa, South Africa, and GCC Countries |
Key Market Segments Covered |
Thickness, Adhesive, Width, End-use, Region |
Key Companies Profiled |
|
Pricing |
Available upon Request |
Key Segments Covered in BOPP packaging tapes Industry Research
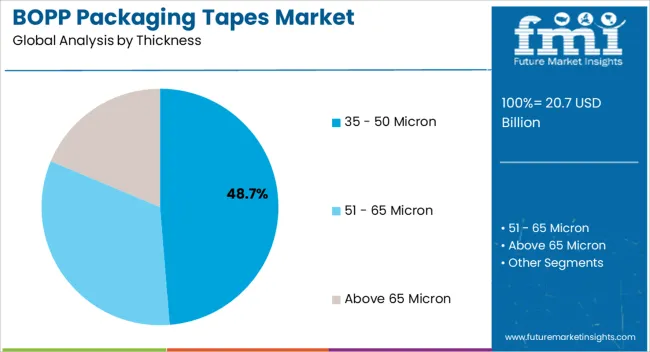
BOPP Packaging Tapes Market by Thickness:
- 35 - 50 Micron
- 51- 65 Micron
- Above 65 Micron
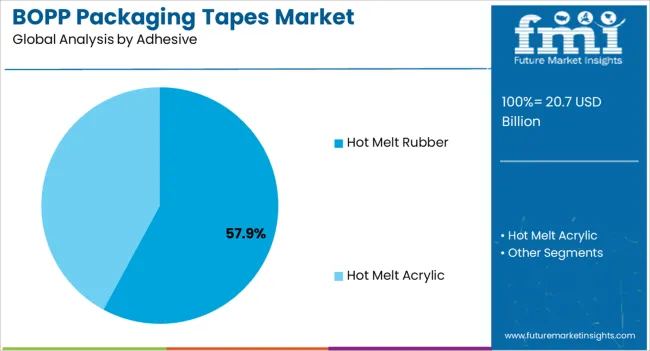
BOPP Packaging Tapes Market by Adhesive:
- Hot Melt Rubber
- Hot Melt Acrylic
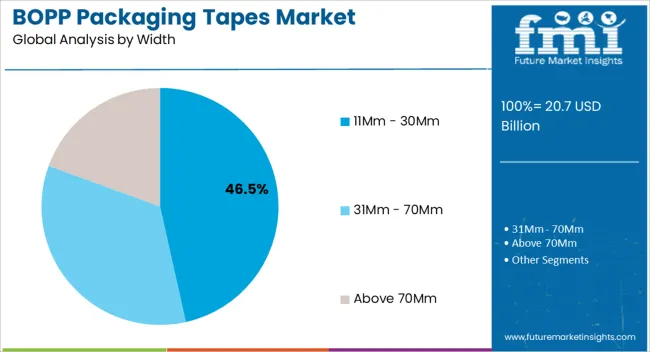
BOPP Packaging Tapes Market by Width:
- 11mm -30 mm
- 31mm - 70 mm
- Above 70 mm
BOPP Packaging Tapes Market by End-user:
- Manufacturing & Warehousing
- Food & Beverages
- Chemicals & Lubricants
- Electronics & Electricals
- Automotive
- Personal care & Cosmetics
- E-Commerce
- Others
BOPP Packaging Tapes Market by Region:
- North America BOPP packaging tapes Market
- Latin America BOPP packaging tapes Market
- Europe BOPP packaging tapes Market
- East Asia BOPP packaging tapes Market
- South Asia BOPP packaging tapes Market
- Oceania BOPP packaging tapes Market
- Middle East & Africa (MEA) BOPP packaging tapes Market
Frequently Asked Questions
The global BOPP packaging tapes market is expected to be worth US$ 17.5 Bn by the year 2022.
The market for BOPP packaging tapes is expected to reach US$ 23.8 Bn by 2029, expanding at a CAGR of 4.5%.
For 2014-2021, BOPP packaging tapes’ sales expanded at the rate of 3.7%.
Bolex Shenzen Adhesive Products Co. Ltd., Intertape Polymer Group Inc., Vibac Group S.p.A, 3M Company, Delphon Industries LLC, and Tesa SE.
North America holds 30% of the overall market share.
Table of Content
1. Executive Summary
1.1. Global Market Outlook
1.2. Demand Side Trends
1.3. Supply Side Trends
1.4. Analysis and Recommendations
2. Market Overview
2.1. Market Coverage
2.2. Market Definition
3. Global BOPP Tapes Market Demand Analysis 2014-2021 and Forecast, 2022-2029
3.1. Historical Market Volume (Units) Analysis, 2014-2021
3.2. Current and Future Market Volume (Units) Projections, 2022-2029
3.3. Y-o-Y Growth Trend Analysis
3.4. Absolute $ Opportunity Analysis
4. Global BOPP Tapes Market - Pricing Analysis
4.1. Regional Pricing Analysis
4.2. Pricing Break-up
4.3. Global Average Pricing Analysis Benchmark
5. Market Background
5.1. Macro-Economic Factors & Co-Relation analysis
5.1.1. Global GDP Growth Outlook
5.1.2. Global Packaging Industry Overview
5.1.3. Opportunities for Backing Material Suppliers
5.1.4. Global Flexible Packaging Outlook
5.1.5. Manufacturing Value Added (MVA)
5.2. Forecast Factors - Relevance & Impact
5.2.1. Microeconomic and Macroeconomic outlook of the Economies by Region/Country – Historical and Forecast
5.2.2. Global Manufacturing Industry Outlook, by Each Region/Country
5.2.3. Global Warehousing Industry Growth Outlook
5.2.4. Segmental Revenue growth, by Each Key Player
5.2.5. Flexible Packaging Market Outlook, by Region
5.2.6. Global Shipping and Logistic Industry Outlook
5.2.7. Global E-Commerce Industry Growth
5.2.8. Global Automotive Industry Growth Outlook
5.2.9. Global Chemical & Lubricants Industry Growth Outlook
5.2.10. Global Electronics Industry Growth Outlook
5.3. Value Chain Analysis & Profitability Margin
5.3.1. Key Market Participants
5.3.1.1. Raw Material Suppliers
5.3.1.2. BOPP Tapes manufacturers
5.3.1.3. Distributors
5.3.1.4. End Users
5.3.2. Profitability Analysis
5.4. Market Dynamics
5.4.1. Drivers
5.4.2. Restraints
5.4.3. Opportunity Analysis
6. Global BOPP Tapes Market Analysis 2014-2021 and Forecast 2022-2029, by Thickness
6.1. Introduction / Key Findings
6.2. Historical Market Size (US$ Mn) and Volume (Units) Analysis By Thickness , 2014 - 2021
6.3. Current and Future Market Size (US$ Mn) and Volume (Units) Analysis and Forecast By Thickness, 2022 - 2029
6.3.1. 35 - 50 Micron
6.3.2. 51- 65 Micron
6.3.3. Above 65 Micron
6.4. Market Attractiveness Analysis By Thickness
7. Global BOPP Tapes Market Analysis 2014-2021 and Forecast 2022-2029, by Adhesive Type
7.1. Introduction / Key Findings
7.2. Historical Market Size (US$ Mn) and Volume (Units) Analysis By Adhesive, 2014 - 2021
7.3. Current and Future Market Size (US$ Mn) and Volume (Units) Analysis and Forecast By Adhesive, 2022 - 2029
7.3.1. Hot Melt Rubber
7.3.2. Hot Melt Acrylic
7.4. Market Attractiveness Analysis By Adhesive
8. Global BOPP Tapes Market Analysis 2014-2021 and Forecast 2022-2029, by Width
8.1. Introduction / Key Findings
8.2. Historical Market Size (US$ Mn) and Volume (Units) Analysis By Width, 2014 - 2021
8.3. Current and Future Market Size (US$ Mn) and Volume (Units) Analysis and Forecast By Width, 2022 - 2029
8.3.1. 11mm -30 mm
8.3.2. 31mm - 70 mm
8.3.3. Above 70 mm
8.4. Market Attractiveness Analysis By Width
9. Global BOPP Tapes Market Analysis 2014-2021 and Forecast 2022-2029, by End Use
9.1. Introduction
9.2. Historical Market Size (US$ Mn) and Volume (Units) Analysis By End Use, 2014 - 2021
9.3. Current and Future Market Size (US$ Mn) and Volume (Units) Analysis and Forecast By End Use, 2022 - 2029
9.3.1. Manufacturing & Warehousing
9.3.1.1. Food & Beverages
9.3.1.2. Chemicals & Lubricants
9.3.1.3. Electronics & Electricals
9.3.1.4. Automotive
9.3.1.5. Personal care & Cosmetics
9.3.2. E-Commerce
9.3.3. Others
9.4. Market Attractiveness Analysis By End Use
10. Global BOPP Tapes Market Analysis 2014-2021 and Forecast 2022-2029, by Region
10.1. Introduction
10.2. Historical Market Size (US$ Mn) and Volume (Units) Analysis By Region, 2014 - 2021
10.3. Current Market Size (US$ Mn) and Volume (Units) Analysis and Forecast By Region, 2022 - 2029
10.3.1. North America
10.3.2. Latin America
10.3.3. Europe
10.3.4. Middle East and Africa (MEA)
10.3.5. East Asia
10.3.6. South Asia
10.3.7. Oceania
10.4. Market Attractiveness Analysis By Region
11. North America BOPP Tapes Market Analysis 2014-2021 and Forecast 2022-2029
11.1. Introduction
11.2. Pricing Analysis
11.3. Historical Market Size (US$ Mn) and Volume (Units) Trend Analysis By Market Taxonomy, 2014 - 2021
11.4. Market Size (US$ Mn) and Volume (Units) Forecast By Market Taxonomy, 2022 - 2029
11.4.1. By Country
11.4.1.1. U.S.
11.4.1.2. Canada
11.4.2. By Thickness
11.4.3. By Width
11.4.4. By Adhesive Type
11.4.5. By End Use
11.5. Market Attractiveness Analysis
11.5.1. By Country
11.5.2. By Thickness
11.5.3. By Width
11.5.4. By Adhesive Type
11.5.5. By End Use
11.6. Market Trends
12. Latin America BOPP Tapes Market Analysis 2014-2021 and Forecast 2022-2029
12.1. Introduction
12.2. Pricing Analysis
12.3. Historical Market Size (US$ Mn) and Volume (Units) Trend Analysis By Market Taxonomy, 2014 - 2021
12.4. Market Size (US$ Mn) and Volume (Units) Forecast By Market Taxonomy, 2022 - 2029
12.4.1. By Country
12.4.1.1. Brazil
12.4.1.2. Mexico
12.4.1.3. Rest of Latin America
12.4.2. By Thickness
12.4.3. By Width
12.4.4. By Adhesive Type
12.4.5. By End Use
12.5. Market Attractiveness Analysis
12.5.1. By Country
12.5.2. By Thickness
12.5.3. By Width
12.5.4. By Adhesive Type
12.5.5. By End Use
12.6. Market Trends
13. Europe BOPP Tapes Market Analysis 2014-2021 and Forecast 2022-2029
13.1. Introduction
13.2. Pricing Analysis
13.3. Historical Market Size (US$ Mn) and Volume (Units) Trend Analysis By Market Taxonomy, 2014 - 2021
13.4. Market Size (US$ Mn) and Volume (Units) Forecast By Market Taxonomy, 2022 - 2029
13.4.1. By Country
13.4.1.1. Germany
13.4.1.2. Italy
13.4.1.3. France
13.4.1.4. U.K.
13.4.1.5. Spain
13.4.1.6. BENELUX
13.4.1.7. Russia
13.4.1.8. Rest of Europe
13.4.2. By Thickness
13.4.3. By Width
13.4.4. By Adhesive Type
13.4.5. By End Use
13.5. Market Attractiveness Analysis
13.5.1. By Country
13.5.2. By Thickness
13.5.3. By Width
13.5.4. By Adhesive Type
13.5.5. By End Use
13.6. Market Trends
14. South Asia BOPP Tapes Market Analysis 2014-2021 and Forecast 2022-2029
14.1. Introduction
14.2. Pricing Analysis
14.3. Historical Market Size (US$ Mn) and Volume (Units) Trend Analysis By Market Taxonomy, 2014 - 2021
14.4. Market Size (US$ Mn) and Volume (Units) Forecast By Market Taxonomy, 2022 - 2029
14.4.1. By Country
14.4.1.1. India
14.4.1.2. Thailand
14.4.1.3. Indonesia
14.4.1.4. Rest of South Asia
14.4.2. By Thickness
14.4.3. By Width
14.4.4. By Adhesive Type
14.4.5. By End Use
14.5. Market Attractiveness Analysis
14.5.1. By Country
14.5.2. By Thickness
14.5.3. By Width
14.5.4. By Adhesive Type
14.5.5. By End Use
14.6. Market Trends
15. East Asia BOPP Tapes Market Analysis 2014-2021 and Forecast 2022-2029
15.1. Introduction
15.2. Pricing Analysis
15.3. Historical Market Size (US$ Mn) and Volume (Units) Trend Analysis By Market Taxonomy, 2014 - 2021
15.4. Market Size (US$ Mn) and Volume (Units) Forecast By Market Taxonomy, 2022 - 2029
15.4.1. By Country
15.4.1.1. China
15.4.1.2. Japan
15.4.1.3. South Korea
15.4.2. By Thickness
15.4.3. By Width
15.4.4. By Adhesive Type
15.4.5. By End Use
15.5. Market Attractiveness Analysis
15.5.1. By Country
15.5.2. By Thickness
15.5.3. By Width
15.5.4. By Adhesive Type
15.5.5. By End Use
15.6. Market Trends
16. Middle East and Africa BOPP Tapes Market Analysis 2014-2021 and Forecast 2022-2029
16.1. Introduction
16.2. Pricing Analysis
16.3. Historical Market Size (US$ Mn) and Volume (Units) Trend Analysis By Market Taxonomy, 2014 - 2021
16.4. Market Size (US$ Mn) and Volume (Units) Forecast By Market Taxonomy, 2022 - 2029
16.4.1. By Country
16.4.1.1. GCC Countries
16.4.1.2. Turkey
16.4.1.3. Northern Africa
16.4.1.4. South Africa
16.4.1.5. Rest of Middle East and Africa
16.4.2. By Thickness
16.4.3. By Width
16.4.4. By Adhesive Type
16.4.5. By End Use
16.5. Market Attractiveness Analysis
16.5.1. By Country
16.5.2. By Thickness
16.5.3. By Width
16.5.4. By Adhesive Type
16.5.5. By End Use
16.6. Market Trends
17. Oceania BOPP Tapes Market Analysis 2014-2021 and Forecast 2022-2029
17.1. Introduction
17.2. Pricing Analysis
17.3. Historical Market Size (US$ Mn) and Volume (Units) Trend Analysis By Market Taxonomy, 2014 - 2021
17.4. Market Size (US$ Mn) and Volume (Units) Forecast By Market Taxonomy, 2022 - 2029
17.4.1. By Country
17.4.1.1. Australia
17.4.1.2. New Zealand
17.4.2. By Thickness
17.4.3. By Width
17.4.4. By Adhesive Type
17.4.5. By End Use
17.5. Market Attractiveness Analysis
17.5.1. By Country
17.5.2. By Thickness
17.5.3. By Width
17.5.4. By Adhesive Type
17.5.5. By End Use
17.6. Market Trends
18. Emerging Countries BOPP Tapes Market Analysis 2014-2021 and Forecast 2022-2029
18.1. Introduction
18.1.1. Market Value Proportion Analysis, By Key Countries
18.1.2. Global Vs. Country Growth Comparison
18.2. Brazil BOPP Tapes Market Analysis
18.2.1. Introduction
18.2.2. Pricing Analysis
18.2.3. Market Value Proportion Analysis by Market Taxonomy
18.2.4. Market Volume (Units) (Mn Units) and Value (US$ Mn) Analysis and Forecast by Market Taxonomy
18.2.4.1. By Thickness
18.2.4.2. By Width
18.2.4.3. By Adhesive Type
18.2.4.4. By End Use
18.2.5. Brazil BOPP Tapes Market - Competition Landscape
18.3. India BOPP Tapes Market Analysis
18.3.1. Introduction
18.3.2. Pricing Analysis
18.3.3. Market Value Proportion Analysis by Market Taxonomy
18.3.4. Market Volume (Units) (Mn Units) and Value (US$ Mn) Analysis and Forecast by Market Taxonomy
18.3.4.1. By Thickness
18.3.4.2. By Width
18.3.4.3. By Adhesive Type
18.3.4.4. By End Use
18.3.5. India BOPP Tapes Market - Competition Landscape
18.4. China BOPP Tapes Market Analysis
18.4.1. Introduction
18.4.2. Pricing Analysis
18.4.3. Market Value Proportion Analysis by Market Taxonomy
18.4.4. Market Volume (Units) (Mn Units) and Value (US$ Mn) Analysis and Forecast by Market Taxonomy
18.4.4.1. By Thickness
18.4.4.2. By Width
18.4.4.3. By Adhesive Type
18.4.4.4. By End Use
18.4.5. China BOPP Tapes Market - Competition Landscape
19. Market Structure Analysis
19.1. Market Analysis by Tier of Companies (BOPP Tapes)
19.2. Market Concentration
19.3. Market Share Analysis of Top Players
19.4. Market Presence Analysis
19.4.1. By Regional footprint of Players
19.4.2. Product foot print by Players
19.4.3. Channel Foot Print by Players
20. Competition Analysis
20.1. Competition Dashboard
20.2. Pricing Analysis by Competition
20.3. Competition Benchmarking
20.4. Competition Deep Dive
20.4.1. Vibac Group S.p.a
20.4.1.1. Overview
20.4.1.2. Product Portfolio
20.4.1.3. Profitability by Market Segments (Product/Channel/Region)
20.4.1.4. Sales Footprint
20.4.1.5. Strategy Overview
20.4.1.5.1. Marketing Strategy
20.4.1.5.2. Product Strategy
20.4.1.5.3. Channel Strategy
20.4.2. Bolex Shenzhen Adhesive Products Co Ltd.
20.4.2.1. Overview
20.4.2.2. Product Portfolio
20.4.2.3. Profitability by Market Segments (Product/Channel/Region)
20.4.2.4. Sales Footprint
20.4.2.5. Strategy Overview
20.4.2.5.1. Marketing Strategy
20.4.2.5.2. Product Strategy
20.4.2.5.3. Channel Strategy
20.4.3. Intertape Polymer Group Inc.
20.4.3.1. Overview
20.4.3.2. Product Portfolio
20.4.3.3. Profitability by Market Segments (Product/Channel/Region)
20.4.3.4. Sales Footprint
20.4.3.5. Strategy Overview
20.4.3.5.1. Marketing Strategy
20.4.3.5.2. Product Strategy
20.4.3.5.3. Channel Strategy
20.4.4. tesa SE
20.4.4.1. Overview
20.4.4.2. Product Portfolio
20.4.4.3. Profitability by Market Segments (Product/Channel/Region)
20.4.4.4. Sales Footprint
20.4.4.5. Strategy Overview
20.4.4.5.1. Marketing Strategy
20.4.4.5.2. Product Strategy
20.4.4.5.3. Channel Strategy
20.4.5. Atlas Tapes S.A.
20.4.5.1. Overview
20.4.5.2. Product Portfolio
20.4.5.3. Profitability by Market Segments (Product/Channel/Region)
20.4.5.4. Sales Footprint
20.4.5.5. Strategy Overview
20.4.5.5.1. Marketing Strategy
20.4.5.5.2. Product Strategy
20.4.5.5.3. Channel Strategy
20.4.6. 3M Company
20.4.6.1. Overview
20.4.6.2. Product Portfolio
20.4.6.3. Profitability by Market Segments (Product/Channel/Region)
20.4.6.4. Sales Footprint
20.4.6.5. Strategy Overview
20.4.6.5.1. Marketing Strategy
20.4.6.5.2. Product Strategy
20.4.6.5.3. Channel Strategy
20.4.7. Shurtape Technologies, LLC
20.4.7.1. Overview
20.4.7.2. Product Portfolio
20.4.7.3. Profitability by Market Segments (Product/Channel/Region)
20.4.7.4. Sales Footprint
20.4.7.5. Strategy Overview
20.4.7.5.1. Marketing Strategy
20.4.7.5.2. Product Strategy
20.4.7.5.3. Channel Strategy
20.4.8. ADH Tape
20.4.8.1. Overview
20.4.8.2. Product Portfolio
20.4.8.3. Profitability by Market Segments (Product/Channel/Region)
20.4.8.4. Sales Footprint
20.4.8.5. Strategy Overview
20.4.8.5.1. Marketing Strategy
20.4.8.5.2. Product Strategy
20.4.8.5.3. Channel Strategy
20.4.9. Ritu Raj Tapes Pvt. Ltd.
20.4.9.1. Overview
20.4.9.2. Product Portfolio
20.4.9.3. Profitability by Market Segments (Product/Channel/Region)
20.4.9.4. Sales Footprint
20.4.9.5. Strategy Overview
20.4.9.5.1. Marketing Strategy
20.4.9.5.2. Product Strategy
20.4.9.5.3. Channel Strategy
20.4.10. UBIS
20.4.10.1. Overview
20.4.10.2. Product Portfolio
20.4.10.3. Profitability by Market Segments (Product/Channel/Region)
20.4.10.4. Sales Footprint
20.4.10.5. Strategy Overview
20.4.10.5.1. Marketing Strategy
20.4.10.5.2. Product Strategy
20.4.10.5.3. Channel Strategy
20.4.11. Scapa Group plc.
20.4.11.1. Overview
20.4.11.2. Product Portfolio
20.4.11.3. Profitability by Market Segments (Product/Channel/Region)
20.4.11.4. Sales Footprint
20.4.11.5. Strategy Overview
20.4.11.5.1. Marketing Strategy
20.4.11.5.2. Product Strategy
20.4.11.5.3. Channel Strategy
20.4.12. Shenzhen YOST Industrial Co., Ltd
20.4.12.1. Overview
20.4.12.2. Product Portfolio
20.4.12.3. Profitability by Market Segments (Product/Channel/Region)
20.4.12.4. Sales Footprint
20.4.12.5. Strategy Overview
20.4.12.5.1. Marketing Strategy
20.4.12.5.2. Product Strategy
20.4.12.5.3. Channel Strategy
20.4.13. UK Industrial Tapes Ltd.
20.4.13.1. Overview
20.4.13.2. Product Portfolio
20.4.13.3. Profitability by Market Segments (Product/Channel/Region)
20.4.13.4. Sales Footprint
20.4.13.5. Strategy Overview
20.4.13.5.1. Marketing Strategy
20.4.13.5.2. Product Strategy
20.4.13.5.3. Channel Strategy
20.4.14. Delphon Industries LLC
20.4.14.1. Overview
20.4.14.2. Product Portfolio
20.4.14.3. Profitability by Market Segments (Product/Channel/Region)
20.4.14.4. Sales Footprint
20.4.14.5. Strategy Overview
20.4.14.5.1. Marketing Strategy
20.4.14.5.2. Product Strategy
20.4.14.5.3. Channel Strategy
20.4.15. National Company for Adhesive Tape
20.4.15.1. Overview
20.4.15.2. Product Portfolio
20.4.15.3. Profitability by Market Segments (Product/Channel/Region)
20.4.15.4. Sales Footprint
20.4.15.5. Strategy Overview
20.4.15.5.1. Marketing Strategy
20.4.15.5.2. Product Strategy
20.4.15.5.3. Channel Strategy
20.4.16. Tuftape Fzco
20.4.16.1. Overview
20.4.16.2. Product Portfolio
20.4.16.3. Profitability by Market Segments (Product/Channel/Region)
20.4.16.4. Sales Footprint
20.4.16.5. Strategy Overview
20.4.16.5.1. Marketing Strategy
20.4.16.5.2. Product Strategy
20.4.16.5.3. Channel Strategy
20.4.17. Bagla Group
20.4.17.1. Overview
20.4.17.2. Product Portfolio
20.4.17.3. Profitability by Market Segments (Product/Channel/Region)
20.4.17.4. Sales Footprint
20.4.17.5. Strategy Overview
20.4.17.5.1. Marketing Strategy
20.4.17.5.2. Product Strategy
20.4.17.5.3. Channel Strategy
20.4.18. Western Paper Industries (Pvt) Ltd.
20.4.18.1. Overview
20.4.18.2. Product Portfolio
20.4.18.3. Profitability by Market Segments (Product/Channel/Region)
20.4.18.4. Sales Footprint
20.4.18.5. Strategy Overview
20.4.18.5.1. Marketing Strategy
20.4.18.5.2. Product Strategy
20.4.18.5.3. Channel Strategy
20.4.19. Irplast S.p.A
20.4.19.1. Overview
20.4.19.2. Product Portfolio
20.4.19.3. Profitability by Market Segments (Product/Channel/Region)
20.4.19.4. Sales Footprint
20.4.19.5. Strategy Overview
20.4.19.5.1. Marketing Strategy
20.4.19.5.2. Product Strategy
20.4.19.5.3. Channel Strategy
20.4.20. Teraoka Seisakusho Co., Ltd.
20.4.20.1. Overview
20.4.20.2. Product Portfolio
20.4.20.3. Profitability by Market Segments (Product/Channel/Region)
20.4.20.4. Sales Footprint
20.4.20.5. Strategy Overview
20.4.20.5.1. Marketing Strategy
20.4.20.5.2. Product Strategy
20.4.20.5.3. Channel Strategy
21. Assumptions and Acronyms Used
22. Research Methodology
Let us know your requirement to get
100% FREE customization
List of Tables
Table 01: Global BOPP Tapes Market Volume (Mn Sq.m) 2014H-2029F, by Region
Table 02: Global BOPP Tapes Market Value (US$ Mn) 2014H-2029F, by Region
Table 03: Global BOPP Tapes Market Volume (Mn Sq.m) 2014H-2029F, by Thickness
Table 04: Global BOPP Tapes Market Value (US$ Mn) 2014H-2029F, by Thickness
Table 05: Global BOPP Tapes Market Volume (Mn Sq.m) 2014H-2029F, by Adhesive
Table 06: Global BOPP Tapes Market Value (US$ Mn) 2014H-2029F, by Adhesive
Table 07: Global BOPP Tapes Market Volume (Mn Sq.m) 2014H-2029F, by Width
Table 08: Global BOPP Tapes Market Value (US$ Mn) 2014H-2029F, by Width
Table 09: Global BOPP Tapes Market Volume (Mn Sq.m) 2014H-2029F, by End Use
Table 10: Global BOPP Tapes Market Value (US$ Mn) 2014H-2029F, by End Use
Table 11: North America BOPP tapes Market Value (US$ Mn) 2014H-2029F, by Country
Table 12: North America BOPP tapes Market Volume (Mn Sq.m) 2014H-2029F, by Country
Table 13: North America BOPP Tapes Market Volume (Mn Sq.m) 2014H-2029F, by Thickness
Table 14: North America BOPP Tapes Market Value (US$ Mn) 2014H-2029F, by Thickness
Table 15: North America BOPP Tapes Market Volume (Mn Sq.m) 2014H-2029F, by Adhesive
Table 16: North America BOPP Tapes Market Value (US$ Mn) 2014H-2029F, by Adhesive
Table 17: North America BOPP Tapes Market Volume (Mn Sq.m) 2014H-2029F, by Width
Table 18: North America BOPP Tapes Market Value (US$ Mn) 2014H-2029F, by Width
Table 19: North America BOPP Tapes Market Volume (Mn Sq.m) 2014H-2029F, by End Use
Table 20: North America BOPP Tapes Market Value (US$ Mn) 2014H-2029F, by End Use
Table 21: Latin America BOPP tapes Market Value (US$ Mn) 2014H-2029F, by Country
Table 22: Latin America BOPP tapes Market Volume (Mn Sq.m) 2014H-2029F, by Country
Table 23: Latin America BOPP Tapes Market Volume (Mn Sq.m) 2014H-2029F, by Thickness
Table 24: Latin America BOPP Tapes Market Value (US$ Mn) 2014H-2029F, by Thickness
Table 25: Latin America BOPP Tapes Market Volume (Mn Sq.m) 2014H-2029F, by Adhesive
Table 26: Latin America BOPP Tapes Market Value (US$ Mn) 2014H-2029F, by Adhesive
Table 27: Latin America BOPP Tapes Market Volume (Mn Sq.m) 2014H-2029F, by Width
Table 28: Latin America BOPP Tapes Market Value (US$ Mn) 2014H-2029F, by Width
Table 29: Latin America BOPP Tapes Market Volume (Mn Sq.m) 2014H-2029F, by End Use
Table 30: Latin America BOPP Tapes Market Value (US$ Mn) 2014H-2029F, by End Use
Table 31: Europe BOPP tapes Market Value (US$ Mn) 2014H-2029F, by Country
Table 32: Europe BOPP tapes Market Volume (Mn Sq.m) 2014H-2029F, by Country
Table 33: Europe BOPP Tapes Market Volume (Mn Sq.m) 2014H-2029F, by Thickness
Table 34: Europe BOPP Tapes Market Value (US$ Mn) 2014H-2029F, by Thickness
Table 35: Europe BOPP Tapes Market Volume (Mn Sq.m) 2014H-2029F, by Adhesive
Table 36: Europe BOPP Tapes Market Value (US$ Mn) 2014H-2029F, by Adhesive
Table 37: Europe BOPP Tapes Market Volume (Mn Sq.m) 2014H-2029F, by Width
Table 38: Europe BOPP Tapes Market Value (US$ Mn) 2014H-2029F, by Width
Table 39: Europe BOPP Tapes Market Volume (Mn Sq.m) 2014H-2029F, by End Use
Table 40: Europe BOPP Tapes Market Value (US$ Mn) 2014H-2029F, by End Use
Table 41: South Asia BOPP tapes Market Value (US$ Mn) 2014H-2029F, by Country
Table 42: South Asia BOPP tapes Market Volume (Mn Sq.m) 2014H-2029F, by Country
Table 43: South Asia BOPP Tapes Market Volume (Mn Sq.m) 2014H-2029F, by Thickness
Table 44: South Asia BOPP Tapes Market Value (US$ Mn) 2014H-2029F, by Thickness
Table 45: South Asia BOPP Tapes Market Volume (Mn Sq.m) 2014H-2029F, by Adhesive
Table 46: South Asia BOPP Tapes Market Value (US$ Mn) 2014H-2029F, by Adhesive
Table 47: South Asia BOPP Tapes Market Volume (Mn Sq.m) 2014H-2029F, by Width
Table 48: South Asia BOPP Tapes Market Value (US$ Mn) 2014H-2029F, by Width
Table 49: South Asia BOPP Tapes Market Volume (Mn Sq.m) 2014H-2029F, by End Use
Table 50: South Asia BOPP Tapes Market Value (US$ Mn) 2014H-2029F, by End Use
Table 51: East Asia BOPP tapes Market Value (US$ Mn) 2014H-2029F, by Country
Table 52: East Asia BOPP tapes Market Volume (Mn Sq.m) 2014H-2029F, by Country
Table 53: East Asia BOPP Tapes Market Volume (Mn Sq.m) 2014H-2029F, by Thickness
Table 54: East Asia BOPP Tapes Market Volume (Mn Sq.m) 2014H-2029F, by Adhesive
Table 55: East Asia BOPP Tapes Market Value (US$ Mn) 2014H-2029F, by Adhesive
Table 56: East Asia BOPP Tapes Market Volume (Mn Sq.m) 2014H-2029F, by Width
Table 57: East Asia BOPP Tapes Market Value (US$ Mn) 2014H-2029F, by Width
Table 58: East Asia BOPP Tapes Market Volume (Mn Sq.m) 2014H-2029F, by End Use
Table 59: East Asia BOPP Tapes Market Value (US$ Mn) 2014H-2029F, by End Use
Table 60: MEA BOPP tapes Market Value (US$ Mn) 2014H-2029F, by Country
Table 61: MEA BOPP tapes Market Volume (Mn Sq.m) 2014H-2029F, by Country
Table 62: MEA BOPP Tapes Market Volume (Mn Sq.m) 2014H-2029F, by Thickness
Table 63: MEA BOPP Tapes Market Value (US$ Mn) 2014H-2029F, by Thickness
Table 64: MEA BOPP Tapes Market Volume (Mn Sq.m) 2014H-2029F, by Adhesive
Table 65: MEA BOPP Tapes Market Value (US$ Mn) 2014H-2029F, by Adhesive
Table 66: MEA BOPP Tapes Market Volume (Mn Sq.m) 2014H-2029F, by Width
Table 67: MEA BOPP Tapes Market Value (US$ Mn) 2014H-2029F, by Width
Table 68: MEA BOPP Tapes Market Volume (Mn Sq.m) 2014H-2029F, by End Use
Table 69: MEA BOPP Tapes Market Value (US$ Mn) 2014H-2029F, by End Use
Table 70: Oceania BOPP tapes Market Value (US$ Mn) 2014H-2029F, by Country
Table 71: Oceania BOPP tapes Market Volume (Mn Sq.m) 2014H-2029F, by Country
Table 72: Oceania BOPP Tapes Market Volume (Mn Sq.m) 2014H-2029F, by Thickness
Table 73: Oceania BOPP Tapes Market Value (US$ Mn) 2014H-2029F, by Thickness
Table 74: Oceania BOPP Tapes Market Volume (Mn Sq.m) 2014H-2029F, by Adhesive
Table 75: Oceania BOPP Tapes Market Value (US$ Mn) 2014H-2029F, by Adhesive
Table 76: Oceania BOPP Tapes Market Volume (Mn Sq.m) 2014H-2029F, by Width
Table 77: Oceania BOPP Tapes Market Value (US$ Mn) 2014H-2029F, by Width
Table 78: Oceania BOPP Tapes Market Volume (Mn Sq.m) 2014H-2029F, by End Use
Table 79: Oceania BOPP Tapes Market Value (US$ Mn) 2014H-2029F, by End Use
Find your sweet spots for generating winning opportunities in this market.
Talk to AnalystList of Charts
Figure 01: Global BOPP Tapes Market Demand (Value In US$ Mn) Analysis 2014-2021, and Forecast 2019-2029
Figure 02: Global BOPP Tapes Market Demand (Volume in Mn.Sq.m) Analysis 2014-2021, and Forecast 2019-2029
Figure 03: Global BOPP Tapes Market Value (US$ Mn) and Absolute $ Opportunity (US$ Mn)
Figure 04 :BOPP Tapes Pricing Analysis by technology (US$/'000 Sq.m), 2019
Figure 05: Global BOPP Tapes Market Share Analysis by End Use (2014H, 2022E & 2029F)
Figure 06: Global BOPP Tapes Market Y-o-Y Growth, by End Use (2015H-2029F)
Figure 07: Global BOPP tapes Market Attractiveness Analysis (2021A-2029F), by Region
Figure 08: Global BOPP Tapes Market Share Analysis by Thickness Type (2014H, 2022E & 2029F)
Figure 09: Global BOPP Tapes Market Y-o-Y Growth, by Thickness Type (2015H-2029F)
Figure 10: Global BOPP Tapes Market Share Analysis by Adhesive Type (2014H, 2022E & 2029F)
Figure 11: Global BOPP Tapes Market Y-o-Y Growth, by Adhesive Type (2015H-2029F)
Figure 12: Global BOPP Tapes Market Share Analysis by Width (2014H, 2022E & 2029F)
Figure 13: Global BOPP Tapes Market Y-o-Y Growth, by Width (2015H-2029F)
Figure 14: Global BOPP Tapes Market Share Analysis by End Use (2014H, 2022E & 2029F)
Figure 15: Global BOPP Tapes Market Y-o-Y Growth, by End Use (2015H-2029F)
Figure 16: North America BOPP tapes Market Share Analysis by Country (2014H, 2022E & 2029F)
Figure 17: North America BOPP tapes Market Y-o-Y Growth, by Country (2015H-2029F)
Figure 18: North America BOPP tapes Market Attractiveness Analysis (2021A-2029F), by Country
Figure 19: North America BOPP Tapes Market Share Analysis by Thickness Type (2014H, 2022E & 2029F)
Figure 20: North America BOPP Tapes Market Y-o-Y Growth, by Thickness Type (2015H-2029F)
Figure 21: North America BOPP Tapes Market Share Analysis by Adhesive Type (2014H, 2022E & 2029F)
Figure 22: North America BOPP Tapes Market Y-o-Y Growth, by Adhesive Type (2015H-2029F)
Figure 23: North America BOPP Tapes Market Share Analysis by Width (2014H, 2022E & 2029F)
Figure 24: North America BOPP Tapes Market Y-o-Y Growth, by Width (2015H-2029F)
Figure 25: North America BOPP Tapes Market Share Analysis by End Use (2014H, 2022E & 2029F)
Figure 26: North America BOPP Tapes Market Y-o-Y Growth, by End Use (2015H-2029F)
Figure 27: Latin America BOPP tapes Market Share Analysis by Country (2014H, 2022E & 2029F)
Figure 28: Latin America BOPP tapes Market Y-o-Y Growth, by Country (2015H-2029F)
Figure 29: Latin America BOPP tapes Market Attractiveness Analysis (2021A-2029F), by Country
Figure 30: Latin America BOPP Tapes Market Share Analysis by Thickness Type (2014H, 2022E & 2029F)
Figure 31: Latin America BOPP Tapes Market Y-o-Y Growth, by Thickness Type (2015H-2029F)
Figure 32: Latin America BOPP Tapes Market Share Analysis by Adhesive Type (2014H, 2022E & 2029F)
Figure 33: Latin America BOPP Tapes Market Y-o-Y Growth, by Adhesive Type (2015H-2029F)
Figure 34: Latin America BOPP Tapes Market Share Analysis by Width (2014H, 2022E & 2029F)
Figure 35: Latin America BOPP Tapes Market Y-o-Y Growth, by Width (2015H-2029F)
Figure 36: Latin America BOPP Tapes Market Share Analysis by End Use (2014H, 2022E & 2029F)
Figure 37: Latin America BOPP Tapes Market Y-o-Y Growth, by End Use (2015H-2029F)
Figure 38: Europe BOPP tapes Market Share Analysis by Country (2014H, 2022E & 2029F)
Figure 39: Europe BOPP tapes Market Y-o-Y Growth, by Country (2015H-2029F)
Figure 40: Europe BOPP tapes Market Attractiveness Analysis (2021A-2029F), by Country
Figure 41: Europe BOPP Tapes Market Share Analysis by Thickness Type (2014H, 2022E & 2029F)
Figure 42: Europe BOPP Tapes Market Y-o-Y Growth, by Thickness Type (2015H-2029F)
Figure 43: Europe BOPP Tapes Market Share Analysis by Adhesive Type (2014H, 2022E & 2029F)
Figure 44: Europe BOPP Tapes Market Y-o-Y Growth, by Adhesive Type (2015H-2029F)
Figure 45: Europe BOPP Tapes Market Share Analysis by Width (2014H, 2022E & 2029F)
Figure 46: Europe BOPP Tapes Market Y-o-Y Growth, by Width (2015H-2029F)
Figure 47: Europe BOPP Tapes Market Share Analysis by End Use (2014H, 2022E & 2029F)
Figure 48: Europe BOPP Tapes Market Y-o-Y Growth, by End Use (2015H-2029F)
Figure 49: South Asia BOPP tapes Market Share Analysis by Country (2014H, 2022E & 2029F)
Figure 50: South Asia BOPP tapes Market Y-o-Y Growth, by Country (2015H-2029F)
Figure 51: South Asia BOPP tapes Market Attractiveness Analysis (2021A-2029F), by Country
Figure 52: South Asia BOPP Tapes Market Share Analysis by Thickness Type (2014H, 2022E & 2029F)
Figure 53: South Asia BOPP Tapes Market Y-o-Y Growth, by Thickness Type (2015H-2029F)
Figure 54: South Asia BOPP Tapes Market Share Analysis by Adhesive Type (2014H, 2022E & 2029F)
Figure 55: South Asia BOPP Tapes Market Y-o-Y Growth, by Adhesive Type (2015H-2029F)
Figure 56: South Asia BOPP Tapes Market Share Analysis by Width (2014H, 2022E & 2029F)
Figure 57: South Asia BOPP Tapes Market Y-o-Y Growth, by Width (2015H-2029F)
Figure 58: South Asia BOPP Tapes Market Share Analysis by End Use (2014H, 2022E & 2029F)
Figure 59: South Asia BOPP Tapes Market Y-o-Y Growth, by End Use (2015H-2029F)
Figure 60: East Asia BOPP tapes Market Share Analysis by Country (2014H, 2022E & 2029F)
Figure 61: East Asia BOPP tapes Market Y-o-Y Growth, by Country (2015H-2029F)
Figure 62: East Asia BOPP tapes Market Attractiveness Analysis (2021A-2029F), by Country
Figure 63: East Asia BOPP Tapes Market Share Analysis by Thickness Type (2014H, 2022E & 2029F)
Figure 64: East Asia BOPP Tapes Market Y-o-Y Growth, by Thickness Type (2015H-2029F)
Figure 65: East Asia BOPP Tapes Market Share Analysis by Adhesive Type (2014H, 2022E & 2029F)
Figure 66: East Asia BOPP Tapes Market Y-o-Y Growth, by Adhesive Type (2015H-2029F)
Figure 67: East Asia BOPP Tapes Market Share Analysis by Width (2014H, 2022E & 2029F)
Figure 68: East Asia BOPP Tapes Market Y-o-Y Growth, by Width (2015H-2029F)
Figure 69: East Asia BOPP Tapes Market Share Analysis by End Use (2014H, 2022E & 2029F)
Figure 70: East Asia BOPP Tapes Market Y-o-Y Growth, by End Use (2015H-2029F)
Figure 71: MEA BOPP tapes Market Share Analysis by Country (2014H, 2022E & 2029F)
Figure 72: MEA BOPP tapes Market Y-o-Y Growth, by Country (2015H-2029F)
Figure 73: MEA BOPP tapes Market Attractiveness Analysis (2021A-2029F), by Country
Figure 74: MEA BOPP Tapes Market Share Analysis by Thickness Type (2014H, 2022E & 2029F)
Figure 75: MEA BOPP Tapes Market Y-o-Y Growth, by Thickness Type (2015H-2029F)
Figure 76: MEA BOPP Tapes Market Share Analysis by Adhesive Type (2014H, 2022E & 2029F)
Figure 77: MEA BOPP Tapes Market Y-o-Y Growth, by Adhesive Type (2015H-2029F)
Figure 78: MEA BOPP Tapes Market Share Analysis by Width (2014H, 2022E & 2029F)
Figure 79: MEA BOPP Tapes Market Y-o-Y Growth, by Width (2015H-2029F)
Figure 80: MEA BOPP Tapes Market Share Analysis by End Use (2014H, 2022E & 2029F)
Figure 81: MEA BOPP Tapes Market Y-o-Y Growth, by End Use (2015H-2029F)
Figure 82: Oceania BOPP tapes Market Share Analysis by Country (2014H, 2022E & 2029F)
Figure 83: Oceania BOPP tapes Market Y-o-Y Growth, by Country (2015H-2029F)
Figure 84: Oceania BOPP tapes Market Attractiveness Analysis (2021A-2029F), by Country
Figure 85: Oceania BOPP Tapes Market Share Analysis by Thickness Type (2014H, 2022E & 2029F)
Figure 86: Oceania BOPP Tapes Market Y-o-Y Growth, by Thickness Type (2015H-2029F)
Figure 87: Oceania BOPP Tapes Market Share Analysis by Adhesive Type (2014H, 2022E & 2029F)
Figure 88: Oceania BOPP Tapes Market Y-o-Y Growth, by Adhesive Type (2015H-2029F)
Figure 89: Oceania BOPP Tapes Market Share Analysis by Width (2014H, 2022E & 2029F)
Figure 90: Oceania BOPP Tapes Market Y-o-Y Growth, by Width (2015H-2029F)
Figure 91: Oceania BOPP Tapes Market Share Analysis by End Use (2014H, 2022E & 2029F)
Figure 92: Oceania BOPP Tapes Market Y-o-Y Growth, by End Use (2015H-2029F)
Need specific information?
Request CustomizationExplore Packaging Insights
View Reports