The natural surfactant market is estimated to be valued at USD 22.5 billion in 2025 and is projected to reach USD 37.7 billion by 2035, registering a compound annual growth rate (CAGR) of 5.3% over the forecast period.
Values progress from 22.5 billion in 2025 to 25.0 billion in 2027 and 27.7 billion in 2029, reflecting stable adoption across personal care, household cleaning, and agrochemical applications. Analysts view this growth block as consistent and demand-driven, underpinned by the appeal of naturally derived formulations. The block curve signals mid-term resilience and adaptability as consumer and industrial uses expand globally. By 2030, the sector reaches 29.1 billion, adding nearly USD 7 billion over the first half of the forecast period. This five-year block highlights dependable expansion, reinforced by product versatility in emulsification, foaming, and dispersing functions.
Industry observers argue that natural surfactants are being positioned as reliable performance additives that enhance formulations without compromising efficiency. The growth block also points toward strategic opportunities for suppliers investing in expanded production capacity and regional distribution. Overall, the first half of the projection confirms that natural surfactants will remain integral in consumer products and industrial solutions, sustaining long-term market relevance.
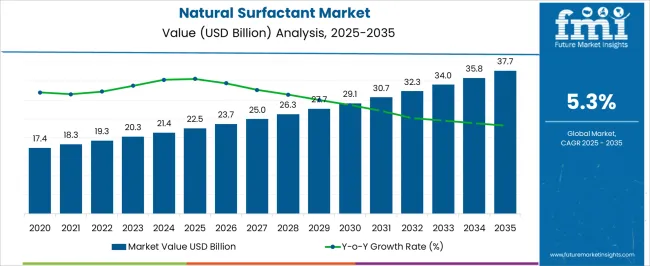
| Metric | Value |
|---|---|
| Natural Surfactant Market Estimated Value in (2025 E) | USD 22.5 billion |
| Natural Surfactant Market Forecast Value in (2035 F) | USD 37.7 billion |
| Forecast CAGR (2025 to 2035) | 5.3% |
The natural surfactant segment is estimated to contribute nearly 18% of the surfactants market, about 15% of the detergent chemicals market, close to 12% of the personal care ingredients market, nearly 14% of the household cleaning products market, and around 10% of the industrial and institutional cleaning chemicals market. Collectively, this amounts to an aggregated share of approximately 69% across its parent categories. This proportion highlights the strategic role natural surfactants hold as formulators look for ingredients that balance performance, safety, and environmental compatibility. Their value has been reinforced by applications in shampoos, body washes, laundry detergents, dishwashing liquids, and surface cleaners, where mildness, foaming, and biodegradability are decisive factors.
Analysts consider natural surfactants not only as substitutes for synthetic variants but also as a product class that adds differentiation for manufacturers aiming to capture evolving consumer preferences. Demand has been shaped by strong traction in personal care and household cleaning, which remain dominant avenues of adoption, while industrial applications continue to expand gradually. Their contribution has been amplified by consistent investment in feedstock diversification, ranging from plant oils to microbial fermentation sources, which strengthens supply resilience. As a result, natural surfactants are seen as a critical driver of innovation within their parent markets, occupying a central role in competitive positioning and product development strategies across the global cleaning and personal care industries.
The market is experiencing robust growth, driven by the increasing shift toward sustainable and bio-based chemical solutions across industries. Rising consumer awareness regarding the environmental and health impacts of synthetic surfactants is influencing adoption patterns, with natural alternatives gaining preference in personal care, household cleaning, and industrial applications.
Advancements in green chemistry and processing technologies are enabling higher efficiency and cost competitiveness of natural surfactants, further strengthening market penetration. Regulatory encouragement for biodegradable and non-toxic products, coupled with corporate commitments to sustainability goals, is providing a favorable policy and business environment.
Demand is also being fueled by the expansion of organic and eco-labeled product lines in retail markets, which rely heavily on natural surfactant formulations The outlook for the market remains positive, with innovation in multifunctional and performance-enhanced bio-based surfactants expected to create new growth opportunities in both developed and emerging regions.
The natural surfactant market is segmented by source, product, application, and geographic regions. By source, natural surfactant market is divided into plant based and animal based. In terms of product, natural surfactant market is classified into anionic surfactants, cationic surfactants, nonionic surfactants, and amphoteric Surfactants. Based on application, natural surfactant market is segmented into personal care, industrial and institutional cleaning, agriculture, pharmaceuticals, oilfield chemicals, and others. Regionally, the natural surfactant industry is classified into North America, Latin America, Western Europe, Eastern Europe, Balkan & Baltic Countries, Russia & Belarus, Central Asia, East Asia, South Asia & Pacific, and the Middle East & Africa.
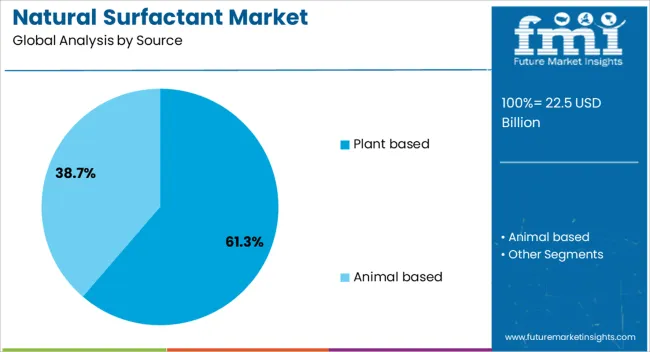
The plant based source segment is expected to hold 61.3% of the natural surfactant market revenue in 2025, making it the leading source category. This dominance is being attributed to the abundance and renewability of raw materials such as coconut, palm, and sugar derivatives, which provide consistent supply stability.
Growing consumer inclination toward products labeled as natural and plant derived has amplified demand in both personal and industrial applications. Production processes for plant based surfactants have seen significant advancements, enabling improved yield and reduced environmental impact, which aligns with sustainability targets of manufacturers.
The biodegradability and lower toxicity profile of plant based surfactants have also positioned them as the preferred option for formulators aiming to meet eco-labeling requirements This segment’s leadership is further supported by the ability to source raw materials from diversified geographies, ensuring resilience in the supply chain and supporting global scalability.
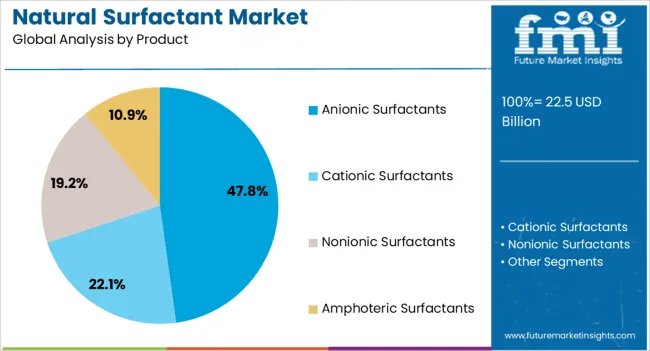
The anionic surfactants product segment is projected to capture 47.8% of the market revenue in 2025, securing its position as the largest product type. The segment’s strength is being driven by its high cleaning efficiency, excellent foaming properties, and compatibility with a wide range of formulations.
Anionic surfactants are extensively used in detergents, personal care products, and household cleaners, where performance and cost efficiency are critical. The natural variants of these surfactants offer similar functionality to their synthetic counterparts while providing biodegradability and reduced environmental impact.
Ongoing innovations in processing technologies have enhanced the stability, solubility, and application versatility of natural anionic surfactants, making them suitable for premium and eco-friendly formulations This segment’s continued growth is also supported by its ability to deliver consistent performance in diverse water conditions, which is valued by both industrial and consumer markets.
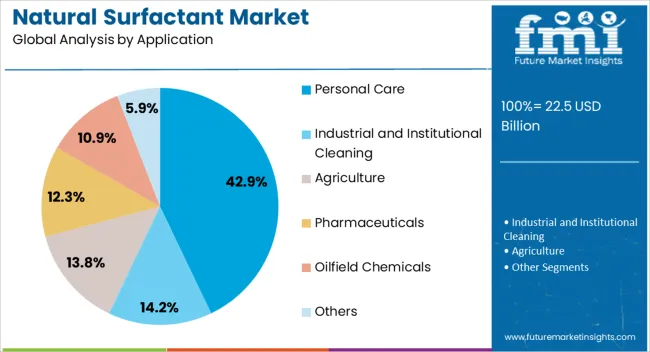
The personal care application segment is anticipated to account for 42.9% of the market revenue in 2025, making it the most significant application area. This leadership is being driven by growing demand for shampoos, body washes, facial cleansers, and other personal care products formulated with mild and skin-friendly ingredients.
Increasing consumer preference for sulfate free, natural, and plant derived formulations is fueling adoption in this segment. The compatibility of natural surfactants with sensitive skin and their ability to deliver effective cleansing without harshness has positioned them strongly in premium and organic product lines.
Rising disposable incomes and the expansion of the beauty and personal care industry in emerging economies are further contributing to segment growth The adaptability of natural surfactants in delivering desired sensory properties, such as foam quality and texture, while meeting regulatory and sustainability standards, ensures their sustained demand in the personal care market.
The natural surfactant market is projected to grow steadily, driven by rising adoption in personal care, home care, and food processing applications. Demand is reinforced by consumer preference for bio-based and mild formulations. Opportunities are opening in plant-derived surfactants, specialty blends, and expansion into pharmaceutical and agricultural uses. Trends highlight enzymatic production methods, multifunctional surfactants, and regional sourcing of raw materials. However, challenges such as higher production costs, inconsistent supply chains, and stringent regulatory frameworks continue to restrict broader commercialization and create pressure on small- and mid-scale producers.
Demand for natural surfactants has been reinforced by their increasing use in personal care and household cleaning products. Soaps, shampoos, and detergents are adopting bio-based surfactants due to their mildness, foaming ability, and biodegradability. Opinions suggest that consumer preference for naturally derived ingredients has made natural surfactants more desirable compared to synthetic alternatives. Food and beverage processing has also leaned on these compounds for emulsification and stabilization, further expanding demand. Pharmaceutical applications in drug solubilization and controlled release are creating additional pull for high-purity natural surfactants. Growth in emerging economies, where rising middle-class populations are opting for higher-quality products, has further boosted consumption. This consistent demand highlights that natural surfactants are no longer niche additives but critical ingredients shaping modern formulations across multiple industries where performance and natural sourcing intersect.
Opportunities in the natural surfactant market are being shaped by plant-based raw materials, specialty blends, and diversified end uses. Surfactants derived from sugar, coconut, and corn have gained traction as suppliers look for renewable feedstocks. Specialty blends designed for personal care, pharmaceuticals, and food processing create opportunities for differentiation in competitive markets. Opinions indicate that agricultural applications such as bio-based wetting agents and adjuvants represent an emerging growth area. Expansion in enzymatic production processes is also unlocking opportunities to scale manufacturing while maintaining quality. Suppliers entering into partnerships with cosmetic and food brands can further capture market share by co-developing tailored surfactant formulations. These opportunities suggest that players who invest in differentiated plant-based offerings and collaborate with downstream industries are best positioned to secure long-term growth in this evolving market.
Trends in the natural surfactant market emphasize enzymatic processes, multifunctionality, and regional sourcing strategies. Enzyme-based production methods are trending as manufacturers seek scalable and efficient ways to produce consistent surfactants with lower environmental impact. Multifunctional surfactants that combine foaming, emulsifying, and antimicrobial properties are gaining traction, particularly in personal care and cleaning products. Opinions suggest that regional sourcing of raw materials such as sugarcane, corn, and coconut is becoming a trend as companies reduce supply risks and highlight traceability. Interest in botanical extracts and fermentation-derived surfactants is also rising. Digital retail channels have accelerated the trend, providing consumers with access to a broader range of natural surfactant-based products. These shifts highlight a market where innovation, multifunctionality, and regional integration are defining growth patterns and reinforcing the prominence of natural surfactants.
Challenges in the natural surfactant market revolve around high production costs, raw material availability, and regulatory scrutiny. Production of natural surfactants often requires specialized processes and high-quality feedstocks, leading to higher prices compared with synthetic counterparts. Supply chain instability for crops such as coconut and palm creates cost fluctuations and availability risks. Opinions stress that regulatory compliance concerning labeling, safety, and performance claims adds complexity for manufacturers seeking global reach. Small and mid-sized firms face barriers due to the high cost of certifications and testing. Competition from established synthetic surfactants, which offer cost advantages, remains a significant hurdle. These challenges underline why the natural surfactant industry, despite clear demand drivers, faces structural limitations. To overcome these, companies must focus on scaling efficiency, stabilizing supply chains, and differentiating through performance attributes.
| Countries | CAGR |
|---|---|
| China | 7.2% |
| India | 6.6% |
| Germany | 6.1% |
| France | 5.6% |
| UK | 5.0% |
| USA | 4.5% |
| Brazil | 4.0% |
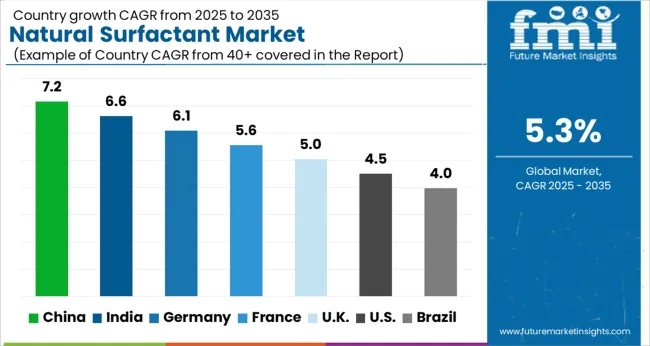
The global natural surfactant market is projected to expand at a CAGR of 5.3% from 2025 to 2035. China leads with a growth rate of 7.2%, followed by India at 6.6% and France at 5.6%. The United Kingdom is forecast to grow at 5.0%, while the United States records the slowest growth at 4.5%. Rising demand for bio based formulations in personal care, household cleaning, and agrochemicals is reshaping market dynamics. Asia shows stronger growth due to large scale production, domestic consumption, and supportive government policies. Europe emphasizes high quality and compliance with safety regulations, while the USA maintains steady adoption in niche categories such as premium personal care and green cleaning products. This report includes insights on 40+ countries; the top markets are highlighted for reference.
The natural surfactant market in China is projected to grow at a CAGR of 7.2%. Expansion is driven by large scale production capacity, growing demand in personal care and household cleaning products, and government initiatives promoting greener formulations. Domestic producers strengthen global supply chains by exporting cost competitive bio based surfactants. Rising consumer preference for plant derived ingredients reinforces steady growth in the home and personal care sectors. China’s scale and regulatory push position it as the leading contributor to global expansion.
The natural surfactant market in India is expected to expand at a CAGR of 6.6%. Demand is underpinned by growing consumption of personal care products, rising household cleaning penetration, and agricultural applications. Domestic manufacturers are scaling up bio based production to reduce dependence on imports. Expansion of FMCG companies across rural and urban areas enhances distribution of products containing natural surfactants. Government incentives for bio based chemicals further support adoption in multiple sectors, making India one of the fastest growing markets in Asia.
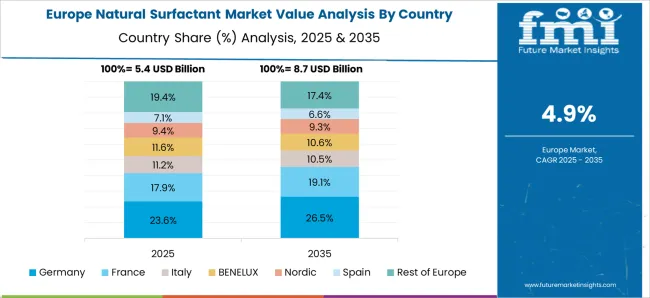
The natural surfactant market in France is projected to grow at a CAGR of 5.6%. Expansion is influenced by strong consumer preference for eco labeled products and compliance with EU chemical safety regulations. Personal care and cosmetics companies emphasize natural formulations, boosting demand for bio based surfactants. Household cleaning products featuring plant derived ingredients gain wider adoption, reinforcing premium positioning. French producers also focus on innovation in mild and high performance surfactants, strengthening their role in European and global markets.
The natural surfactant market in the UK is expected to expand at a CAGR of 5.0%. Demand is supported by growing consumer preference for plant based home and personal care products. Retail chains emphasize eco friendly cleaning and cosmetic brands, strengthening visibility and adoption. Import reliance continues, with global suppliers meeting part of the domestic demand for natural surfactants. Innovation in green formulations, combined with a strong emphasis on quality certification, drives steady growth. While moderate, adoption is consistent as brands cater to eco conscious consumers.
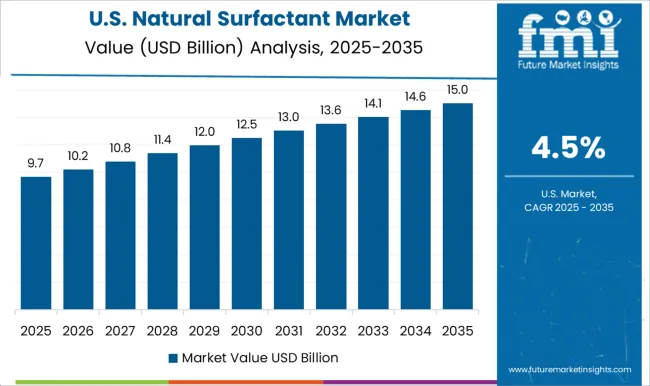
The natural surfactant market in the US is forecast to grow at a CAGR of 4.5%. Growth is slower compared to Asia and Europe, reflecting a mature cleaning and personal care sector. However, niche adoption in premium cosmetics, organic household products, and green cleaning categories sustains momentum. Domestic producers focus on specialized formulations with higher margins, including mild surfactants for sensitive skin applications. Market expansion is also influenced by consumer awareness of plant derived alternatives and steady innovation in product differentiation.
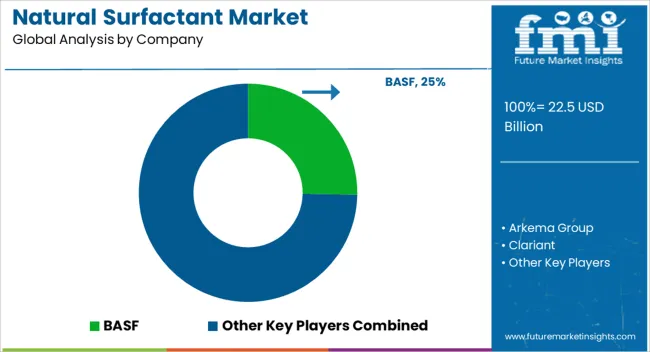
Competition in natural surfactants has been defined by how persuasively companies position plant-derived and bio-based solutions in brochures that balance performance with eco-compliance. BASF and Dow promote broad portfolios with brochures that emphasize mildness, biodegradability, and compatibility across home care, personal care, and agrochemical formulations. Croda International and Clariant highlight value-added surfactants in catalogues that stress emulsification, foaming, and solubilization properties, while presenting lifecycle data and certification marks.
Evonik Industries positions brochures around green chemistry frameworks, showcasing natural feedstocks and multifunctional surfactants tailored for skin feel and cleaning efficiency. Arkema and SEPPIC underline specialty emulsifiers and biosurfactants in brochures that spotlight purity, formulation flexibility, and safety profiles. Stepan Company pushes its NPE-free surfactant brochures that detail performance in detergents and industrial cleaners. Kao Corporation promotes mild cleansing surfactants for personal care, stressing brochures rich with dermatological validation. WHEATOLEO differentiates with brochures focused on wheat-derived surfactants, highlighting renewable origin and performance metrics side by side. Strategy across the sector has been straightforward: prove function and compliance through brochure detail. Buyers look first at cloud point, active matter %, foam stability, and biodegradability tables to compare suppliers.
Companies gain edge when brochures combine regulatory notes such as REACH and COSMOS with application examples in skin care, agrochemicals, and institutional cleaning. Innovative Chemical Technologies and smaller players compete by publishing niche brochures on tailored blends, offering visuals of improved cleaning power or sensory performance. Competitive advantage is secured by condensing complex chemistry into clear charts that reduce R&D trial time. Success depends less on branding and more on brochure clarity, where buyers can see performance data, compliance seals, and formulation examples. In this market, the product brochure serves as both sales pitch and scientific validation, ensuring decisions rest on documented evidence of natural origin and functional reliability.
| Item | Value |
|---|---|
| Quantitative Units | USD 22.5 billion |
| Source | Plant based and Animal based |
| Product | Anionic Surfactants, Cationic Surfactants, Nonionic Surfactants, and Amphoteric Surfactants |
| Application | Personal Care, Industrial and Institutional Cleaning, Agriculture, Pharmaceuticals, Oilfield Chemicals, and Others |
| Regions Covered | North America, Europe, Asia-Pacific, Latin America, Middle East & Africa |
| Country Covered | United States, Canada, Germany, France, United Kingdom, China, Japan, India, Brazil, South Africa |
| Key Companies Profiled | BASF, Arkema Group, Clariant, Croda International, Evonik Industries, Innovative Chemical Technologies, Kao Corporation, SEPPIC, Stepan Company, The Dow Chemical Company, and WHEATOLEO |
| Additional Attributes | Dollar sales by product type (glycolipids, phospholipids, alkyl polyglucosides, sorbitan esters), Dollar sales by application (personal care, household cleaning, agrochemicals, food processing, industrial uses), Trends in bio-based and plant-derived surfactant adoption, Role of natural surfactants in improving biodegradability and reducing chemical load, Growth in demand for mild and multifunctional ingredients in formulations, Regional consumption trends across North America, Europe, and Asia Pacific. |
The global natural surfactant market is estimated to be valued at USD 22.5 billion in 2025.
The market size for the natural surfactant market is projected to reach USD 37.7 billion by 2035.
The natural surfactant market is expected to grow at a 5.3% CAGR between 2025 and 2035.
The key product types in natural surfactant market are plant based and animal based.
In terms of product, anionic surfactants segment to command 47.8% share in the natural surfactant market in 2025.


Full Research Suite comprises of:
Market outlook & trends analysis
Interviews & case studies
Strategic recommendations
Vendor profiles & capabilities analysis
5-year forecasts
8 regions and 60+ country-level data splits
Market segment data splits
12 months of continuous data updates
DELIVERED AS:
PDF EXCEL ONLINE
Natural Antioxidant Market Size and Share Forecast Outlook 2025 to 2035
Natural Disaster Detection IoT Market Forecast Outlook 2025 to 2035
Natural Cosmetic Color Market Size and Share Forecast Outlook 2025 to 2035
Natural Food Preservatives Market Size and Share Forecast Outlook 2025 to 2035
Natural Polymer Market Size and Share Forecast Outlook 2025 to 2035
Natural Gas Analyzers Market Size and Share Forecast Outlook 2025 to 2035
Natural Mineral Oil Coolant Market Size and Share Forecast Outlook 2025 to 2035
Natural Synthetic Cytokinin (Anti-zeatin Riboside) Market Size and Share Forecast Outlook 2025 to 2035
Natural Food Flavors Market Size and Share Forecast Outlook 2025 to 2035
Natural Silicone Alternative Market Analysis - Size and Share Forecast Outlook 2025 to 2035
Natural Skincare Preservatives Market Analysis - Size and Share Forecast Outlook 2025 to 2035
Natural Bitterness Blockers Market Analysis - Size And Share Forecast Outlook 2025 To 2035
Naturally Fermented Food Market Size and Share Forecast Outlook 2025 to 2035
Natural Refrigerants Market Size and Share Forecast Outlook 2025 to 2035
Natural Ferulic Acid Market Size and Share Forecast Outlook 2025 to 2035
Natural Vitamin E Product Market Size and Share Forecast Outlook 2025 to 2035
Natural Oil Polyols NOP Market Size and Share Forecast Outlook 2025 to 2035
Natural Rubber Market Size and Share Forecast Outlook 2025 to 2035
Natural Language Processing in Finance Market Size and Share Forecast Outlook 2025 to 2035
Naturally Derived Fatty Alcohol Market Size and Share Forecast Outlook 2025 to 2035

Thank you!
You will receive an email from our Business Development Manager. Please be sure to check your SPAM/JUNK folder too.
Chat With
MaRIA