Acetylated Starch Market Size and Share Forecast Outlook 2025 to 2035

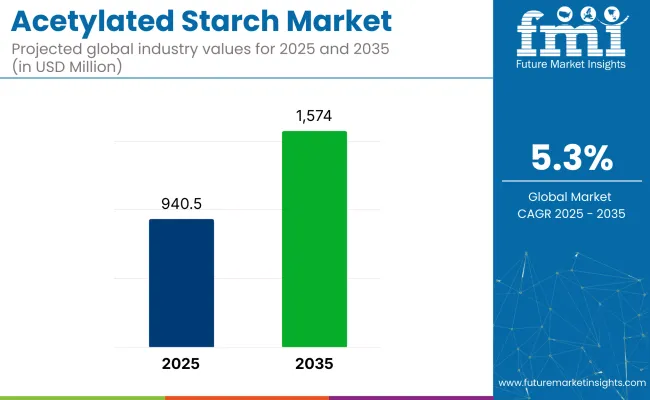
The acetylated starch market is set to be valued at USD 940.5 million in 2025. Demand is projected to grow at a valuation of USD 1,574 million by 2035 at a CAGR of 5.3%. The industry is set to grow steadily, driven by its increasing use in pharmaceuticals, food and beverage, and dietary supplements.
Quick Stats for the Acetylated Starch Market

  • Market Value (2025): USD 940.5 million
  • Forecast Value (2035): USD 1,574 million
  • Forecast CAGR: 5.3%
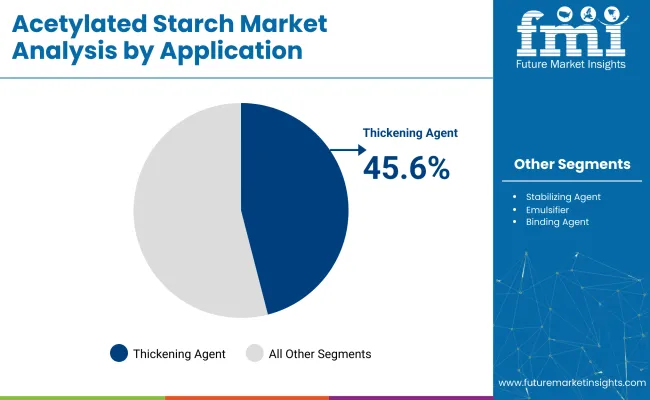
  • Leading Segment in 2025: Thickening Agent (45.6% share)
  • Key Growth Region: South Asia (India)
  • Top Key Players: Banpong Tapioca Flour Industrial Co Ltd, V Delta Co., Ltd., Visco Starch, Asia Fructose Co., Ltd., Chai Prasit Products Co., Ltd.

Acetylated Starch Market

Metric Value
Market Size in 2025 USD 940.5 million
Projected Market Size in 2035 USD 1,574 million
CAGR (2025 to 2035) 5.3%

As a thickening agent, acetylated starch plays a critical role in improving texture and consistency in food products. The growing demand for natural, plant-based alternatives has accelerated its adoption.

Acetylated starch is also used in binding, emulsifying, and stabilizing products, which further boosts its demand in functional food and pharmaceutical applications. The industry is expected to expand significantly in regions like India, China, and the USA as industries prioritize better food quality and pharmaceutical formulations.

The industry holds a niche but significant share within its parent markets. In the starch market, acetylated starch accounts for approximately 5-7%, as it is a modified form of starch with specialized applications. Within the food and beverage additives market, its share is around 2-3%, primarily used as a thickener, stabilizer, and emulsifier in processed foods.

In the biodegradable polymers market, acetylated starch contributes approximately 1-2%, as it plays a role in developing eco-friendly plastics. In the pharmaceutical excipients market, its share is about 1%, used mainly in tablets and drug formulations as a binder. In the cosmetics and personal care market, acetylated starch represents around 3-5%, added for its texturizing and stabilizing properties in creams, powders, and lotions.

Analyzing Acetylated Starch Market by Top Investment Segments

The market is segmented by application into thickening agent, stabilizing agent, emulsifier, binding agent, and gelling agent. It is segmented by end-use into pharmaceuticals, food and beverages, dietary supplements, textile, paper, and other industries. Industry analysis has been carried out in North America, Latin America, Eastern Europe, Western Europe, East Asia, South Asia & Pacific, Central Asia, Balkan and Baltic countries, Russia & Belarus, and Middle East & Africa.

Thickening Agent to Lead with 45.6% Market Share in 2025

The thickening agent segment is expected to hold 45.6% of the acetylated starch market share in 2025. Its dominance is attributed to the wide use of acetylated starch in improving texture and maintaining consistency in processed foods. Applications in soups, sauces, gravies, and dairy-based items contribute to its high usage.

The rising consumption of ready-to-eat and packaged meals has further driven the need for stable thickening solutions across food manufacturing. The food industry’s focus on shelf-life stability and mouthfeel has reinforced the segment’s strong position.
  • Demand for thickening agents rises due to their role in texture improvement across a broad range of processed food products.
  • Acetylated starch is used widely to stabilize viscosity and consistency in beverages and prepared meals.
  • Increased consumption of convenience and microwaveable foods is accelerating demand for this functional starch derivative.

Acetylated Starch Market Analysis By Application

Pharmaceuticals to Lead with 38.9% Market Share in 2025

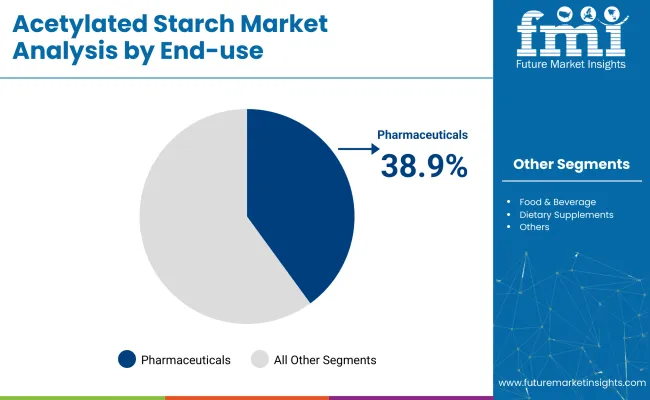
The pharmaceutical sector is expected to account for 38.9% of the acetylated starch market in 2025. Its use in tablet and capsule manufacturing stems from its reliable binding and stabilizing properties. Acetylated starch enhances both the physical structure and release performance of pharmaceutical products, making it an essential excipient.

The growing demand for health supplements and over-the-counter medications-especially in BRICS and ASEAN nations-is contributing to its wider adoption. As global healthcare needs expand, acetylated starch will remain critical in formulation development and production efficiency.
  • Acetylated starch enables consistent texture, stability, and compressibility in tablets and powdered drug formats.
  • Health supplements and functional medicines rely on acetylated starch for better bioavailability and shelf stability.
  • Growing healthcare investment in emerging markets fuels continued demand from the pharmaceutical manufacturing sector.

Acetylated Starch Market Analysis By End Use

Top Acetylated Starch Market Dynamics

Acetylated starch demand is rising due to its use in plant-based foods and pharma-friendly formulations like pediatric syrups. Brands like Nestlé and Cipla have adopted it for stability and texture. However, price and supply volatility from weather-affected crops like corn and tapioca remains a key production challenge.

Increasing Demand for Functional Food Ingredients and Processed Foods

Acetylated starch is gaining popularity for its ability to function as a thickening agent, stabilizer, and emulsifier, catering to the consumer desire for convenience, long-lasting food products. Processed food consumption continues to rise, particularly in emerging markets like India and China, where evolving consumer preferences are creating demand for more convenient food options. With a growing shift toward health-conscious diets, acetylated starch is being integrated into a broader array of products, accelerating market expansion.

  • Acetylated starch is increasingly used for stabilizing, thickening, and emulsifying processed foods.
  • Changing dietary habits in markets like India and China are driving processed food demand.
  • Health-conscious consumer trends are expanding acetylated starch’s application across various food products.

Supply Chain Constraints and High Production Costs

The sourcing of essential raw materials such as corn and cassava is vulnerable to climate change and other environmental factors, contributing to price instability and supply chain interruptions. The intricate processes involved in acetylating starch further increase production costs.

These challenges may hinder the scalability of the industry, particularly in price-sensitive regions. Manufacturers must address these challenges to ensure steady and sustainable market growth in the face of rising production complexities and fluctuating raw material prices.
  • Environmental factors and climate change disrupt the supply of corn and cassava, key raw materials.
  • The production process for acetylated starch is complex, raising costs and affecting pricing stability.
  • Price volatility and supply chain constraints may slow down market growth, especially in emerging economies.

Analyzing Top Countries Manufacturing, Distributing, and Supplying Acetylated Starch

Country Wise Analysis Of Acetylated Starch Market

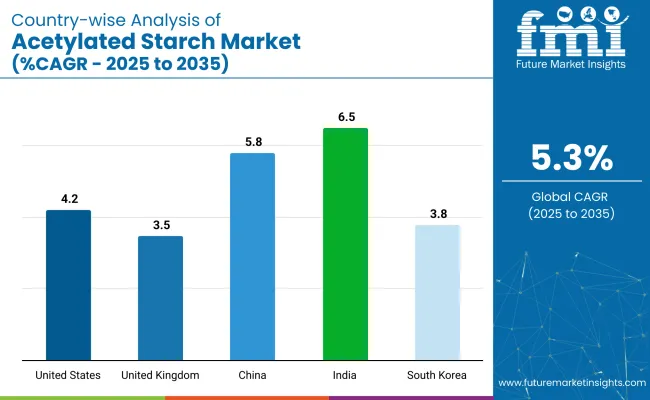
Countries CAGR (2025 to 2035)
United States 4.2%
United Kingdom 3.5%
China 5.8%
India 6.5%
South Korea 3.8%

The acetylated starch market is set to grow at a global CAGR of 5.3% through 2035, with BRICS and ASEAN economies shaping the future landscape. India, at 6.5%, leads global growth, backed by expanding use in processed foods, tablet manufacturing, and starch derivatives.

China, at 5.8%, also shows strong growth, with demand driven by food, paper, and biodegradable packaging sectors. Among OECD countries, Japan (4.9%) stands out for its use of acetylated starch in clean-label and plant-based applications, alongside growth in bioplastics.

Germany (4.5%) benefits from a robust industrial base, with widespread use across food and technical formulations. The USA market (4.2%) remains steady, driven by long-established demand in food and pharma. The fastest-growing opportunities now lie in BRICS and ASEAN countries, where industrialization, evolving diets, and localized production are reshaping the supply and demand dynamics of acetylated starch.

Analysis of Acetylated Starch Market in the United States

The United States acetylated starch market is expected to grow at a CAGR of 4.2% from 2025 to 2035. As part of the OECD group, the country continues to show steady growth, supported by its advanced food processing infrastructure and a large consumer base.

Acetylated starch is widely used as a stabilizer and thickening agent in processed foods, ready-to-drink beverages, and sauces. The pharmaceutical sector also contributes to demand through its use in tablet coatings and powdered formulations. The shift toward health-conscious eating and the rising preference for clean-label ingredients have further enhanced demand across retail and institutional channels.

  • Processed food and beverage applications remain a key growth engine in the USA market.
  • Dietary supplements and pharma-grade formulations are expanding the ingredient’s end-use scope.
  • Clean-label and natural product trends are accelerating the adoption of modified starches.

Demand Forecast for Acetylated Starch Market in the United Kingdom

The United Kingdom is expected to grow at a CAGR of 3.5% in the industry. The demand for natural and functional ingredients in food products is increasing as consumers prioritize health-conscious diets and convenient food options.

Acetylated starch is being widely used in the food and beverage sector, especially in sauces, dairy products, and baked goods, to enhance texture and consistency. The UK ’s stringent food regulations and high demand for clean label ingredients further support the market's expansion.

  • Health-conscious trends and demand for functional foods fuel the market growth in the UK
  • The food industry in the UK increasingly adopts natural ingredients like acetylated starch.
  • The UK market benefits from stringent food safety regulations and demand for quality ingredients.

Growth Analysis of Acetylated Starch Market in China

China is expected to grow at a CAGR of 5.8% in the industry. With a rising middle class and increasing demand for processed foods, China is one of the fastest-growing markets for acetylated starch. Consumers are shifting towards convenience foods and health-focused ingredients, driving the demand for functional food additives like acetylated starch. The food and beverage, pharmaceutical, and dietary supplement industries are all expected to contribute to growth in the Chinese market.

  • China’s growing middle class and increasing demand for processed foods are key drivers.
  • Health-conscious eating habits boost demand for functional food ingredients.
  • The expansion of e-commerce platforms increases accessibility to acetylated starch-based products.

Future Outlook for Acetylated Starch Market in India

India is projected to grow at the fastest rate in the industry, with a CAGR of 6.5%. The rise in the increasing demand for processed foods and dietary supplements is driving the market. India’s growing urban population and adoption of westernized eating habits are contributing to the demand for convenience foods that rely on functional ingredients like acetylated starch. The increasing awareness about the benefits of natural and organic products is likely to further propel market growth in India.

  • Increasing consumer spending and changing lifestyles in India are driving the demand for processed foods.
  • Increasing preference for functional food ingredients like acetylated starch supports market growth.
  • The growth of e-commerce in India facilitates the availability of acetylated starch products.

Acetylated Starch Market Growth Outlook in South Korea

South Korea is projected to grow at a CAGR of 3.8% in the industry. The increasing demand for processed foods and dietary supplements, coupled with a strong interest in health-conscious eating, is driving market expansion.

Acetylated starch is widely used as a stabilizer and emulsifier in the food industry, especially in beverages, baked goods, and dairy products. South Korea’s well-developed food processing industry and the growing demand for clean label ingredients further support the market growth.
  • South Korea’s preference for health-conscious eating fuels the demand for functional food ingredients.
  • Acetylated starch is gaining popularity in processed food and dietary supplements.
  • The country’s well-established food industry and focus on clean labels enhance market prospects.

Leading Acetylated Starch Market Suppliers

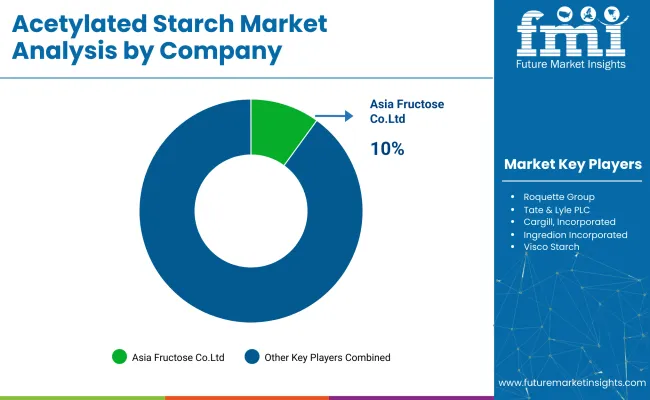
Acetylated Starch Market By Company

The global industry features a competitive landscape with dominant players, key players, and emerging players. Dominant players such as Asia Fructose Co., Ltd., Banpong Tapioca Flour Industrial Co., Ltd., and V Delta Co., Ltd. lead the market with extensive product portfolios, strong R&D capabilities, and robust distribution networks across food, beverage, pharmaceutical, and industrial sectors.

Key players including Visco Starch, Chai Prasit Products Co., Ltd., and Roquette Group offer specialized formulations tailored to specific applications and regional markets. Emerging players, such as Tate & Lyle PLC, Cargill, Incorporated, and Ingredion Incorporated, focus on innovative extraction technologies and cost-effective solutions, expanding their presence in the global market.

Key Players of the Market

  • Banpong Tapioca Flour Industrial Co Ltd
  • V Delta Co., Ltd.
  • Visco Starch
  • Asia Fructose Co., Ltd.
  • Chai Prasit Products Co., Ltd.
  • Roquette Group
  • Tate & Lyle PLC
  • Cargill, Incorporated
  • Ingredion Incorporated
  • Archer Daniels Midland Company (ADM)

Report Scope

Report Attributes Details
Estimated Market Size (2025E) USD 940.5 million
Projected Market Value (2035F) USD 1,574 million
Value-based CAGR (2025-2035) 5.3%
Base Year for Estimation 2024
Historical Period 2020 to 2024
Projections Period 2025 to 2035
Quantitative Units USD million for value and thousand tons for volume
Application Segmentation Thickening Agent, Stabilizing Agent, Emulsifier, Binding Agent, Gelling Agent
End-use Segmentation Pharmaceuticals, Food and Beverage, Dietary Supplements, Pharmaceuticals, Textile, Paper, Others
Regions Covered North America, Latin America, Eastern Europe, Western Europe, East Asia, South Asia & Pacific, Central Asia, Balkan and Baltic Countries, Russia & Belarus, Middle East & Africa
Countries Covered United States, Canada, Mexico, Brazil, Argentina, Germany, France, United Kingdom, Italy, Spain, Netherlands, China, India, Japan, South Korea, Australia, New Zealand, GCC Countries, South Africa
Key Players Influencing the Market Banpong Tapioca Flour Industrial Co Ltd, V Delta Co., Ltd., Visco Starch, Asia Fructose Co., Ltd., Chai Prasit Products Co., Ltd., Roquette Group, Tate & Lyle PLC, Cargill, Incorporated, Ingredion Incorporated, Archer Daniels Midland Company (ADM)
Additional Attributes Dollar sales by application type, end-use, and region, increasing demand for acetylated starch in food and pharmaceuticals, growing use in emulsifiers and stabilizers, rising adoption in textile and paper industries, regional trends in starch sourcing and production.

Acetylated Starch Market Analyzed by Key Investment Segments

By Application:

The market is segmented into Thickening Agent, Stabilizing Agent, Emulsifier, Binding Agent, and Gelling Agent.

By End-Use:

The market is segmented into Pharmaceuticals, Food and Beverages, Dietary Supplements, Textile, Paper, and Other Industries.

By Region:

Industry analysis has been carried out in North America, Latin America, Eastern Europe, Western Europe, East Asia, South Asia & Pacific, Central Asia, Balkan and Baltic Countries, Russia & Belarus, and Middle East & Africa.

Table of Content

  1. Executive Summary
    • Global Market Outlook
    • Demand-side Trends
    • Supply-side Trends
    • Technology Roadmap Analysis
    • Analysis and Recommendations
  2. Market Overview
    • Market Coverage / Taxonomy
    • Market Definition / Scope / Limitations
  3. Market Background
    • Market Dynamics
      • Drivers
      • Restraints
      • Opportunity
      • Trends
    • Scenario Forecast
      • Demand in Optimistic Scenario
      • Demand in Likely Scenario
      • Demand in Conservative Scenario
    • Opportunity Map Analysis
    • Product Life Cycle Analysis
    • Supply Chain Analysis
      • Supply Side Participants and their Roles
        • Producers
        • Mid-Level Participants (Traders/ Agents/ Brokers)
        • Wholesalers and Distributors
      • Value Added and Value Created at Node in the Supply Chain
      • List of Raw Material Suppliers
      • List of Existing and Potential Buyer’s
    • Investment Feasibility Matrix
    • Value Chain Analysis
      • Profit Margin Analysis
      • Wholesalers and Distributors
      • Retailers
    • PESTLE and Porter’s Analysis
    • Regulatory Landscape
      • By Key Regions
      • By Key Countries
    • Regional Parent Market Outlook
    • Production and Consumption Statistics
    • Import and Export Statistics
  4. Global Market Analysis 2020-2024 and Forecast, 2025-2035
    • Historical Market Size Value (USD Million) & Volume (Thousand Tons) Analysis, 2020-2024
    • Current and Future Market Size Value (USD Million) & Volume (Thousand Tons) Projections, 2025-2035
      • Y-o-Y Growth Trend Analysis
      • Absolute $ Opportunity Analysis
  5. Global Market Pricing Analysis 2020-2024 and Forecast 2025-2035
  6. Global Market Analysis 2020-2024 and Forecast 2025-2035, By Application
    • Introduction / Key Findings
    • Historical Market Size Value (USD Million) & Volume (Thousand Tons) Analysis By Application, 2020-2024
    • Current and Future Market Size Value (USD Million) & Volume (Thousand Tons) Analysis and Forecast By Application, 2025-2035
      • Thickening Agent
      • Stabilizing Agent
      • Emulsifier
      • Binding Agent
      • Gelling Agent
    • Y-o-Y Growth Trend Analysis By Application, 2020-2024
    • Absolute $ Opportunity Analysis By Application, 2025-2035
  7. Global Market Analysis 2020-2024 and Forecast 2025-2035, By End-Use
    • Introduction / Key Findings
    • Historical Market Size Value (USD Million) & Volume (Thousand Tons) Analysis By End-Use, 2020-2024
    • Current and Future Market Size Value (USD Million) & Volume (Thousand Tons) Analysis and Forecast By End-Use, 2025-2035
      • Pharmaceuticals
      • Food and Beverages
      • Dietary Supplements
      • Textile
      • Paper
      • Other Industries
    • Y-o-Y Growth Trend Analysis By End-Use, 2020-2024
    • Absolute $ Opportunity Analysis By End-Use, 2025-2035
  8. Global Market Analysis 2020-2024 and Forecast 2025-2035, By Region
    • Introduction
    • Historical Market Size Value (USD Million) & Volume (Thousand Tons) Analysis By Region, 2020-2024
    • Current Market Size Value (USD Million) & Volume (Thousand Tons) Analysis and Forecast By Region, 2025-2035
      • North America
      • Latin America
      • Western Europe
      • Eastern Europe
      • East Asia
      • South Asia & Pacific
      • Middle East and Africa
    • Market Attractiveness Analysis By Region
  9. North America Market Analysis 2020-2024 and Forecast 2025-2035, By Country
    • Historical Market Size Value (USD Million) & Volume (Thousand Tons) Trend Analysis By Market Taxonomy, 2020-2024
    • Market Size Value (USD Million) & Volume (Thousand Tons) Forecast By Market Taxonomy, 2025-2035
      • By Country
        • USA
        • Canada
        • Mexico
      • By Application
      • By End-Use
    • Market Attractiveness Analysis
      • By Country
      • By Application
      • By End-Use
    • Key Takeaways
  10. Latin America Market Analysis 2020-2024 and Forecast 2025-2035, By Country
    • Historical Market Size Value (USD Million) & Volume (Thousand Tons) Trend Analysis By Market Taxonomy, 2020-2024
    • Market Size Value (USD Million) & Volume (Thousand Tons) Forecast By Market Taxonomy, 2025-2035
      • By Country
        • Brazil
        • Argentina
        • Rest of LATAM
      • By Application
      • By End-Use
    • Market Attractiveness Analysis
      • By Country
      • By Application
      • By End-Use
    • Key Takeaways
  11. Western Europe Market Analysis 2020-2024 and Forecast 2025-2035, By Country
    • Historical Market Size Value (USD Million) & Volume (Thousand Tons) Trend Analysis By Market Taxonomy, 2020-2024
    • Market Size Value (USD Million) & Volume (Thousand Tons) Forecast By Market Taxonomy, 2025-2035
      • By Country
        • Germany
        • Italy
        • France
        • UK
        • Spain
        • BENELUX
        • Nordic
        • Rest of W.Europe
      • By Application
      • By End-Use
    • Market Attractiveness Analysis
      • By Country
      • By Application
      • By End-Use
    • Key Takeaways
  12. Eastern Europe Market Analysis 2020-2024 and Forecast 2025-2035, By Country
    • Historical Market Size Value (USD Million) & Volume (Thousand Tons) Trend Analysis By Market Taxonomy, 2020-2024
    • Market Size Value (USD Million) & Volume (Thousand Tons) Forecast By Market Taxonomy, 2025-2035
      • By Country
        • Russia
        • Hungary
        • Poland
        • Balkan & Baltics
        • Rest of E. Europe
      • By Application
      • By End-Use
    • Market Attractiveness Analysis
      • By Country
      • By Application
      • By End-Use
    • Key Takeaways
  13. East Asia Market Analysis 2020-2024 and Forecast 2025-2035, By Country
    • Historical Market Size Value (USD Million) & Volume (Thousand Tons) Trend Analysis By Market Taxonomy, 2020-2024
    • Market Size Value (USD Million) & Volume (Thousand Tons) Forecast By Market Taxonomy, 2025-2035
      • By Country
        • China
        • Japan
        • South Korea
      • By Application
      • By End-Use
    • Market Attractiveness Analysis
      • By Country
      • By Application
      • By End-Use
    • Key Takeaways
  14. South Asia & Pacific Market Analysis 2020-2024 and Forecast 2025-2035, By Country
    • Historical Market Size Value (USD Million) & Volume (Thousand Tons) Trend Analysis By Market Taxonomy, 2020-2024
    • Market Size Value (USD Million) & Volume (Thousand Tons) Forecast By Market Taxonomy, 2025-2035
      • By Country
        • India
        • Australia & New Zealand
        • ASEAN
        • Rest of SAP
      • By Application
      • By End-Use
    • Market Attractiveness Analysis
      • By Country
      • By Application
      • By End-Use
    • Key Takeaways
  15. Middle East and Africa Market Analysis 2020-2024 and Forecast 2025-2035, By Country
    • Historical Market Size Value (USD Million) & Volume (Thousand Tons) Trend Analysis By Market Taxonomy, 2020-2024
    • Market Size Value (USD Million) & Volume (Thousand Tons) Forecast By Market Taxonomy, 2025-2035
      • By Country
        • GCC Countries
        • Northern Africa
        • South Africa
        • Turkiye
        • Rest of MEA
      • By Application
      • By End-Use
    • Market Attractiveness Analysis
      • By Country
      • By Application
      • By End-Use
    • Key Takeaways
  16. Key Countries Market Analysis
    • USA
      • Pricing Analysis
      • Market Share Analysis, 2024
        • By Application
        • By End-Use
    • Canada
      • Pricing Analysis
      • Market Share Analysis, 2024
        • By Application
        • By End-Use
    • Brazil
      • Pricing Analysis
      • Market Share Analysis, 2024
        • By Application
        • By End-Use
    • Mexico
      • Pricing Analysis
      • Market Share Analysis, 2024
        • By Application
        • By End-Use
    • Argentina
      • Pricing Analysis
      • Market Share Analysis, 2024
        • By Application
        • By End-Use
  17. Market Structure Analysis
    • Competition Dashboard
    • Competition Benchmarking
    • Market Share Analysis of Top Players
      • By Regional
      • By Application
      • By End-Use
  18. Competition Analysis
    • Competition Deep Dive
      • Banpong Tapioca Flour Industrial Co Ltd
        • Overview
        • Product Portfolio
        • Profitability by Market Segments (Product/Age /Sales Channel/Region)
        • Sales Footprint
        • Strategy Overview
          • Marketing Strategy
          • Product Strategy
          • Channel Strategy
      • V Delta Co., Ltd.
        • Overview
        • Product Portfolio
        • Profitability by Market Segments (Product/Age /Sales Channel/Region)
        • Sales Footprint
        • Strategy Overview
          • Marketing Strategy
          • Product Strategy
          • Channel Strategy
      • Visco Starch
        • Overview
        • Product Portfolio
        • Profitability by Market Segments (Product/Age /Sales Channel/Region)
        • Sales Footprint
        • Strategy Overview
          • Marketing Strategy
          • Product Strategy
          • Channel Strategy
      • Asia Fructose Co., Ltd.
        • Overview
        • Product Portfolio
        • Profitability by Market Segments (Product/Age /Sales Channel/Region)
        • Sales Footprint
        • Strategy Overview
          • Marketing Strategy
          • Product Strategy
          • Channel Strategy
      • Chai Prasit Products Co., Ltd.
        • Overview
        • Product Portfolio
        • Profitability by Market Segments (Product/Age /Sales Channel/Region)
        • Sales Footprint
        • Strategy Overview
          • Marketing Strategy
          • Product Strategy
          • Channel Strategy
      • Roquette Group
        • Overview
        • Product Portfolio
        • Profitability by Market Segments (Product/Age /Sales Channel/Region)
        • Sales Footprint
        • Strategy Overview
          • Marketing Strategy
          • Product Strategy
          • Channel Strategy
      • Tate & Lyle PLC
        • Overview
        • Product Portfolio
        • Profitability by Market Segments (Product/Age /Sales Channel/Region)
        • Sales Footprint
        • Strategy Overview
          • Marketing Strategy
          • Product Strategy
          • Channel Strategy
      • Cargill, Incorporated
        • Overview
        • Product Portfolio
        • Profitability by Market Segments (Product/Age /Sales Channel/Region)
        • Sales Footprint
        • Strategy Overview
          • Marketing Strategy
          • Product Strategy
          • Channel Strategy
      • Ingredion Incorporated
        • Overview
        • Product Portfolio
        • Profitability by Market Segments (Product/Age /Sales Channel/Region)
        • Sales Footprint
        • Strategy Overview
          • Marketing Strategy
          • Product Strategy
          • Channel Strategy
      • Archer Daniels Midland Company (ADM)
        • Overview
        • Product Portfolio
        • Profitability by Market Segments (Product/Age /Sales Channel/Region)
        • Sales Footprint
        • Strategy Overview
          • Marketing Strategy
          • Product Strategy
          • Channel Strategy
  19. Assumptions & Acronyms Used
  20. Research Methodology

List of Tables

  • Table 1: Global Market Value (USD Million) Forecast by Region, 2020-2035
  • Table 2: Global Market Volume (Thousand Tons) Forecast by Region, 2020-2035
  • Table 3: Global Market Value (USD Million) Forecast by Application, 2020-2035
  • Table 4: Global Market Volume (Thousand Tons) Forecast by Application, 2020-2035
  • Table 5: Global Market Value (USD Million) Forecast by End-Use, 2020-2035
  • Table 6: Global Market Volume (Thousand Tons) Forecast by End-Use, 2020-2035
  • Table 7: North America Market Value (USD Million) Forecast by Country, 2020-2035
  • Table 8: North America Market Volume (Thousand Tons) Forecast by Country, 2020-2035
  • Table 9: North America Market Value (USD Million) Forecast by Application, 2020-2035
  • Table 10: North America Market Volume (Thousand Tons) Forecast by Application, 2020-2035
  • Table 11: North America Market Value (USD Million) Forecast by End-Use, 2020-2035
  • Table 12: North America Market Volume (Thousand Tons) Forecast by End-Use, 2020-2035
  • Table 13: Latin America Market Value (USD Million) Forecast by Country, 2020-2035
  • Table 14: Latin America Market Volume (Thousand Tons) Forecast by Country, 2020-2035
  • Table 15: Latin America Market Value (USD Million) Forecast by Application, 2020-2035
  • Table 16: Latin America Market Volume (Thousand Tons) Forecast by Application, 2020-2035
  • Table 17: Latin America Market Value (USD Million) Forecast by End-Use, 2020-2035
  • Table 18: Latin America Market Volume (Thousand Tons) Forecast by End-Use, 2020-2035
  • Table 19: Western Europe Market Value (USD Million) Forecast by Country, 2020-2035
  • Table 20: Western Europe Market Volume (Thousand Tons) Forecast by Country, 2020-2035
  • Table 21: Western Europe Market Value (USD Million) Forecast by Application, 2020-2035
  • Table 22: Western Europe Market Volume (Thousand Tons) Forecast by Application, 2020-2035
  • Table 23: Western Europe Market Value (USD Million) Forecast by End-Use, 2020-2035
  • Table 24: Western Europe Market Volume (Thousand Tons) Forecast by End-Use, 2020-2035
  • Table 25: Eastern Europe Market Value (USD Million) Forecast by Country, 2020-2035
  • Table 26: Eastern Europe Market Volume (Thousand Tons) Forecast by Country, 2020-2035
  • Table 27: Eastern Europe Market Value (USD Million) Forecast by Application, 2020-2035
  • Table 28: Eastern Europe Market Volume (Thousand Tons) Forecast by Application, 2020-2035
  • Table 29: Eastern Europe Market Value (USD Million) Forecast by End-Use, 2020-2035
  • Table 30: Eastern Europe Market Volume (Thousand Tons) Forecast by End-Use, 2020-2035
  • Table 31: East Asia Market Value (USD Million) Forecast by Country, 2020-2035
  • Table 32: East Asia Market Volume (Thousand Tons) Forecast by Country, 2020-2035
  • Table 33: East Asia Market Value (USD Million) Forecast by Application, 2020-2035
  • Table 34: East Asia Market Volume (Thousand Tons) Forecast by Application, 2020-2035
  • Table 35: East Asia Market Value (USD Million) Forecast by End-Use, 2020-2035
  • Table 36: East Asia Market Volume (Thousand Tons) Forecast by End-Use, 2020-2035
  • Table 37: South Asia & Pacific Market Value (USD Million) Forecast by Country, 2020-2035
  • Table 38: South Asia & Pacific Market Volume (Thousand Tons) Forecast by Country, 2020-2035
  • Table 39: South Asia & Pacific Market Value (USD Million) Forecast by Application, 2020-2035
  • Table 40: South Asia & Pacific Market Volume (Thousand Tons) Forecast by Application, 2020-2035
  • Table 41: South Asia & Pacific Market Value (USD Million) Forecast by End-Use, 2020-2035
  • Table 42: South Asia & Pacific Market Volume (Thousand Tons) Forecast by End-Use, 2020-2035
  • Table 43: Middle East and Africa Market Value (USD Million) Forecast by Country, 2020-2035
  • Table 44: Middle East and Africa Market Volume (Thousand Tons) Forecast by Country, 2020-2035
  • Table 45: Middle East and Africa Market Value (USD Million) Forecast by Application, 2020-2035
  • Table 46: Middle East and Africa Market Volume (Thousand Tons) Forecast by Application, 2020-2035
  • Table 47: Middle East and Africa Market Value (USD Million) Forecast by End-Use, 2020-2035
  • Table 48: Middle East and Africa Market Volume (Thousand Tons) Forecast by End-Use, 2020-2035

List of Figures

  • Figure 1: Global Market Volume (Thousand Tons) Forecast 2020-2035
  • Figure 2: Global Market Pricing Analysis
  • Figure 3: Global Market Value (USD Million) Forecast 2020-2035
  • Figure 4: Global Market Value Share and BPS Analysis by Application, 2025 and 2035
  • Figure 5: Global Market Y-o-Y Growth Comparison by Application, 2025-2035
  • Figure 6: Global Market Attractiveness Analysis by Application
  • Figure 7: Global Market Value Share and BPS Analysis by End-Use, 2025 and 2035
  • Figure 8: Global Market Y-o-Y Growth Comparison by End-Use, 2025-2035
  • Figure 9: Global Market Attractiveness Analysis by End-Use
  • Figure 10: Global Market Value (USD Million) Share and BPS Analysis by Region, 2025 and 2035
  • Figure 11: Global Market Y-o-Y Growth Comparison by Region, 2025-2035
  • Figure 12: Global Market Attractiveness Analysis by Region
  • Figure 13: North America Market Incremental $ Opportunity, 2025-2035
  • Figure 14: Latin America Market Incremental $ Opportunity, 2025-2035
  • Figure 15: Western Europe Market Incremental $ Opportunity, 2025-2035
  • Figure 16: Eastern Europe Market Incremental $ Opportunity, 2025-2035
  • Figure 17: East Asia Market Incremental $ Opportunity, 2025-2035
  • Figure 18: South Asia & Pacific Market Incremental $ Opportunity, 2025-2035
  • Figure 19: Middle East and Africa Market Incremental $ Opportunity, 2025-2035
  • Figure 20: North America Market Value Share and BPS Analysis by Country, 2025 and 2035
  • Figure 21: North America Market Value Share and BPS Analysis by Application, 2025 and 2035
  • Figure 22: North America Market Y-o-Y Growth Comparison by Application, 2025-2035
  • Figure 23: North America Market Attractiveness Analysis by Application
  • Figure 24: North America Market Value Share and BPS Analysis by End-Use, 2025 and 2035
  • Figure 25: North America Market Y-o-Y Growth Comparison by End-Use, 2025-2035
  • Figure 26: North America Market Attractiveness Analysis by End-Use
  • Figure 27: Latin America Market Value Share and BPS Analysis by Country, 2025 and 2035
  • Figure 28: Latin America Market Value Share and BPS Analysis by Application, 2025 and 2035
  • Figure 29: Latin America Market Y-o-Y Growth Comparison by Application, 2025-2035
  • Figure 30: Latin America Market Attractiveness Analysis by Application
  • Figure 31: Latin America Market Value Share and BPS Analysis by End-Use, 2025 and 2035
  • Figure 32: Latin America Market Y-o-Y Growth Comparison by End-Use, 2025-2035
  • Figure 33: Latin America Market Attractiveness Analysis by End-Use
  • Figure 34: Western Europe Market Value Share and BPS Analysis by Country, 2025 and 2035
  • Figure 35: Western Europe Market Value Share and BPS Analysis by Application, 2025 and 2035
  • Figure 36: Western Europe Market Y-o-Y Growth Comparison by Application, 2025-2035
  • Figure 37: Western Europe Market Attractiveness Analysis by Application
  • Figure 38: Western Europe Market Value Share and BPS Analysis by End-Use, 2025 and 2035
  • Figure 39: Western Europe Market Y-o-Y Growth Comparison by End-Use, 2025-2035
  • Figure 40: Western Europe Market Attractiveness Analysis by End-Use
  • Figure 41: Eastern Europe Market Value Share and BPS Analysis by Country, 2025 and 2035
  • Figure 42: Eastern Europe Market Value Share and BPS Analysis by Application, 2025 and 2035
  • Figure 43: Eastern Europe Market Y-o-Y Growth Comparison by Application, 2025-2035
  • Figure 44: Eastern Europe Market Attractiveness Analysis by Application
  • Figure 45: Eastern Europe Market Value Share and BPS Analysis by End-Use, 2025 and 2035
  • Figure 46: Eastern Europe Market Y-o-Y Growth Comparison by End-Use, 2025-2035
  • Figure 47: Eastern Europe Market Attractiveness Analysis by End-Use
  • Figure 48: East Asia Market Value Share and BPS Analysis by Country, 2025 and 2035
  • Figure 49: East Asia Market Value Share and BPS Analysis by Application, 2025 and 2035
  • Figure 50: East Asia Market Y-o-Y Growth Comparison by Application, 2025-2035
  • Figure 51: East Asia Market Attractiveness Analysis by Application
  • Figure 52: East Asia Market Value Share and BPS Analysis by End-Use, 2025 and 2035
  • Figure 53: East Asia Market Y-o-Y Growth Comparison by End-Use, 2025-2035
  • Figure 54: East Asia Market Attractiveness Analysis by End-Use
  • Figure 55: South Asia & Pacific Market Value Share and BPS Analysis by Country, 2025 and 2035
  • Figure 56: South Asia & Pacific Market Value Share and BPS Analysis by Application, 2025 and 2035
  • Figure 57: South Asia & Pacific Market Y-o-Y Growth Comparison by Application, 2025-2035
  • Figure 58: South Asia & Pacific Market Attractiveness Analysis by Application
  • Figure 59: South Asia & Pacific Market Value Share and BPS Analysis by End-Use, 2025 and 2035
  • Figure 60: South Asia & Pacific Market Y-o-Y Growth Comparison by End-Use, 2025-2035
  • Figure 61: South Asia & Pacific Market Attractiveness Analysis by End-Use
  • Figure 62: Middle East and Africa Market Value Share and BPS Analysis by Country, 2025 and 2035
  • Figure 63: Middle East and Africa Market Value Share and BPS Analysis by Application, 2025 and 2035
  • Figure 64: Middle East and Africa Market Y-o-Y Growth Comparison by Application, 2025-2035
  • Figure 65: Middle East and Africa Market Attractiveness Analysis by Application
  • Figure 66: Middle East and Africa Market Value Share and BPS Analysis by End-Use, 2025 and 2035
  • Figure 67: Middle East and Africa Market Y-o-Y Growth Comparison by End-Use, 2025-2035
  • Figure 68: Middle East and Africa Market Attractiveness Analysis by End-Use
  • Figure 69: Global Market - Tier Structure Analysis
  • Figure 70: Global Market - Company Share Analysis

Frequently Asked Questions

What is the estimated global market size of the Acetylated Starch Market in 2025 and 2035?

The global market size is estimated to be USD 940.5 million in 2025 and USD 1,574 million by 2035.

What is the expected CAGR for the Acetylated Starch Market from 2025 to 2035?

The expected CAGR is 5.3% from 2025 to 2035.

Which application segment holds the largest market share in the Acetylated Starch Market?

The Thickening Agent application segment holds the largest market share at 45.6% in 2025.

Who is the leading company in the Acetylated Starch Market?

Asia Fructose Co., Ltd. is the leading company in the market, holding a 10% market share.

What is the projected CAGR of the Acetylated Starch Market in India?

The projected CAGR for India is 6.5% from 2025 to 2035.

Explore Similar Insights

Future Market Insights

Acetylated Starch Market