Starch-Based Bioplastics Packaging Market Size and Share Forecast Outlook 2025 to 2035

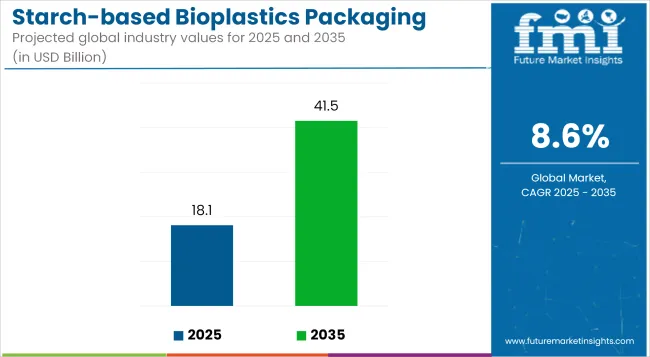
The starch based bioplastics packaging market is projected to grow from USD 18.1 billion in 2025 to USD 41.5 billion by 2035, registering a CAGR of 8.6% during the forecast period. Sales in 2024 reached an estimated USD 16.6 billion, indicating sustained growth momentum driven by rising environmental concerns and increasing bans on single-use plastics.
Quick Stats of Starch-Based Bioplastics Packaging Market

  • Market Value (2025): USD 18.1 billion
  • Forecast Value (2035): USD 41.5 billion
  • Forecast CAGR: 8.6%
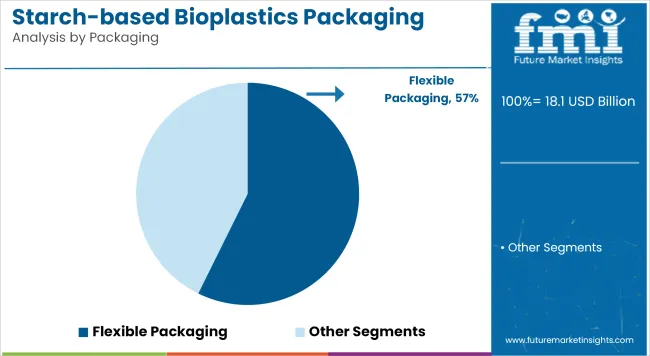
  • Packaging Leader in 2025: Flexible Packaging (57.3% market share)
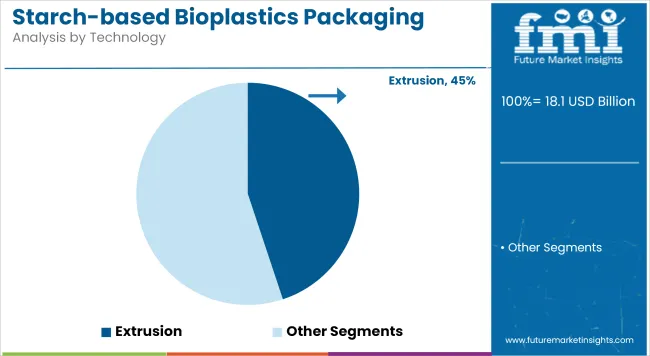
  • Top Technology: Extrusion (44.9% share)
  • Key Growth Region: Europe (UK is the fastest-growing market with an 8.9% CAGR)
Metric Value
Industry Size (2025E) USD 18.1 billion
Industry Value (2035F) USD 41.5 billion
CAGR (2025 to 2035) 8.6%

This expansion has been attributed to the growing preference for biodegradable and renewable packaging alternatives across industries such as food & beverage, personal care, and agriculture. Starch-based bioplastics, derived from natural resources like corn, potato, and cassava starch, are widely used in films, trays, containers, and compostable pouches. Their cost-effectiveness, industrial composability, and reduced carbon footprint are aligning with regulatory frameworks and shifting consumer expectations toward more sustainable packaging practices.

In 2025 Green Dot Bioplastics announces metallization is used in many flexible packaging applications to improve barrier performance, as well as for decoration and marketing differentiation. Green Dot Bioplastics is excited to announce initial film metallizing success in collaboration with Rol-Vac, LP, a leader in the metallization of plastic films and other flexible substrates.

“Film metallization is important to give compostable plastics necessary barrier properties”, said Mark Remmert, Green Dot CEO, “and we are excited that research at Green Dot Bioplastics has brought forth another breakthrough advancement for the industry”.

The shift toward renewable and biodegradable materials is accelerating growth in the starch-based bioplastics packaging market, as companies move away from conventional plastics to meet sustainability goals. These bioplastics are fully compostable under industrial conditions and leave no micro plastic residue, addressing critical environmental concerns.

Technological innovations have enhanced the functional performance of starch blends improving their tensile strength, heat resistance, and moisture barrier properties. Manufacturers are increasingly combining starch with other biodegradable polymers like PLA and PBAT to meet application-specific requirements. With packaging waste reduction targets tightening globally, starch-based bioplastics are being seen as a scalable solution, particularly in single-use packaging applications such as bags, food service ware, and agricultural films.

The market for starch-based bioplastics packaging is expected to witness sustained momentum, driven by policy mandates, material innovation, and consumer-led sustainability pressures. Growth opportunities are projected across regions such as Europe, where the EU Green Deal and Single-Use Plastics Directive support bio-based packaging, and in Asia-Pacific, where bioplastics adoption is rising in response to urbanization and eco-regulations.

Companies that can deliver high-performance, cost-competitive, and compostable packaging formats will be well-positioned. Strategic partnerships between raw material suppliers, packaging converters, and FMCG brands are likely to shape the next phase of industry expansion. As infrastructure for industrial composting improves, starch-based packaging is set to emerge as a cornerstone of the global circular packaging economy.

Analysing Starch-based Bioplastics Packaging Market by Top Investment Segment

The market is segmented based on technology, material, product type, end-use industry, and region. By technology, the market includes blow molding, extrusion, injection molding, and others. In terms of material, the market is categorized into starch blended with PLA, starch blended with PHA, starch blended with PVOH, starch blended with PBS, and other starch-based blends.

By product type, the market is divided into rigid packaging including trays, bottles & containers, and caps & lids and flexible packaging, which includes films & wraps, bags & pouches, and sachets. Based on end-use industry, the market comprises home care, health care, personal care, food & beverage, automotive, and other industrial sectors. Regionally, the market is analysed across North America, Latin America, East Asia, South Asia & Pacific, Eastern Europe, Western Europe, Oceania, and the Middle East & Africa.

Flexible Packaging Gains Prominence for Lightweight, Compostable Applications

Flexible packaging is projected to account for 57.3% of the starch-based bioplastics packaging market by 2025, driven by increasing demand for compostable and lightweight alternatives in retail, e-commerce, and food service. The segment includes formats such as films and wraps, bags and pouches, and sachets, which are widely used for packaging snacks, personal care refills, detergents, and dry powders.

Starch-based flexible films, especially those blended with PLA (polylactic acid) or PVOH (polyvinyl alcohol), offer superior oxygen and moisture barrier properties, making them suitable for both food and non-food applications. These films are increasingly being adopted as monolayer compostable laminates, designed to replace multilayer synthetic plastic structures that are difficult to recycle.

In grocery and foodservice packaging, starch-based pouches are gaining popularity for dry mixes, sugar sachets, and takeaway wrappers, aligning with bans on single-use plastics across Europe and parts of Asia. Large brands in personal care and household cleaning sectors are investing in bio-based refill pouches and sachets, leveraging flexible formats for improved consumer convenience and reduced environmental footprint. Moreover, rapid advancements in printability, seal strength, and home-compost certification have strengthened the adoption of starch-based flexible formats among sustainability-driven SMEs and D2C brands.
Extrusion Technology Leads Production of Starch-Based Films and Sheets

Extrusion is expected to account for 44.9% of the technology share in the starch-based bioplastics packaging market by 2025, making it the leading manufacturing process used for converting starch compounds into films, bags, wraps, and rigid sheets. This technology is particularly effective for processing starch blends with PLA or PBS (polybutylene succinate), which exhibit thermoplastic behaviour, allowing manufacturers to extrude thin, uniform sheets that retain durability while remaining fully biodegradable.

Extrusion lines are highly scalable and allow for the integration of bio-fillers, natural pigments, and functional additives, which enhance printability and mechanical strength. As brands and retailers demand packaging that performs like plastic but decomposes like paper, extrusion has enabled the creation of heat-sealable, water-resistant films with industrial or even home-compost certification.

The growth of automated pouching, wrapping, and thermoforming lines has further strengthened demand for extrusion-based starch packaging, particularly in the food and beverage and home care industries. Global packaging converters are increasingly upgrading to extrusion setups optimized for biodegradable resin processing, recognizing the role of extrusion in achieving cost-competitive and eco-compliant bioplastic packaging at scale.
Challenges and Opportunities

Challenge

Cost and Performance Constraints

Unless low-cost production and enhanced performance deliver environmental advantage to starch bioplastics, application is restricted on bulk scale. The material is typically lower in mechanical and moisture barrier properties than conventional plastics and thus becomes disapproved for most packaging applications. It forces companies to invest in better formulations, coating technology, and material science to drive barrier property and extension of service life to enable starch-based packages to excel in the market without sacrificing sustainability goals.

Opportunity

Consumer Trends and Government Policies

Increased regulatory and consumer support towards adopting greener packaging present lucrative opportunities for the starch-based bioplastics packaging market. Governments worldwide are implementing incentives, subsidies, and tax credits on the use of packaging material that may be biodegradable.

Web giants like Amazon and fast food giants like McDonald's are not far behind in adopting biodegradable packaging as a move to be at the forefront of adopting global trends of being environmentally friendly. Advancements in nanotechnology-based additives and bio-upscale add to the range of application of starch-based bioplastics to packaging applications.

Country Wise Outlook

United States

The USA starch-based bioplastics packaging market is growing, driven in part by demand from the food and beverage sector, retail and consumer goods. The trend of major brands, including Starbucks and Walmart, seeking sustainable packaging solutions is a significant growth driver. Regulatory frameworks like state-level bans on single-use plastics layer yet more momentum of the market.

Improvements in compostability standards and increased consumer awareness will promote the candidacy of starch-based bioplastics over the next few years. Retail and E-commerce Expansion: Leading USA e-commerce merchants increasingly focus on sustainable biodegradable packaging solutions.

The complementary composition of starch esters is also a precursor of huge potential for bioplastics to substitute conventional plastic fillers in bio-reinforcements, thus, reducing the burden on the environment. The foodservice sector is also speeding adoption with compostable takeout and cutlery.

Country CAGR (2025 to 2035)
USA 8.2%

United Kingdom

The UK market for starch-based bioplastics is expanding as the government has pledged to ban single-use plastics by 2030. REACH regulations are also stimulating demand for compostable and renewable alternatives. Supermarket giants like Tesco and Sainsbury’s are spearheading the move towards starch-based alternatives for packaging.

Starch-based packaging solutions are also on the rise in the construction sector for not only insulation, but also protective materials. Supermarket Initiatives: Following suit, big grocery chains are switching to 100% biodegradable packaging, using starch-based trays and wraps instead of plastic options.

Country CAGR (2025 to 2035)
UK 8.9%

European Union

Imposing restrictions under the Green Deal and the Circular Economy Action Plan, the EU acts as a key driver for its starch-based bioplastics packaging market. Germany, France, and Italy are ahead in adoption, backed by industrial support and government incentives for biodegradable plastics. European Union’s ban on single-use plastics drives explosive growth in compostable packaging.

Increasing demand for pallet wrapping and cushioning for starch based bioplastic films in sustainable logistics The cosmetics sector also gravitates toward starch-based bioplastics tubes and containers to lessen dependence on fossil fuels for personal care packaging.

Region CAGR (2025 to 2035)
European Union 8.5%

Japan

Owing to technological advances in biodegradable materials and government incentives to use eco-friendly packaging, the starch-based bioplastics market in Japan is growing. The nation’s Smart Packaging Initiative promotes the use of starch-based materials in food packaging, spurred by demand from convenience store chains like 7-Eleven and FamilyMart.

Electronics and Home Appliance Packaging: Japan’s consumer electronic industry is shifting towards biodegradable starch-based packaging for small appliances and accessories. Given the Czech Republic’s commitment to zero-waste solutions, starch-based bioplastics are a worthy alternative option within protective packaging.

Country CAGR (2025 to 2035)
Japan 8.6%

South Korea

Led by government composable plastic mandates and a growing investment in green technologies, South Korea's starch-based bioplastic market is exploding. Retail and fast-food companies have made some of the biggest commitments, including Lotte and CJ Group to sustainable packaging.

Packaging Explosion in South Korea: The South Korean food industry packaging is shifting towards starch-based pouches and wraps that are substituting petroleum-based packaging. Expanding even further also arrives through innovation in starch-based coatings with high barrier wherein products achieve better moisture barrier capability and longer shelf life.

Country CAGR (2025 to 2035)
South Korea 8.3%

Competitive Outlook

Further the starch-based bioplastics packaging market is very dynamic in nature consisting of a mix of dominant players and regional companies driving towards sustainability. Global companies specializing in sustainable packaging solutions world have pioneered contributions to the sector, thereby prompting vast advances in technology and innovation.

As sustainability becomes a growing concern for consumers and businesses alike, industry leaders are aligning their product portfolios with strict environmental compliance. This competitive landscape features a mix of leading enterprises and emerging players that serve as significant catalysts for the emerging biodegradable and compostable packaging solutions.

Major Providers

  • Treofan GmbH
  • Mitsubishi Chemical Corporation
  • FKuR Kunststoff GmbH
  • Cardia Bioplastics

Key Segmentation

By Technology:

  • Blow molding
  • Extrusion
  • Injection Molding
  • Others

By Material:

  • Starch blended with PLA
  • Starch blended with PHA
  • Starch blended with PVOH
  • Starch blended with PBS
  • Others

By Type:

  • Rigid Packaging
  • Flexible Packaging

By End-Use Industry:

  • Home Care Industry
  • Health Care Industry
  • Personal Care Industry
  • Food & Beverage Industry
  • Automotive Industry
  • Others

By Region:

  • North America
  • Latin America
  • Western Europe
  • Eastern Europe
  • East Asia
  • South Asia Pacific
  • Middle East and Africa

Table of Content

  1. Executive Summary
    • Global Market Outlook
    • Demand-side Trends
    • Supply-side Trends
    • Technology Roadmap Analysis
    • Analysis and Recommendations
  2. Market Overview
    • Market Coverage / Taxonomy
    • Market Definition / Scope / Limitations
  3. Market Background
    • Market Dynamics
      • Drivers
      • Restraints
      • Opportunity
      • Trends
    • Scenario Forecast
      • Demand in Optimistic Scenario
      • Demand in Likely Scenario
      • Demand in Conservative Scenario
    • Opportunity Map Analysis
    • Product Life Cycle Analysis
    • Supply Chain Analysis
      • Supply Side Participants and their Roles
        • Producers
        • Mid-Level Participants (Traders/ Agents/ Brokers)
        • Wholesalers and Distributors
      • Value Added and Value Created at Node in the Supply Chain
      • List of Raw Material Suppliers
      • List of Existing and Potential Buyer’s
    • Investment Feasibility Matrix
    • Value Chain Analysis
      • Profit Margin Analysis
      • Wholesalers and Distributors
      • Retailers
    • PESTLE and Porter’s Analysis
    • Regulatory Landscape
      • By Key Regions
      • By Key Countries
    • Regional Parent Market Outlook
    • Production and Consumption Statistics
    • Import and Export Statistics
  4. Global Market Analysis 2020 to 2024 and Forecast, 2025 to 2035
    • Historical Market Size Value (USD Million) & Volume (Units) Analysis, 2020 to 2024
    • Current and Future Market Size Value (USD Million) & Volume (Units) Projections, 2025 to 2035
      • Y-o-Y Growth Trend Analysis
      • Absolute $ Opportunity Analysis
  5. Global Market Pricing Analysis 2020 to 2024 and Forecast 2025 to 2035
  6. Global Market Analysis 2020 to 2024 and Forecast 2025 to 2035, By Technology
    • Introduction / Key Findings
    • Historical Market Size Value (USD Million) & Volume (Units) Analysis By Technology, 2020 to 2024
    • Current and Future Market Size Value (USD Million) & Volume (Units) Analysis and Forecast By Technology, 2025 to 2035
      • Blow molding
      • Extrusion
      • Injection Molding
      • Others
    • Y-o-Y Growth Trend Analysis By Technology, 2020 to 2024
    • Absolute $ Opportunity Analysis By Technology, 2025 to 2035
  7. Global Market Analysis 2020 to 2024 and Forecast 2025 to 2035, By Material
    • Introduction / Key Findings
    • Historical Market Size Value (USD Million) & Volume (Units) Analysis By Material, 2020 to 2024
    • Current and Future Market Size Value (USD Million) & Volume (Units) Analysis and Forecast By Material, 2025 to 2035
      • Starch blended with PLA
      • Starch blended with PHA
      • Starch blended with PVOH
      • Starch blended with PBS
      • Others
    • Y-o-Y Growth Trend Analysis By Material, 2020 to 2024
    • Absolute $ Opportunity Analysis By Material, 2025 to 2035
  8. Global Market Analysis 2020 to 2024 and Forecast 2025 to 2035, By Product Type
    • Introduction / Key Findings
    • Historical Market Size Value (USD Million) & Volume (Units) Analysis By Product Type, 2020 to 2024
    • Current and Future Market Size Value (USD Million) & Volume (Units) Analysis and Forecast By Product Type, 2025 to 2035
      • Rigid Packaging
      • Flexible Packaging
    • Y-o-Y Growth Trend Analysis By Product Type, 2020 to 2024
    • Absolute $ Opportunity Analysis By Product Type, 2025 to 2035
  9. Global Market Analysis 2020 to 2024 and Forecast 2025 to 2035, By End-Use Industry
    • Introduction / Key Findings
    • Historical Market Size Value (USD Million) & Volume (Units) Analysis By End-Use Industry, 2020 to 2024
    • Current and Future Market Size Value (USD Million) & Volume (Units) Analysis and Forecast By End-Use Industry, 2025 to 2035
      • Home Care Industry
      • Health Care Industry
      • Personal Care Industry
      • Food & Beverage Industry
      • Automotive Industry
      • Others
    • Y-o-Y Growth Trend Analysis By End-Use Industry, 2020 to 2024
    • Absolute $ Opportunity Analysis By End-Use Industry, 2025 to 2035
  10. Global Market Analysis 2020 to 2024 and Forecast 2025 to 2035, By Region
    • Introduction
    • Historical Market Size Value (USD Million) & Volume (Units) Analysis By Region, 2020 to 2024
    • Current Market Size Value (USD Million) & Volume (Units) Analysis and Forecast By Region, 2025 to 2035
      • North America
      • Latin America
      • Europe
      • East Asia
      • South Asia
      • Oceania
      • MEA
    • Market Attractiveness Analysis By Region
  11. North America Market Analysis 2020 to 2024 and Forecast 2025 to 2035, By Country
    • Historical Market Size Value (USD Million) & Volume (Units) Trend Analysis By Market Taxonomy, 2020 to 2024
    • Market Size Value (USD Million) & Volume (Units) Forecast By Market Taxonomy, 2025 to 2035
      • By Country
        • USA
        • Canada
      • By Technology
      • By Material
      • By Product Type
      • By End-Use Industry
    • Market Attractiveness Analysis
      • By Country
      • By Technology
      • By Material
      • By Product Type
      • By End-Use Industry
    • Key Takeaways
  12. Latin America Market Analysis 2020 to 2024 and Forecast 2025 to 2035, By Country
    • Historical Market Size Value (USD Million) & Volume (Units) Trend Analysis By Market Taxonomy, 2020 to 2024
    • Market Size Value (USD Million) & Volume (Units) Forecast By Market Taxonomy, 2025 to 2035
      • By Country
        • Brazil
        • Mexico
        • Argentina
        • Chile
        • Peru
        • Rest of Latin America
      • By Technology
      • By Material
      • By Product Type
      • By End-Use Industry
    • Market Attractiveness Analysis
      • By Country
      • By Technology
      • By Material
      • By Product Type
      • By End-Use Industry
    • Key Takeaways
  13. Europe Market Analysis 2020 to 2024 and Forecast 2025 to 2035, By Country
    • Historical Market Size Value (USD Million) & Volume (Units) Trend Analysis By Market Taxonomy, 2020 to 2024
    • Market Size Value (USD Million) & Volume (Units) Forecast By Market Taxonomy, 2025 to 2035
      • By Country
        • Germany
        • Italy
        • France
        • UK
        • Spain
        • Russia
        • BENELUX
        • Rest of Europe
      • By Technology
      • By Material
      • By Product Type
      • By End-Use Industry
    • Market Attractiveness Analysis
      • By Country
      • By Technology
      • By Material
      • By Product Type
      • By End-Use Industry
    • Key Takeaways
  14. East Asia Market Analysis 2020 to 2024 and Forecast 2025 to 2035, By Country
    • Historical Market Size Value (USD Million) & Volume (Units) Trend Analysis By Market Taxonomy, 2020 to 2024
    • Market Size Value (USD Million) & Volume (Units) Forecast By Market Taxonomy, 2025 to 2035
      • By Country
        • China
        • Japan
        • South Korea
      • By Technology
      • By Material
      • By Product Type
      • By End-Use Industry
    • Market Attractiveness Analysis
      • By Country
      • By Technology
      • By Material
      • By Product Type
      • By End-Use Industry
    • Key Takeaways
  15. South Asia Market Analysis 2020 to 2024 and Forecast 2025 to 2035, By Country
    • Historical Market Size Value (USD Million) & Volume (Units) Trend Analysis By Market Taxonomy, 2020 to 2024
    • Market Size Value (USD Million) & Volume (Units) Forecast By Market Taxonomy, 2025 to 2035
      • By Country
        • India
        • Thailand
        • Malaysia
        • Indonesia
        • Rest of South Asia
      • By Technology
      • By Material
      • By Product Type
      • By End-Use Industry
    • Market Attractiveness Analysis
      • By Country
      • By Technology
      • By Material
      • By Product Type
      • By End-Use Industry
    • Key Takeaways
  16. Oceania Market Analysis 2020 to 2024 and Forecast 2025 to 2035, By Country
    • Historical Market Size Value (USD Million) & Volume (Units) Trend Analysis By Market Taxonomy, 2020 to 2024
    • Market Size Value (USD Million) & Volume (Units) Forecast By Market Taxonomy, 2025 to 2035
      • By Country
        • Australia
        • New Zealand
      • By Technology
      • By Material
      • By Product Type
      • By End-Use Industry
    • Market Attractiveness Analysis
      • By Country
      • By Technology
      • By Material
      • By Product Type
      • By End-Use Industry
    • Key Takeaways
  17. MEA Market Analysis 2020 to 2024 and Forecast 2025 to 2035, By Country
    • Historical Market Size Value (USD Million) & Volume (Units) Trend Analysis By Market Taxonomy, 2020 to 2024
    • Market Size Value (USD Million) & Volume (Units) Forecast By Market Taxonomy, 2025 to 2035
      • By Country
        • GCC
        • Rest of MEA
      • By Technology
      • By Material
      • By Product Type
      • By End-Use Industry
    • Market Attractiveness Analysis
      • By Country
      • By Technology
      • By Material
      • By Product Type
      • By End-Use Industry
    • Key Takeaways
  18. Key Countries Market Analysis
    • USA
      • Pricing Analysis
      • Market Share Analysis, 2024
        • By Technology
        • By Material
        • By Product Type
        • By End-Use Industry
    • Canada
      • Pricing Analysis
      • Market Share Analysis, 2024
        • By Technology
        • By Material
        • By Product Type
        • By End-Use Industry
    • Brazil
      • Pricing Analysis
      • Market Share Analysis, 2024
        • By Technology
        • By Material
        • By Product Type
        • By End-Use Industry
    • Mexico
      • Pricing Analysis
      • Market Share Analysis, 2024
        • By Technology
        • By Material
        • By Product Type
        • By End-Use Industry
    • Argentina
      • Pricing Analysis
      • Market Share Analysis, 2024
        • By Technology
        • By Material
        • By Product Type
        • By End-Use Industry
  19. Market Structure Analysis
    • Competition Dashboard
    • Competition Benchmarking
    • Market Share Analysis of Top Players
      • By Regional
      • By Technology
      • By Material
      • By Product Type
      • By End-Use Industry
  20. Competition Analysis
    • Competition Deep Dive
      • BASF SE
        • Overview
        • Product Portfolio
        • Profitability by Market Segments (Product/Age /Sales Channel/Region)
        • Sales Footprint
        • Strategy Overview
          • Marketing Strategy
          • Product Strategy
          • Channel Strategy
      • FKuR Kunststoff GmbH
        • Overview
        • Product Portfolio
        • Profitability by Market Segments (Product/Age /Sales Channel/Region)
        • Sales Footprint
        • Strategy Overview
          • Marketing Strategy
          • Product Strategy
          • Channel Strategy
      • Biome Bioplastics
        • Overview
        • Product Portfolio
        • Profitability by Market Segments (Product/Age /Sales Channel/Region)
        • Sales Footprint
        • Strategy Overview
          • Marketing Strategy
          • Product Strategy
          • Channel Strategy
      • BioBag International AS
        • Overview
        • Product Portfolio
        • Profitability by Market Segments (Product/Age /Sales Channel/Region)
        • Sales Footprint
        • Strategy Overview
          • Marketing Strategy
          • Product Strategy
          • Channel Strategy
      • Mondi Group
        • Overview
        • Product Portfolio
        • Profitability by Market Segments (Product/Age /Sales Channel/Region)
        • Sales Footprint
        • Strategy Overview
          • Marketing Strategy
          • Product Strategy
          • Channel Strategy
      • Tetra Pak International SA
        • Overview
        • Product Portfolio
        • Profitability by Market Segments (Product/Age /Sales Channel/Region)
        • Sales Footprint
        • Strategy Overview
          • Marketing Strategy
          • Product Strategy
          • Channel Strategy
      • Braskem S.A
        • Overview
        • Product Portfolio
        • Profitability by Market Segments (Product/Age /Sales Channel/Region)
        • Sales Footprint
        • Strategy Overview
          • Marketing Strategy
          • Product Strategy
          • Channel Strategy
      • Amcor Plc
        • Overview
        • Product Portfolio
        • Profitability by Market Segments (Product/Age /Sales Channel/Region)
        • Sales Footprint
        • Strategy Overview
          • Marketing Strategy
          • Product Strategy
          • Channel Strategy
      • Berry Global Inc.
        • Overview
        • Product Portfolio
        • Profitability by Market Segments (Product/Age /Sales Channel/Region)
        • Sales Footprint
        • Strategy Overview
          • Marketing Strategy
          • Product Strategy
          • Channel Strategy
      • ALPLA
        • Overview
        • Product Portfolio
        • Profitability by Market Segments (Product/Age /Sales Channel/Region)
        • Sales Footprint
        • Strategy Overview
          • Marketing Strategy
          • Product Strategy
          • Channel Strategy
  21. Assumptions & Acronyms Used
  22. Research Methodology

List of Tables

  • Table 1: Global Market Value (USD Million) Forecast by Region, 2020-2035
  • Table 2: Global Market Volume (Units) Forecast by Region, 2020-2035
  • Table 3: Global Market Value (USD Million) Forecast by Technology, 2020-2035
  • Table 4: Global Market Volume (Units) Forecast by Technology, 2020-2035
  • Table 5: Global Market Value (USD Million) Forecast by Material, 2020-2035
  • Table 6: Global Market Volume (Units) Forecast by Material, 2020-2035
  • Table 7: Global Market Value (USD Million) Forecast by Product Type, 2020-2035
  • Table 8: Global Market Volume (Units) Forecast by Product Type, 2020-2035
  • Table 9: Global Market Value (USD Million) Forecast by End-Use Industry, 2020-2035
  • Table 10: Global Market Volume (Units) Forecast by End-Use Industry, 2020-2035
  • Table 11: North America Market Value (USD Million) Forecast by Country, 2020-2035
  • Table 12: North America Market Volume (Units) Forecast by Country, 2020-2035
  • Table 13: North America Market Value (USD Million) Forecast by Technology, 2020-2035
  • Table 14: North America Market Volume (Units) Forecast by Technology, 2020-2035
  • Table 15: North America Market Value (USD Million) Forecast by Material, 2020-2035
  • Table 16: North America Market Volume (Units) Forecast by Material, 2020-2035
  • Table 17: North America Market Value (USD Million) Forecast by Product Type, 2020-2035
  • Table 18: North America Market Volume (Units) Forecast by Product Type, 2020-2035
  • Table 19: North America Market Value (USD Million) Forecast by End-Use Industry, 2020-2035
  • Table 20: North America Market Volume (Units) Forecast by End-Use Industry, 2020-2035
  • Table 21: Latin America Market Value (USD Million) Forecast by Country, 2020-2035
  • Table 22: Latin America Market Volume (Units) Forecast by Country, 2020-2035
  • Table 23: Latin America Market Value (USD Million) Forecast by Technology, 2020-2035
  • Table 24: Latin America Market Volume (Units) Forecast by Technology, 2020-2035
  • Table 25: Latin America Market Value (USD Million) Forecast by Material, 2020-2035
  • Table 26: Latin America Market Volume (Units) Forecast by Material, 2020-2035
  • Table 27: Latin America Market Value (USD Million) Forecast by Product Type, 2020-2035
  • Table 28: Latin America Market Volume (Units) Forecast by Product Type, 2020-2035
  • Table 29: Latin America Market Value (USD Million) Forecast by End-Use Industry, 2020-2035
  • Table 30: Latin America Market Volume (Units) Forecast by End-Use Industry, 2020-2035
  • Table 31: Europe Market Value (USD Million) Forecast by Country, 2020-2035
  • Table 32: Europe Market Volume (Units) Forecast by Country, 2020-2035
  • Table 33: Europe Market Value (USD Million) Forecast by Technology, 2020-2035
  • Table 34: Europe Market Volume (Units) Forecast by Technology, 2020-2035
  • Table 35: Europe Market Value (USD Million) Forecast by Material, 2020-2035
  • Table 36: Europe Market Volume (Units) Forecast by Material, 2020-2035
  • Table 37: Europe Market Value (USD Million) Forecast by Product Type, 2020-2035
  • Table 38: Europe Market Volume (Units) Forecast by Product Type, 2020-2035
  • Table 39: Europe Market Value (USD Million) Forecast by End-Use Industry, 2020-2035
  • Table 40: Europe Market Volume (Units) Forecast by End-Use Industry, 2020-2035
  • Table 41: East Asia Market Value (USD Million) Forecast by Country, 2020-2035
  • Table 42: East Asia Market Volume (Units) Forecast by Country, 2020-2035
  • Table 43: East Asia Market Value (USD Million) Forecast by Technology, 2020-2035
  • Table 44: East Asia Market Volume (Units) Forecast by Technology, 2020-2035
  • Table 45: East Asia Market Value (USD Million) Forecast by Material, 2020-2035
  • Table 46: East Asia Market Volume (Units) Forecast by Material, 2020-2035
  • Table 47: East Asia Market Value (USD Million) Forecast by Product Type, 2020-2035
  • Table 48: East Asia Market Volume (Units) Forecast by Product Type, 2020-2035
  • Table 49: East Asia Market Value (USD Million) Forecast by End-Use Industry, 2020-2035
  • Table 50: East Asia Market Volume (Units) Forecast by End-Use Industry, 2020-2035
  • Table 51: South Asia Market Value (USD Million) Forecast by Country, 2020-2035
  • Table 52: South Asia Market Volume (Units) Forecast by Country, 2020-2035
  • Table 53: South Asia Market Value (USD Million) Forecast by Technology, 2020-2035
  • Table 54: South Asia Market Volume (Units) Forecast by Technology, 2020-2035
  • Table 55: South Asia Market Value (USD Million) Forecast by Material, 2020-2035
  • Table 56: South Asia Market Volume (Units) Forecast by Material, 2020-2035
  • Table 57: South Asia Market Value (USD Million) Forecast by Product Type, 2020-2035
  • Table 58: South Asia Market Volume (Units) Forecast by Product Type, 2020-2035
  • Table 59: South Asia Market Value (USD Million) Forecast by End-Use Industry, 2020-2035
  • Table 60: South Asia Market Volume (Units) Forecast by End-Use Industry, 2020-2035
  • Table 61: Oceania Market Value (USD Million) Forecast by Country, 2020-2035
  • Table 62: Oceania Market Volume (Units) Forecast by Country, 2020-2035
  • Table 63: Oceania Market Value (USD Million) Forecast by Technology, 2020-2035
  • Table 64: Oceania Market Volume (Units) Forecast by Technology, 2020-2035
  • Table 65: Oceania Market Value (USD Million) Forecast by Material, 2020-2035
  • Table 66: Oceania Market Volume (Units) Forecast by Material, 2020-2035
  • Table 67: Oceania Market Value (USD Million) Forecast by Product Type, 2020-2035
  • Table 68: Oceania Market Volume (Units) Forecast by Product Type, 2020-2035
  • Table 69: Oceania Market Value (USD Million) Forecast by End-Use Industry, 2020-2035
  • Table 70: Oceania Market Volume (Units) Forecast by End-Use Industry, 2020-2035
  • Table 71: MEA Market Value (USD Million) Forecast by Country, 2020-2035
  • Table 72: MEA Market Volume (Units) Forecast by Country, 2020-2035
  • Table 73: MEA Market Value (USD Million) Forecast by Technology, 2020-2035
  • Table 74: MEA Market Volume (Units) Forecast by Technology, 2020-2035
  • Table 75: MEA Market Value (USD Million) Forecast by Material, 2020-2035
  • Table 76: MEA Market Volume (Units) Forecast by Material, 2020-2035
  • Table 77: MEA Market Value (USD Million) Forecast by Product Type, 2020-2035
  • Table 78: MEA Market Volume (Units) Forecast by Product Type, 2020-2035
  • Table 79: MEA Market Value (USD Million) Forecast by End-Use Industry, 2020-2035
  • Table 80: MEA Market Volume (Units) Forecast by End-Use Industry, 2020-2035

List of Figures

  • Figure 1: Global Market Volume (Units) Forecast 2020-2035
  • Figure 2: Global Market Pricing Analysis
  • Figure 3: Global Market Value (USD Million) Forecast 2020-2035
  • Figure 4: Global Market Value Share and BPS Analysis by Technology, 2025 and 2035
  • Figure 5: Global Market Y-o-Y Growth Comparison by Technology, 2025-2035
  • Figure 6: Global Market Attractiveness Analysis by Technology
  • Figure 7: Global Market Value Share and BPS Analysis by Material, 2025 and 2035
  • Figure 8: Global Market Y-o-Y Growth Comparison by Material, 2025-2035
  • Figure 9: Global Market Attractiveness Analysis by Material
  • Figure 10: Global Market Value Share and BPS Analysis by Product Type, 2025 and 2035
  • Figure 11: Global Market Y-o-Y Growth Comparison by Product Type, 2025-2035
  • Figure 12: Global Market Attractiveness Analysis by Product Type
  • Figure 13: Global Market Value Share and BPS Analysis by End-Use Industry, 2025 and 2035
  • Figure 14: Global Market Y-o-Y Growth Comparison by End-Use Industry, 2025-2035
  • Figure 15: Global Market Attractiveness Analysis by End-Use Industry
  • Figure 16: Global Market Value (USD Million) Share and BPS Analysis by Region, 2025 and 2035
  • Figure 17: Global Market Y-o-Y Growth Comparison by Region, 2025-2035
  • Figure 18: Global Market Attractiveness Analysis by Region
  • Figure 19: North America Market Incremental $ Opportunity, 2025-2035
  • Figure 20: Latin America Market Incremental $ Opportunity, 2025-2035
  • Figure 21: Europe Market Incremental $ Opportunity, 2025-2035
  • Figure 22: East Asia Market Incremental $ Opportunity, 2025-2035
  • Figure 23: South Asia Market Incremental $ Opportunity, 2025-2035
  • Figure 24: Oceania Market Incremental $ Opportunity, 2025-2035
  • Figure 25: MEA Market Incremental $ Opportunity, 2025-2035
  • Figure 26: North America Market Value Share and BPS Analysis by Country, 2025 and 2035
  • Figure 27: North America Market Value Share and BPS Analysis by Technology, 2025 and 2035
  • Figure 28: North America Market Y-o-Y Growth Comparison by Technology, 2025-2035
  • Figure 29: North America Market Attractiveness Analysis by Technology
  • Figure 30: North America Market Value Share and BPS Analysis by Material, 2025 and 2035
  • Figure 31: North America Market Y-o-Y Growth Comparison by Material, 2025-2035
  • Figure 32: North America Market Attractiveness Analysis by Material
  • Figure 33: North America Market Value Share and BPS Analysis by Product Type, 2025 and 2035
  • Figure 34: North America Market Y-o-Y Growth Comparison by Product Type, 2025-2035
  • Figure 35: North America Market Attractiveness Analysis by Product Type
  • Figure 36: North America Market Value Share and BPS Analysis by End-Use Industry, 2025 and 2035
  • Figure 37: North America Market Y-o-Y Growth Comparison by End-Use Industry, 2025-2035
  • Figure 38: North America Market Attractiveness Analysis by End-Use Industry
  • Figure 39: Latin America Market Value Share and BPS Analysis by Country, 2025 and 2035
  • Figure 40: Latin America Market Value Share and BPS Analysis by Technology, 2025 and 2035
  • Figure 41: Latin America Market Y-o-Y Growth Comparison by Technology, 2025-2035
  • Figure 42: Latin America Market Attractiveness Analysis by Technology
  • Figure 43: Latin America Market Value Share and BPS Analysis by Material, 2025 and 2035
  • Figure 44: Latin America Market Y-o-Y Growth Comparison by Material, 2025-2035
  • Figure 45: Latin America Market Attractiveness Analysis by Material
  • Figure 46: Latin America Market Value Share and BPS Analysis by Product Type, 2025 and 2035
  • Figure 47: Latin America Market Y-o-Y Growth Comparison by Product Type, 2025-2035
  • Figure 48: Latin America Market Attractiveness Analysis by Product Type
  • Figure 49: Latin America Market Value Share and BPS Analysis by End-Use Industry, 2025 and 2035
  • Figure 50: Latin America Market Y-o-Y Growth Comparison by End-Use Industry, 2025-2035
  • Figure 51: Latin America Market Attractiveness Analysis by End-Use Industry
  • Figure 52: Europe Market Value Share and BPS Analysis by Country, 2025 and 2035
  • Figure 53: Europe Market Value Share and BPS Analysis by Technology, 2025 and 2035
  • Figure 54: Europe Market Y-o-Y Growth Comparison by Technology, 2025-2035
  • Figure 55: Europe Market Attractiveness Analysis by Technology
  • Figure 56: Europe Market Value Share and BPS Analysis by Material, 2025 and 2035
  • Figure 57: Europe Market Y-o-Y Growth Comparison by Material, 2025-2035
  • Figure 58: Europe Market Attractiveness Analysis by Material
  • Figure 59: Europe Market Value Share and BPS Analysis by Product Type, 2025 and 2035
  • Figure 60: Europe Market Y-o-Y Growth Comparison by Product Type, 2025-2035
  • Figure 61: Europe Market Attractiveness Analysis by Product Type
  • Figure 62: Europe Market Value Share and BPS Analysis by End-Use Industry, 2025 and 2035
  • Figure 63: Europe Market Y-o-Y Growth Comparison by End-Use Industry, 2025-2035
  • Figure 64: Europe Market Attractiveness Analysis by End-Use Industry
  • Figure 65: East Asia Market Value Share and BPS Analysis by Country, 2025 and 2035
  • Figure 66: East Asia Market Value Share and BPS Analysis by Technology, 2025 and 2035
  • Figure 67: East Asia Market Y-o-Y Growth Comparison by Technology, 2025-2035
  • Figure 68: East Asia Market Attractiveness Analysis by Technology
  • Figure 69: East Asia Market Value Share and BPS Analysis by Material, 2025 and 2035
  • Figure 70: East Asia Market Y-o-Y Growth Comparison by Material, 2025-2035
  • Figure 71: East Asia Market Attractiveness Analysis by Material
  • Figure 72: East Asia Market Value Share and BPS Analysis by Product Type, 2025 and 2035
  • Figure 73: East Asia Market Y-o-Y Growth Comparison by Product Type, 2025-2035
  • Figure 74: East Asia Market Attractiveness Analysis by Product Type
  • Figure 75: East Asia Market Value Share and BPS Analysis by End-Use Industry, 2025 and 2035
  • Figure 76: East Asia Market Y-o-Y Growth Comparison by End-Use Industry, 2025-2035
  • Figure 77: East Asia Market Attractiveness Analysis by End-Use Industry
  • Figure 78: South Asia Market Value Share and BPS Analysis by Country, 2025 and 2035
  • Figure 79: South Asia Market Value Share and BPS Analysis by Technology, 2025 and 2035
  • Figure 80: South Asia Market Y-o-Y Growth Comparison by Technology, 2025-2035
  • Figure 81: South Asia Market Attractiveness Analysis by Technology
  • Figure 82: South Asia Market Value Share and BPS Analysis by Material, 2025 and 2035
  • Figure 83: South Asia Market Y-o-Y Growth Comparison by Material, 2025-2035
  • Figure 84: South Asia Market Attractiveness Analysis by Material
  • Figure 85: South Asia Market Value Share and BPS Analysis by Product Type, 2025 and 2035
  • Figure 86: South Asia Market Y-o-Y Growth Comparison by Product Type, 2025-2035
  • Figure 87: South Asia Market Attractiveness Analysis by Product Type
  • Figure 88: South Asia Market Value Share and BPS Analysis by End-Use Industry, 2025 and 2035
  • Figure 89: South Asia Market Y-o-Y Growth Comparison by End-Use Industry, 2025-2035
  • Figure 90: South Asia Market Attractiveness Analysis by End-Use Industry
  • Figure 91: Oceania Market Value Share and BPS Analysis by Country, 2025 and 2035
  • Figure 92: Oceania Market Value Share and BPS Analysis by Technology, 2025 and 2035
  • Figure 93: Oceania Market Y-o-Y Growth Comparison by Technology, 2025-2035
  • Figure 94: Oceania Market Attractiveness Analysis by Technology
  • Figure 95: Oceania Market Value Share and BPS Analysis by Material, 2025 and 2035
  • Figure 96: Oceania Market Y-o-Y Growth Comparison by Material, 2025-2035
  • Figure 97: Oceania Market Attractiveness Analysis by Material
  • Figure 98: Oceania Market Value Share and BPS Analysis by Product Type, 2025 and 2035
  • Figure 99: Oceania Market Y-o-Y Growth Comparison by Product Type, 2025-2035
  • Figure 100: Oceania Market Attractiveness Analysis by Product Type
  • Figure 101: Oceania Market Value Share and BPS Analysis by End-Use Industry, 2025 and 2035
  • Figure 102: Oceania Market Y-o-Y Growth Comparison by End-Use Industry, 2025-2035
  • Figure 103: Oceania Market Attractiveness Analysis by End-Use Industry
  • Figure 104: MEA Market Value Share and BPS Analysis by Country, 2025 and 2035
  • Figure 105: MEA Market Value Share and BPS Analysis by Technology, 2025 and 2035
  • Figure 106: MEA Market Y-o-Y Growth Comparison by Technology, 2025-2035
  • Figure 107: MEA Market Attractiveness Analysis by Technology
  • Figure 108: MEA Market Value Share and BPS Analysis by Material, 2025 and 2035
  • Figure 109: MEA Market Y-o-Y Growth Comparison by Material, 2025-2035
  • Figure 110: MEA Market Attractiveness Analysis by Material
  • Figure 111: MEA Market Value Share and BPS Analysis by Product Type, 2025 and 2035
  • Figure 112: MEA Market Y-o-Y Growth Comparison by Product Type, 2025-2035
  • Figure 113: MEA Market Attractiveness Analysis by Product Type
  • Figure 114: MEA Market Value Share and BPS Analysis by End-Use Industry, 2025 and 2035
  • Figure 115: MEA Market Y-o-Y Growth Comparison by End-Use Industry, 2025-2035
  • Figure 116: MEA Market Attractiveness Analysis by End-Use Industry
  • Figure 117: Global Market - Tier Structure Analysis
  • Figure 118: Global Market - Company Share Analysis

Frequently Asked Questions

What was the overall size of the starch-based bioplastics packaging market in 2025?

The overall market size for starch-based bioplastics packaging was USD 18.1 billion in 2025.

How big is the starch-based bioplastics packaging market expected to be in 2035?

The starch-based bioplastics packaging market is expected to reach USD 41.5 billion in 2035.

What will drive the demand for starch-based bioplastics packaging during the forecast period?

The increasing demand for environmentally friendly packaging solutions, technological advancements in the packaging industry, favorable government initiatives for sustainable packaging, and growing consumer awareness are expected to drive the demand for starch-based bioplastics packaging during the forecast period.

List the top 5 countries contributing to the starch-based bioplastics packaging market?

The top 5 countries driving the development of the starch-based bioplastics packaging market are the USA, Germany, the UK, China, and India.

Which is the leading segment in the starch-based bioplastics packaging market?

On the basis of application, the food & beverage industry is anticipated to command a significant share over the forecast period.

Explore Similar Insights

Future Market Insights

Starch-Based Bioplastics Packaging Market