
- Market Size (2026)
- USD 78.5 Bn
- Forecast (2036)
- USD 103.5 Bn
- CAGR (2026 to 2036)
- 2.8%
How big is Starches/Glucose Market in 2026?
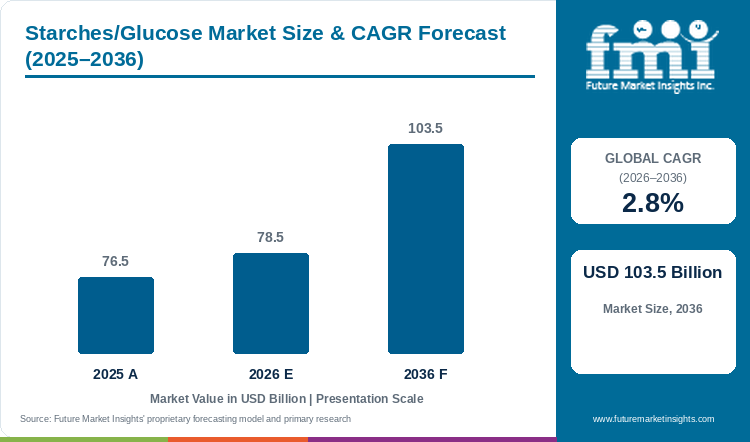
Accounting for USD 76.5 billion in 2025 and rising to USD 78.5 billion in 2026, the starches/glucose market is projected to expand to USD 103.5 billion by 2036, advancing at a CAGR of 2.8%.
Multinational beverage bottlers, confectionery plants, and corrugated packaging mills refining bulk carbohydrate sweetener and surface-sizing binder costs sustain baseline demand across the starches and glucose industry. When food and paper manufacturers scale high-speed continuous production lines, they require uniform Dextrose Equivalent glucose syrups to prevent sugar crystallization in gummies and modified starches to prevent water separation in chilled sauces or burst failure in recycled containerboard. FMI market tracking confirms that anchored by this recurring industrial consumption, the global starches/glucose market value expands from USD 76.5 billion in 2025 to USD 78.5 billion in 2026 and is projected to reach USD 103.5 billion by 2036 at a 2.8% CAGR. Beverages soft drinks and juices capture 37.5% of 2026 demand as soft drink bottlers and high-gravity breweries procure continuous railcar volumes of HFCS-55 and maltose adjunct syrups. Whereas commodity liquid sweetener volumes track population growth, wet-millers capture higher margin expansion by upgrading slurry streams into the modified food starch category where clean-label texturizers command more than double the per-ton selling price of bulk glucose. in January 2026 with the USDA Economic Research Service Sugar and Sweeteners Yearbook documented that US corn wet-milling deliveries of HFCS with glucose syrup and dextrose exceeded 14.2 billion dry pounds in 2025. Similarly, in December 2025, Novonesis launched its Termamyl Prime alpha-amylase biosolution to boost starch liquefaction efficiency and high-gravity syrup throughput across industrial grain processors and breweries. Even so, national excise taxes on sugar-sweetened beverages and volatile maize basis costs continue to pressure commodity syrup margins.
Key Market Trends & Insights
- By botanical source: yellow dent corn and waxy maize starch commands 30.0% in 2026 because integrated US, Chinese, and European wet-mills offset gross grain costs with high-protein gluten feed and corn oil credits.
- By derivative product: High Fructose Corn Syrup HFCS-55 and HFCS-42 represent 33.7% in 2026 as automated beverage and baking plants rely on pumpable liquid sweetener handling.
- By commercial end-use: Beverages Soft Drinks and Juices command 37.5% in 2026 through year-round bulk tanker contracts for carbonated soft drinks, juices with energy drinks and brewing adjuncts.
- By physical form: Liquid Tanker Syrups and Slurries secure 58.4% in 2026 owing to direct pipeline and heated railcar transfers that eliminate spray-drying energy costs.
- By functionality: Sweetening, Humectancy, and Cryoprotection accounts for 54.2% in 2026 through essential freezing-point depression in dairy and crystallization control in confectionery.
Regional Highlights
- Top national expansion: Brazil leads national growth projections at a 3.4% CAGR through 2036 under expanding second-crop safrinha maize wet-milling and Parana cassava starch refining.
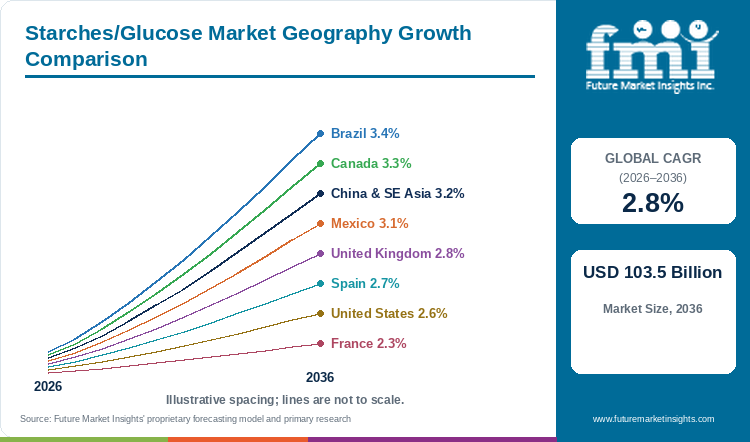
- Broader country progression: Canada tracks at a 3.3% CAGR ahead of China and Southeast Asia at 3.2% and Mexico at 3.1%, whereas the United Kingdom advances at 2.8% with Spain grows at 2.7% and France progresses at 2.3%.
Market Size & Forecast
Table 1: Market Size and Forecast for the Starches/Glucose Market (USD billion and CAGR percentage), 2025 to 2036
| Metric | Value |
|---|---|
| 2025 Market Size | USD 76.5 billion |
| Estimated Market Size in 2026 | USD 78.5 billion |
| Projected Market Size by 2036 | USD 103.5 billion |
| CAGR, 2026 to 2036 | 2.8% |
| Added Value, 2026 to 2036 | USD 25.0 billion |
Starch wet-milling biorefineries operating continuous 24-hour steeping, germ separation, and hydrocyclone starch washing lines must maintain above 88% grind utilization to cover fixed stainless-steel asset depreciation. When soft drink bottlers trim caloric HFCS-55 orders in response to front-of-pack sugar labels, refiners cannot simply idle steep tanks without hurting co-product corn oil and gluten meal recoveries. In July 2025, the OECD-FAO Agricultural Outlook 2025 to 2034 projected that global industrial cereal and root crop processing into starch derivatives and caloric sweeteners will expand steadily through 2034 as emerging economies urbanize. Refiners accordingly swing excess starch milk out of commodity fructose columns and into high-margin waxy corn starch and fermentation dextrose streams.
Starch Wet-Milling Grind and Enzymatic Liquefaction Sizing
Table 2: Wet-Milling Grind Volume and Enzymatic Conversion Sizing for the Starches/Glucose Market (USD billion and operational ranges), 2025 to 2036
| Metric | 2025 | 2026 | 2036 |
|---|---|---|---|
| Market size (USD billion) | 76.5 | 78.5 | 103.5 |
| Global dry-basis starch & syrup output (billion metric tons) | 0.108 to 0.111 | 0.110 to 0.114 | 0.139 to 0.145 |
| Agricultural crop grind for wet-milling (billion metric tons) | 0.165 to 0.172 | 0.169 to 0.176 | 0.212 to 0.222 |
| Blended realization per metric ton dry basis (USD) | 695.0 to 708.0 | 700.0 to 714.0 | 728.0 to 744.0 |
Operational note: Enzymatic conversion ranges apply standard 0.15 to 0.30 kg/MT dry starch thermostable alpha-amylase liquefaction dosing and 0.25 to 0.45 kg/MT glucoamylase saccharification dosing.
Conversion of native starch slurries into crystal-clear glucose syrups with exact Dextrose Equivalent (DE 20 to DE 95) specifications requires sequential enzymatic hydrolysis rather than legacy hydrochloric acid cooking. Acid hydrolysis produces bitter reversion sugars, dark hydroxymethylfurfural color bodies, and high sodium chloride ash that fouls ion-exchange demineralization columns. Modern refineries therefore dose calcium-independent alpha-amylases and pullulanases from Novonesis (including Chr. Hansen) and DSM-Firmenich during 105-degree-Celsius jet cooking to produce low-ash refined glucose syrup while cutting ion-exchange regeneration chemical usage by 30%.
Per Capita & Industrial Biorefinery Line Sizing
Table 3: Per Capita and Wet-Milling Refinery Indicators for the Starches/Glucose Market (USD), 2025 to 2036
| Metric | 2025 | 2026 | 2036 |
|---|---|---|---|
| World population (billion) | 8.2 | 8.3 | 9.0 |
| Per capita starches & glucose value (USD) | 9.3 | 9.5 | 11.5 |
| Annual output per major wet-milling refinery (USD billion) | 0.22 to 0.28 | 0.23 to 0.29 | 0.30 to 0.38 |
| Modified & clean-label specialty starch value share (%) | 22.0% to 25.0% | 23.0% to 26.0% | 29.0% to 33.0% |
Table 4: Industrial End-Use & Channel Indicators for the Starches/Glucose Market (USD and percentages), 2026
| Metric | Value | Institutional Reference Basis |
|---|---|---|
| Market size, 2026 | USD 78.5 billion | 2026 global valuation baseline (4.9% child share) |
| Commercial wet-milling & tuber biorefineries global | 310 facilities | Corn, wheat, cassava, potato & pea wet-milling plants |
| Average annual output value per biorefinery | USD 0.253 billion | Annualized refinery starch & sweetener shipments |
| Beverages Soft Drinks & Juices value, 2026 | USD 29.4 billion | 37.5% commercial end-use allocation |
Beverage and confectionery brands reformulating products to reduce added sugars by 30% face a severe physical bulking and mouthfeel deficit when high-DE glucose syrups or HFCS are removed. High-potency sweeteners replace sweetness at trace microgram levels but leave thin viscosity and metallic aftertastes. To restore full-sugar body and clean upfront sweetness, refiners blend low-DE maltodextrins and industrial wheat starch hydrolysates with natural sweetness and mouthfeel modulators supplied by Givaudan SA with Symrise AG and DSM-Firmenich.
Analyst Perspective
"Starch and glucose wet-millers are no longer hostage to carbonated soft drink HFCS volumes. Refiners like Ingredion, Tate & Lyle with Cargill with ADM and Roquette are capturing 900+ basis points of gross margin expansion by diverting grind capacity into clean-label physical food starches with cationic corrugated board binders and over-the-fence DE-95 dextrose for bio-fermentation and all powered by Novonesis and DSM-Firmenich enzyme cascades."
- Nandini Roy Choudhury, Principal Consultant, Future Market Insights.
How is the Starches/Glucose market segmented?
The starches/glucose market is segmented by botanical source, derivative product with commercial end-use with physical form and functionality. In 2026, Dent Corn and Waxy Maize Starch is projected at 30.0% with High Fructose Corn Syrup HFCS-55 HFCS-42 at 33.7% with Beverages Soft Drinks and Juices at 37.5% with Liquid Tanker Syrups at 58.4% and Sweetening and Humectancy at 54.2%.
By botanical source: dent maize and waxy corn starch and Cassava Tapioca Starch with Wheat Starch Gluten Byproduct, Potato Starch, and Pea and Specialty Sources.
By derivative product: High Fructose Corn Syrup HFCS-55 HFCS-42 and Liquid Glucose Corn Syrups DE 30 to 60 with Native Food Starches, Modified Functional Food Starches E1422 E1442, and Maltodextrins and Dextrose.
By commercial end-use: Beverages Soft Drinks and Juices and Confectionery Candies Gums and Marshmallows as well as Bakery Breads Cakes and Pastry Fillings, Corrugated Board Paper Sizing, and Dairy Pharma and Fermentation.
By physical form: Liquid Tanker Syrups and Slurries and Dry Powder and Granular Bags.
By functionality: Sweetening Humectancy and Cryoprotection and Viscosity Texturizing and Freeze-Thaw Stability with Surface Sizing and Wet-End Paper Bonding.
Why does Dent Corn and Waxy Maize Starch lead the botanical source category?
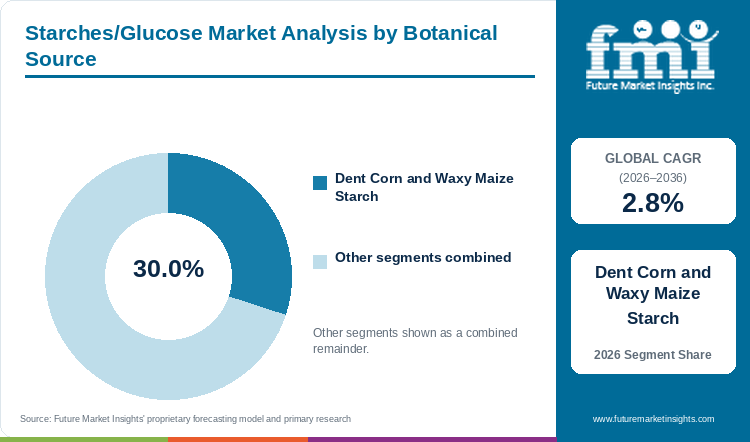
Dent Corn and Waxy Maize Starch holds an estimated 30.0% of botanical source demand in 2026, anchored by wet-milling co-product credits and waxy amylopectin freeze-thaw stability.
Table 5: Botanical Source Share for the Starches/Glucose Market (percentage share), 2026
| Botanical Source | Share (2026) |
|---|---|
| Dent Corn and Waxy Maize Starch | 30.0% |
| Cassava Tapioca, Wheat, Potato & Pea Sources Combined | 70.0%* |
| Total | 100.0% |
*Note: Remaining botanical source categories account for the balance of 2026 global starches/glucose demand.
Table 6: Botanical Source Leadership and Market Growth for the Starches/Glucose Market (segment and CAGR percentage), 2026 to 2036
| Metric | Value |
|---|---|
| Global CAGR (2026 to 2036) | 2.8% |
| Leading Segment | Dent Corn and Waxy Maize Starch |
Yellow Dent Corn and Waxy Maize grades anchor global wet-milling economics because yellow dent corn yields 66% recoverable starch as well as valuable corn gluten feed, corn gluten meal, and crude corn oil co-products that offset raw grain costs. Meanwhile, waxy maize starch (containing 99% branched amylopectin and virtually zero linear amylose) resists retrogradation gelation during cold storage, complementing European potato starch in premium UHT sauces and fruit fillings.
- Dent Corn and Waxy Maize Starch holds 30.0% of botanical source value in 2026 because year-round silo storage and co-product credits make maize the lowest-cost glucose feedstock in North America and China.
- In August 2025, researchers publishing in Foods (PMC12428241) demonstrated that critical melting and freeze-thaw pretreatment of native maize starch increased granule porosity by 20- to 26-fold and accelerated subsequent enzymatic hydrolysis.
What sustains High Fructose Corn Syrup HFCS-55 HFCS-42 leadership in the derivative product segment?
High Fructose Corn Syrup HFCS-55 and HFCS-42 represents 33.7% of the derivative product category in 2026, supported by continuous bulk liquid sweetener contracts across beverage and baking plants.
High Fructose Corn Syrup (produced by enzymatic isomerization of DE-95 dextrose over immobilized glucose isomerase columns) provides beverage bottlers and industrial bakeries with a microbiologically stable, pumpable liquid sweetener that matches sucrose sweetness at a 15% to 30% cost discount in corn-surplus regions. While HFCS generates the largest baseline dollar pool, Modified Functional Food Starches (E1422 with E1442 and clean-label physical starches) expand fastest at 3.5% CAGR across tapioca food starch and waxy corn texturizer lines.
- High Fructose Corn Syrup HFCS-55 and HFCS-42 represents 33.7% of the derivative product segment in 2026 through massive contracted tanker volumes across the Americas and East Asia.
- In February 2026, food hydrocolloid scientists reporting in Foods (PMC12984116) documented how cross-linked starch and hydrophilic colloid interactions reinforce gel networks and suppress water syneresis across repeated freeze-thaw stress cycles.
How do Beverages Soft Drinks and Juices lead the commercial end-use category?
Beverages Soft Drinks and Juices account for 37.5% of commercial end-use demand in 2026, driven by soft drink bottling with juice sweetening and high-maltose brewing adjuncts.
Carbonated soft drinks, fruit juices with sports drinks and commercial breweries consume the largest global tonnage of starch-derived liquid sweeteners with high-maltose brewing adjunct syrups and emulsion-stabilizing octenyl succinic anhydride (OSA) starches. At the same time, snack and meat processors rapidly expand procurement of functional pea starch and modified cassava starches to bind moisture and create crisp extruded textures.
- Beverages Soft Drinks and Juices account for 37.5% of commercial end-use demand in 2026 because high-speed bottling and brewing lines operate on continuous bulk liquid syrup deliveries.
- In September 2025, bioprocess researchers publishing in Molecules (PMC12418635) established that combining thermostable alpha-amylase liquefaction with glucoamylase saccharification at 65 degrees Celsius achieved fermentable glucose concentrations up to 205.7 grams per liter.
Why does Liquid Tanker Syrups and Slurries lead the physical form category?
Liquid Tanker Syrups and Slurries secure 58.4% of physical form value in 2026, supported by heated railcar and pipeline deliveries that avoid spray-drying energy costs.
Liquid Tanker Syrups and Slurries (spanning 71% to 84% dry solids HFCS, DE-42/DE-60 liquid glucose, and over-the-fence starch milk slurries) dominate refinery shipments because eliminating ring-dryer and spray-dryer thermal evaporation saves USD 45 to USD 65 per metric ton in natural gas costs. Dry Powder and Granular Bags (41.6% share) grow faster at 3.1% CAGR as export-oriented modified starches, crystalline dextrose, and spray-dried maltodextrins ship globally in 25 kg multi-wall bags and 1-ton supersacks.
- Liquid Tanker Syrups and Slurries secure 58.4% of physical form value in 2026 as beverage bottlers, breweries, and adjacent fermentation plants receive heated railcar and pipeline deliveries.
- In October 2025, encapsulation engineers publishing in Food Hydrocolloids (PMC12550165) proved that varying the Dextrose Equivalent (DE 6 with 12 with 21 and 38) of spray-dried maltodextrin directly governs particle skin formation and volatile oil retention.
What gives Sweetening, Humectancy, and Cryoprotection the leading position in functionality?
Sweetening, Humectancy and Cryoprotection commands 54.2% of functionality share in 2026 and anchored by crystallization control in confectionery and freezing-point depression in dairy.
Commercial sweetening, Humectancy and Cryoprotection represents the foundational functional role of starch hydrolysates across beverages with hard/gummy confectionery with jams with ice cream and baked goods. In gummy candies and marshmallows, DE-42 and DE-60 glucose syrups prevent sucrose graining and control water activity with whereas in frozen dairy desserts and glucose and maltodextrin syrups depress freezing points and inhibit coarse ice crystal growth.
- Commercial sweetening, Humectancy, and Cryoprotection commands 54.2% of functionality value in 2026 because caloric sweetness and moisture binding cannot be replicated by high-intensity sweeteners alone.
- In January 2026, extrusion food scientists reporting in Foods (PMC12841222) demonstrated how specific amylose-to-amylopectin ratios in pea with corn and potato starches govern gel-like network formation and water holding under high-moisture thermal processing.
What are the drivers, restraints, and opportunities in the Starches/Glucose market?
In the starches/glucose market, e-commerce corrugated packaging board and convenience food texturizer demand are projected to drive growth whereas beverage sugar taxes and E-number starch avoidance restrain commodity HFCS and hydrothermal clean-label starches with bio-fermentation dextrose capture margin expansion.
- Driver: Rising e-commerce corrugated packaging board output and convenience food demand for freeze-thaw stable texturizers drive continuous starch and glucose refinery utilization.
- Restraint: National excise taxes on sugar-sweetened beverages, front-of-pack warning octagons, and consumer avoidance of chemical E-number starch labels restrain commodity HFCS and chemically cross-linked starch growth.
- Opportunity: Hydrothermal clean-label physical starch modification, enzymatic branching, and over-the-fence DE-95 dextrose supply for precision bio-fermentation capture high-margin refinery growth.
Growth Analysis and Future Potential: Qualitative Demand Drivers
Global growth in e-commerce parcel shipping and packaged convenience foods provides a resilient dual demand floor for industrial cationic/oxidized paper starches and food-grade glucose and maltodextrin syrups. Recycled containerboard fibers lose hydrogen-bonding strength with each recycling pass, forcing paper mills to apply 35 to 55 kilograms of surface-sizing and wet-end cationic starch per metric ton of linerboard, while food processors rely on spray-dried food-grade maltodextrin as a universal flavor carrier. In January 2026, materials researchers publishing in Polymers (PMC12830176) demonstrated that cationic-acetylated starch surface coatings dramatically improve paper tensile strength and greaseproof barrier performance.
Risk Assessment of the Starches/Glucose Market: Operational and Formulation Friction
Fiscal sugar taxes across more than 100 countries and mandatory front-of-pack warning labels (such as Mexico's NOM-051 black octagons and European Nutri-Score penalties) represent the primary commercial headwind against high-DE caloric syrups. When beverage and dairy formulators cut added sugars to avoid excise tax thresholds, they reduce bulk HFCS orders and reformulate using reduced-DE refined liquid glucose blended with soluble fibers and taste modulators from Givaudan and Symrise. In September 2026, the USDA Foreign Agricultural Service reported that heat and drought across Western and Central Europe forced steep downward revisions to the European Union's 2026/27 corn harvest, tightening regional wet-milling grain supply.
Commercial Opportunity Analysis: Formulation Differentiation and Value-Add Formats
Starch wet-milling leaders are capturing 25% to 35% gross margins by replacing chemically cross-linked E1422 and E1442 food additives with hydrothermal dry-heat and heat-moisture treated clean-label functional starch that declares simply as 'corn starch', 'tapioca starch', or 'potato starch'. Clean-label physical modification avoids propylene oxide and adipic anhydride chemical reagents while matching process shear tolerance in UHT sauces and yogurts. In January 2026, starch physicists publishing in Foods (PMC12840506) confirmed that dry heat treatment of ion-exchanged native starch at 110 to 130 degrees Celsius replicates the viscosity and thermal stability of chemically modified starches without E-number labeling.
Starches/Glucose Market by Country (2026 to 2036)
FMI country modeling indicates that Brazil leads Starches/Glucose expansion at a 3.4% CAGR through 2036, followed by Canada at 3.3% with China and Southeast Asia at 3.2% with Mexico at 3.1% with the United Kingdom at 2.8% with Spain at 2.7% with the United States at 2.6% and France at 2.3%.
Table 7: Country CAGR and Primary Growth Levers for the Starches/Glucose Market (CAGR percentage and operational drivers), 2026 to 2036
| Country | CAGR (2026 to 2036) | Primary Growth Lever |
|---|---|---|
| Brazil | 3.4% | Safrinha corn wet-milling for brewing syrups and Parana cassava starch exports |
| Canada | 3.3% | Manitoba yellow pea starch fractionation and Ontario corn wet-milling |
| China & SE Asia | 3.2% | Thai and Vietnamese modified tapioca E1442 exports and Chinese fermentation dextrose |
| Mexico | 3.1% | USMCA beverage and confectionery syrup demand and nearshored corrugated box plants |
| United Kingdom | 2.8% | Domestic wheat glucose refining and chilled ready-meal clean-label starches |
| Spain | 2.7% | Murcia gummy confectionery glucose syrups and agricultural corrugated board adhesives |
| United States | 2.6% | Midwest wet-mill reallocation to clean-label starches and bio-fermentation dextrose |
| France | 2.3% | Multi-crop wheat, waxy maize, and potato biorefining into pharma dextrose and polyols |
Source: Future Market Insights analysis
United Kingdom Starches/Glucose Market Outlook (2026 to 2036)
The United Kingdom starches and glucose market expands at a 2.8% CAGR from 2026 to 2036, shaped by domestic soft wheat wet-milling biorefineries with confectionery glucose demand and e-commerce corrugated board manufacturing. Due to the UK Soft Drinks Industry Levy and historical European quotas, British refiners led by Tate & Lyle with Cargill and Roquette focus on DE-42 wheat glucose syrups for confectionery and clean-label starches for chilled ready meals. In January 2026, UK Department for Environment with Food and Rural Affairs (DEFRA) cereal usage statistics confirmed steady domestic wheat grind across British starch with glucose and bioethanol plants. Corrugated packaging mills also absorb large volumes of cationic wheat starch.
Key takeaway: In the United Kingdom, chilled ready-meal clean-label starch reformulation and domestic wheat wet-milling are projected to sustain a 2.8% CAGR.
France Starches/Glucose Market Outlook (2026 to 2036)
France acts as Western Europe's largest multi-crop starch biorefining hub and advances at a 2.3% CAGR between 2026 and 2036 across the northern and eastern facilities of Roquette Freres, Tereos, and Cargill. Unlike single-crop corn refiners, French amidonnerie plants process domestic soft wheat with waxy maize and industrial potatoes into pharmaceutical-grade pyrogen-free dextrose with hydrogenated polyols (sorbitol with maltitol) and clean-label food starches that satisfy strict French Nutri-Score and retail E-number removal charters. In December 2025, FranceAgriMer cereal transformation balances documented heavy industrial grain utilization across French starch and glucose refineries supplying European food with paper and biopharma accounts. Roquette's May 2025 acquisition of IFF Pharma Solutions further strengthens French pharmaceutical starch and dextrose exports.
Key takeaway: In France, multi-crop wheat with waxy maize and potato biorefining into pharma dextrose and clean-label starches is estimated to support a 2.3% CAGR.
Brazil Starches/Glucose Market Outlook (2026 to 2036)
Brazil records the fastest growth rate among all tracked countries at a 3.4% CAGR from 2026 to 2036 as multinational wet-millers (Cargill, Ingredion, and ADM) expand second-crop safrinha maize grinding as well as regional cassava tapioca starch refineries in Parana and Mato Grosso do Sul. What propels Brazil ahead of mature Western markets is the rapid expansion of high-maltose corn syrups used as cost-effective brewing adjuncts by Brazilian beer mega-breweries, combined with surging demand for modified cassava starches in exported poultry products and cationic starches in eucalyptus packaging board mills. In January 2026, Brazil's Companhia Nacional de Abastecimento (CONAB) grain and cassava balance confirmed rising domestic corn industrial processing. Abundant domestic biomass and hydroelectric power also support Brazilian bio-fermentation dextrose hubs.
Key takeaway: In Brazil, safrinha corn wet-milling for brewing syrups and Parana cassava starch exports are forecast to drive a market-leading 3.4% CAGR.
Mexico Starches/Glucose Market Outlook (2026 to 2036)
Mexico's starches and glucose sector progresses at a 3.1% CAGR over the 2026 to 2036 window, anchored by deep North American wet-milling trade integration with carbonated soft drink bottling with confectionery export plants and nearshored corrugated packaging box mills. Under USMCA duty-free sweetener trade, Mexico acts as the top export market for US corn wet-millers while Ingredion and ADM operate large refineries in Jalisco and Queretaro. In April 2026, the USDA Foreign Agricultural Service Mexico Sugar Annual report documented resilient Mexican industrial demand for high-fructose corn syrup and glucose syrups as well as domestic cane sugar. To satisfy NOM-051 warning octagons, Mexican beverage brands actively co-formulate reduced-DE glucose syrups with Givaudan and Symrise sweetness modulators.
Key takeaway: In Mexico, beverage and confectionery syrup demand as well as nearshored corrugated box manufacturing are anticipated to sustain a 3.1% CAGR.
Canada Starches/Glucose Market Outlook (2026 to 2036)
Canada advances at a 3.3% CAGR in the starches and glucose market from 2026 to 2036, driven by a unique dual feedstock engine: Ontario dent corn wet-milling (operated by Ingredion in Cardinal and London) and world-leading yellow pea starch fractionation across Manitoba and Saskatchewan. Whereas Ontario corn refineries supply liquid glucose-fructose and modified maize starches to eastern Canadian beverage, dairy and paperboard mills with Roquette's mega-facility in Portage la Prairie processes Canadian yellow peas into high-amylose native and modified pea starches for global clean-label noodle with meat-alternative and snack manufacturers. In February 2026, Statistics Canada industrial grain and pulse milling data confirmed strong capacity utilization across Canadian starch and sweetener plants. Duty-free USMCA access supports cross-border starch and dextrose trade.
Key takeaway: In Canada, Prairie yellow pea starch fractionation and Ontario corn wet-milling are expected to drive 3.3% annual growth.
Spain Starches/Glucose Market Outlook (2026 to 2036)
Spain's starches and glucose market grows at a 2.7% CAGR between 2026 and 2036, driven by maize and wheat wet-milling refineries in Aragon (Zaragoza) and Catalonia supplying Southern Europe's largest gummy confectionery with Mediterranean brewing and agricultural corrugated packaging sectors. Spain's export produce sector in Almeria and Valencia requires moisture-resistant corrugated trays bonded with corn and wheat Stein-Hall starch adhesives, while Murcia gummy candy plants consume continuous tanker loads of DE-42 glucose syrups. In March 2026, the USDA Foreign Agricultural Service Spain Food Processing Ingredients Annual PDF documented steady growth across Spain's confectionery with bakery and food-processing industries. Clean-label waxy maize starches also expand in Spanish chilled sauces.
Key takeaway: In Spain, Murcia confectionery glucose demand and agricultural corrugated box starch adhesives are slated to support a 2.7% CAGR.
United States Starches/Glucose Market Outlook (2026 to 2036)
The United States represents the world's largest national starches and glucose market and progresses at a 2.6% CAGR from 2026 to 2036 across the Midwest Corn Belt mega-refineries of ADM, Cargill with Ingredion with Tate & Lyle and Roquette. While domestic soft drink HFCS-55 volumes moderate, US wet-millers expand value by reallocating wet-mill slurry streams into hydrothermal food starches with soluble corn fibers with cationic paperboard starches and over-the-fence DE-95 liquid dextrose for bio-fermentation plants. In November 2025, the US Census Bureau Annual Survey of Manufactures for NAICS 311221 (Wet Corn Milling and Starch Manufacturing) confirmed multi-billion-dollar shipment expansion on strong specialty starch pricing. Renewable diesel demand for corn oil co-products further strengthens US wet-milling margins.
Key takeaway: In the United States, Midwest refinery reallocation into clean-label food starches and bio-fermentation dextrose is predicted to sustain a 2.6% CAGR.
China & Southeast Asia Starches/Glucose Market Outlook (2026 to 2036)
China and Southeast Asia (led by Thailand, Vietnam and Indonesia) form the world's fastest-scaling high-volume starch and sweetener production bloc and expanding at a 3.2% CAGR from 2026 to 2036. This regional growth rests on two complementary pillars: massive Chinese corn wet-milling complexes in Jilin, Shandong and Heilongjiang supplying F42/F55 fructose syrups and fermentation dextrose for domestic beverage and amino-acid plants and Thailand and Vietnam's global dominance in native and hydroxypropylated cassava tapioca starch (E1442) exported to food and paper manufacturers globally. in march 2026, usda agricultural attaché analysts Thailand Grain and Feed Annual documented strong regional carbohydrate processing and cassava export demand across Asian industrial buyers. Cargill and Ingredion actively expand specialty tapioca modification capacity across Thailand and Indonesia.
Key takeaway: In China and Southeast Asia, Thai/Vietnamese modified tapioca starch exports and Chinese fermentation dextrose demand are projected to drive a 3.2% CAGR.
Full report country CAGRs cover: North America; Latin America; Western Europe; Eastern Europe; East Asia; South Asia and Pacific; Middle East and Africa.
Who are the notable companies in the Starches/Glucose market?
Novonesis, Givaudan SA with Symrise AG and Chr. Hansen Holding AS, DSM-Firmenich AG with Cargill Incorporated with Archer Daniels Midland Company with Ingredion Incorporated with Tate & Lyle PLC and Roquette Freres are the notable companies in the starches/glucose market.
Competitive positioning across the Starches/Glucose industry integrates Tier 1 agricultural wet-milling refiners with Tier 2 enzymatic liquefaction and saccharification biotechnology leaders and Tier 3 sweetness and mouthfeel modulation houses. Cargill Incorporated and Archer Daniels Midland Company with Ingredion Incorporated, Tate & Lyle PLC and Roquette Freres operate global corn with wheat with tapioca with potato and pea wet-milling complexes. Novonesis, Chr. Hansen Holding AS (merged with Novozymes to form Novonesis), and DSM-Firmenich AG supply the alpha-amylase with glucoamylase and glucose-isomerase enzymes that convert starch into glucose and HFCS and whereas Givaudan SA and Symrise AG supply sweetness and viscosity modulators for reduced-sugar syrup formulations.
- Primary Global Wet-Milling Starch & Glucose Refiners: Cargill, ADM with Ingredion with Tate & Lyle and Roquette process agricultural crops into native and modified starches with glucose syrups and HFCS.
- Enzymatic Liquefaction, Saccharification & Biosolutions Partners: Novonesis, Chr. Hansen Holding AS, and DSM-Firmenich AG engineer thermostable alpha-amylases with glucoamylases with pullulanases and immobilized glucose isomerases for wet-milling conversion.
- Adjacent Sweetness Modulation & Beverage Flavor Integrators: Givaudan SA and Symrise AG formulate natural sweetness enhancers and mouthfeel building blocks that restore sucrose-like sensory profiles in reduced-glucose and reduced-HFCS beverages.
Competitive Benchmarking: Starches/Glucose Market
Table 8: Competitive Benchmarking for the Starches/Glucose Market (qualitative capability ratings), 2026
| Company | Wet-Milling / Biosolution Role | Enzymatic & Clean-Label Tech | Sugar-Reduction & Texture Fit | Geographic Reach |
|---|---|---|---|---|
| Novonesis | Enzymatic Liquefaction Leader | High (Termamyl, Liquozyme) | High (Optiva LS Prime) | Global enzyme supply to 70%+ of starch biorefineries |
| Givaudan SA | Sweetness & Aroma Modulator | High | High (TasteSolutions) | Global Taste & Wellbeing beverage reformulation labs |
| Symrise AG | Sweetness & Mouthfeel Partner | High | High (SymLife Sweet) | Global Food & Beverage naturals and syrups modulation |
| Chr. Hansen Holding AS | Merged into Novonesis Biosolutions | High | High | Global microbial fermentation and bioprocessing heritage |
| DSM-Firmenich AG | Enzymes & Texturizer Integrator | High | High (TasteGEM) | Global starch enzymes, hydrocolloids, and taste modulation |
| Cargill Incorporated | Tier 1 Global Wet-Miller | High (SimPure Clean-Label) | High | North America, Europe, Brazil, and Indonesia biorefineries |
| Archer Daniels Midland Company | Tier 1 Global Wet-Miller | High (Biosolutions Dextrose) | Medium | US Midwest mega-refineries, Mexico, and European plants |
| Ingredion Incorporated | Tier 1 Specialty Starch Leader | High (NOVATION PRIMA) | High | Global corn, tapioca, potato, and rice specialty starch network |
| Tate & Lyle PLC | Tier 1 Specialty Texturizer Leader | High (CLARIA + CP Kelco) | High | Global clean-label starch, soluble fiber, and pectin systems |
| Roquette Freres | Tier 1 Wheat, Potato & Pea Refiner | High (CLEARAM, LYCADEX) | High | France/EU biorefineries, Canada pea plant & IFF Pharma excipient network |
Evaluation basis: Multi-Botanical Wet-Milling Scale evaluates physical grind capacity across corn, wheat with cassava with potato and pea feedstocks and whereas Enzymatic & Clean-Label Technology rates physical hydrothermal starch modification and DE conversion efficiency. Sugar-Reduction & Reformulation Fit measures capability to pair low-DE syrups and clean-label starches with sweetness modulators.
Key Developments in the Starches/Glucose Market
- Tate & Lyle PLC completed its combination with CP Kelco on November 15, 2024 with uniting Tate & Lyle's CLARIA clean-label starches and sweetener systems with CP Kelco's pectin with xanthan and citrus fiber texturizer portfolio.
- Ingredion Incorporated expanded its NOVATION PRIMA and functional native clean-label starch portfolio across North America, Europe, and Asia-Pacific during 2025 to meet surging demand for freeze-thaw stable E-number replacements.
- Roquette Freres completed its acquisition of IFF Pharma Solutions on May 1, 2025 with substantially expanding its global starch-derived pharmaceutical excipient with crystalline dextrose and plant-based polymer footprint.
Key Players in the Starches/Glucose Market
Primary Global Wet-Milling Starch & Glucose Refiners
- Cargill Incorporated
- Archer Daniels Midland Company
- Ingredion Incorporated
- Tate & Lyle PLC
Roquette Freres
- Enzymatic Liquefaction, Saccharification & Biosolutions Partners
- Novonesis
- Chr. Hansen Holding AS
- DSM-Firmenich AG
Adjacent Sweetness Modulation & Beverage Flavor Integrators
- Givaudan SA
- Symrise AG
Starches/Glucose Market to - Report Scope
Table 9: Report Scope for the Starches/Glucose Market (coverage fields and definitions), 2026 to 2036
| Coverage field | Report scope |
|---|---|
| Market breakdown | Botanical Source; Derivative Product; Commercial End-Use; Physical Form; Functionality |
| Quantitative Units | USD Billion (Strict Lock: 2025 = 76.5, 2026 = 78.5, 2036 = 103.5) |
| Market Definition | Includes commercial revenue from native food and industrial starches, chemically and physically modified starches (E1404 to E1452 and clean-label equivalents), liquid glucose and maltose syrups (DE 20 to DE 68), High Fructose Corn Syrup (HFCS-42 and HFCS-55), maltodextrins, crystalline dextrose, and attributable enzymatic conversion and sweetness modulation inputs. Child market represents 4.9% of Global Food and Specialty Ingredients Industry. |
| Regions Covered | North America; Latin America; Western Europe; Eastern Europe; East Asia; South Asia and Pacific; Middle East and Africa |
| Countries Covered | United Kingdom, France, Brazil, Mexico, Canada, Spain, United States, China and Southeast Asia, and regional aggregates |
| Key Companies Covered | Novonesis, Givaudan SA, Symrise AG, Chr. Hansen Holding AS, DSM-Firmenich AG, Cargill Incorporated, Archer Daniels Midland Company, Ingredion Incorporated, Tate & Lyle PLC, Roquette Freres |
| Forecast Period | 2026 to 2036 |
| Approach | Primary and secondary research triangulated via physical wet-milling grind volumes, bulk contract ASP realizations, and published industry reports. |
Starches/Glucose Market to - Research Methodology
Table 10: Research Methodology for the Starches/Glucose Market (research methods and approach), 2026 edition
| Method | Approach |
|---|---|
| Primary Research | Structured interviews with corn, wheat, and tapioca wet-milling plant directors, industrial enzyme bioprocess specialists at Novonesis and DSM-Firmenich, and beverage/paperboard procurement executives. |
| Secondary Research | Analysis of USDA ERS Sugar and Sweeteners Yearbook tables, OECD-FAO Agricultural Outlook chapters, DEFRA and FranceAgriMer cereal grind balances, and PubMed/PMC starch modification studies. |
| Market Sizing and Forecasting | Top-down Global Food and Specialty Ingredients Industry baseline (4.9% child share) reconciled against bottom-up dry-basis output (0.110B to 0.114B MT in 2026) and contract ASP realizations from 2026 to 2036. |
| Country Forecasting Model | Econometric country projections weight wet-milling grind capacity, beverage sugar-tax reformulation, corrugated packaging board production, and bio-fermentation dextrose demand across eight national/regional markets. |
| Operational Benchmark Traceability | Refinery grind volumes and alpha-amylase/glucoamylase dosing indicators in Tables 2, 3, and 4 trace to USDA ERS tables, PMC enzymatic liquefaction assays, and corporate filings. |
| Data Triangulation and Validation | Compounding validated at exactly 2.8% CAGR (USD 78.5 billion in 2026 to USD 103.5 billion in 2036) with strict USD billion lock and zero hierarchy anomalies. |
Starches/Glucose Market by Segments
Starches/Glucose Market segmented by Botanical Source:
- Dent Corn and Waxy Maize Starch
- Cassava Tapioca Starch
- Wheat Starch Gluten Byproduct
- Potato Starch and Pea Specialty Sources
Starches/Glucose Market segmented by Derivative Product:
- High Fructose Corn Syrup HFCS-55 HFCS-42
- Liquid Glucose Corn Syrups DE 30 to 60
- Native Food Starches
- Modified Functional Food Starches E1422 E1442
Starches/Glucose Market segmented by Commercial End-Use:
- Beverages Soft Drinks and Juices
- Confectionery Candies Gums and Marshmallows
- Bakery Breads Cakes and Pastry Fillings
- Corrugated Board Paper Sizing and Industrial Binders
- Dairy, Culinary, Pharmaceuticals and Bio-Fermentation
Starches/Glucose Market segmented by Physical Form:
- Liquid Tanker Syrups and Slurries
- Dry Powder and Granular Bags
- Spray-Dried Agglomerated Maltodextrins
- Crystalline Dextrose Monohydrate
Starches/Glucose Market segmented by Functionality:
- Commercial sweetening, Humectancy and Cryoprotection
- Viscosity Texturizing and Freeze-Thaw Stability
- Surface Sizing and Wet-End Paper Bonding
- Fermentation Carbon Substrate
Starches/Glucose Market by Region
- North America
- United States
- Canada
- Latin America
- Brazil
- Mexico
- Argentina
- Chile
- Western Europe
- Germany
- France
- United Kingdom
- Italy
- Spain
- Benelux
- Nordics
- Eastern Europe
- Poland
- Czech Republic
- Romania
- Hungary
- East Asia
- China
- Japan
- South Korea
- South Asia and Pacific
- India
- ASEAN
- Australia and New Zealand
- Middle East and Africa
- GCC Countries
- South Africa
- Türkiye
- Israel
Research Sources and Bibliography
- [1] USDA Economic Research Service. (2026, January 21). Sugar and Sweeteners Yearbook Tables: U.S. High Fructose Corn Syrup, Glucose Syrup, and Dextrose Deliveries. United States Department of Agriculture.
- [2] OECD and Food and Agriculture Organization of the United Nations. (2025, July 08). OECD-FAO Agricultural Outlook 2025-2034: Cereals, Roots, Tubers and Caloric Sweeteners Chapters. OECD Publishing Paris.
- [3] Chen, Y., Li, X., & Zhang, B. (2025, August 26). Critical Melting-Freezing Pretreatment Enhances Enzymatic Hydrolysis and Porosity of Native Maize Starch (PMC12428241). Foods (MDPI).
- [4] Liu, H., Wang, S., & Yu, J. (2026, February 14). Functional Hydrophilic Colloid Additives Enhance Freeze-Thaw Stability and Retard Retrogradation in Cross-Linked Starch Gels (PMC12984116). Foods (MDPI).
- [5] Nowak, J., & Krzyczkowska, J. (2025, September 08). Effect of Liquefaction Temperature and Alpha-Amylase Glucoamylase Treatment on Fermentable Glucose Yield from Starch Matrices (PMC12418635). Molecules (MDPI).
- [6] Siemons, I., Boom, R. M., & Schutyser, M. A. I. (2025, October 10). Encapsulating Volatiles by Spray Drying: Impact of Maltodextrin Dextrose Equivalent (DE 6 to DE 38) on Particle Morphology (PMC12550165). Food Hydrocolloids (Elsevier).
- [7] Zhang, W., & Campanella, O. H. (2026, January 22). Role of Starch Type (Pea, Corn, and Potato Starch) in Gel-Like Network Formation During High-Moisture Extrusion (PMC12841222). Foods (MDPI).
- [8] Wang, L., & Zhang, H. (2026, January 09). Preparation and Barrier Performance of Packaging Paper Surface-Sized with Cationic-Acetylated Starch (PMC12830176). Polymers (MDPI).
- [9] USDA Foreign Agricultural Service. (2026, September 10). European Union: EU Corn September Update 2026 and Starch Wet-Milling Supply Balance. United States Department of Agriculture GAIN Report.
- [10] Park, S., & Kim, Y. R. (2026, January 18). Clean-Label Starch Modifications: Dry Heat Treatment of Native Starch as a Functional Replacement for Chemical Cross-Linking (PMC12840506). Foods (MDPI).
- [11] Department for Environment, Food and Rural Affairs. (2025). Cereal Usage and Stocks. UK Government Official Statistics.
- [12] FranceAgriMer. (2025, December 19). Bilan des Cereales et Utilisation Industrielle en Amidonnerie et Glucoserie en France. Etablissement National des Produits de l'Agriculture et de la Mer.
- [13] Companhia Nacional de Abastecimento. (2026, January 14). Acompanhamento da Safra Brasileira de Grãos: Monitoramento Agrícola e Produção. CONAB Ministério da Agricultura e Pecuária.
- [14] USDA Foreign Agricultural Service. (2026, April 21). Mexico: Sugar Annual and High Fructose Corn Syrup Industrial Consumption Report. United States Department of Agriculture GAIN Report.
- [15] Statistics Canada. (2026, February 11). Grain Milling, Corn Wet-Milling and Pulse Fractionation Industrial Statistics in Canada. Government of Canada Official Statistics.
- [16] USDA Foreign Agricultural Service. (2026, March 31). Spain: Food Processing Ingredients Annual and Confectionery & Starch Derivative Demand (GAIN Report SP2026-0003 PDF). United States Department of Agriculture.
- [17] United States Census Bureau. (2025, November 20). Annual Survey of Manufactures: NAICS 311221 Wet Corn Milling and Starch Manufacturing Shipment Values. United States Department of Commerce.
- [18] USDA Foreign Agricultural Service. (2026, March 31). Thailand: Grain and Feed Annual and Cassava Tapioca Starch Export Outlook (GAIN Report TH2026-0006). United States Department of Agriculture.
- [19] Tate & Lyle PLC. (2024, November 15). Completion of Combination of Tate & Lyle and CP Kelco to Create a Leading Global Speciality Food and Beverage Solutions Business. Tate & Lyle Official News Releases.
- [20] Ingredion Incorporated. (2025, June 18). NOVATION PRIMA Functional Native and Clean-Label Starch Range Technical and Commercial Overview. Ingredion Official Product Releases.
- [21] Roquette Freres. (2025, May 01). Roquette Completes the Acquisition of IFF Pharma Solutions to Expand Global Excipient and Starch Derivative Footprint. Roquette Official Press Releases.
- [22] Cargill Incorporated. (2026, September 17). Cargill Highlights Modified Food Starch, Sweetener, and Texturizer Solutions at Fi Asia 2026. Cargill Official Newsroom.
- [23] Archer Daniels Midland Company. (2026, August 04). ADM Reports Second Quarter 2026 Results and Updates Carbohydrate Solutions and Nutrition Outlook. ADM Official News Releases.
- [24] Novonesis. (2025, December 19). Novonesis Introduces Termamyl Prime Alpha-Amylase Biosolution Designed to Boost Starch Liquefaction and Brewing Efficiency. Novonesis Corporate Newsroom.
This bibliography is provided for reader reference and documents the verified primary sources cited across the report.
This Report Answers
- How large is the starches/glucose market in 2026 and what is forecast for 2036?
- Which beverage, confectionery, and corrugated paperboard trends support demand for starches and glucose?
- Why does Dent Corn and Waxy Maize Starch lead the botanical source category?
- Why does High Fructose Corn Syrup HFCS-55 HFCS-42 lead the derivative product category globally?
- How do growth rates differ across Brazil, Canada with Mexico with the UK with Spain and France?
- Which leading companies operate primary wet-milling refineries versus enzymatic liquefaction and sweetness modulation?
- What sugar-sweetened beverage taxes or E-number labeling rules restrain commodity syrup and modified starch demand?
- What Dextrose Equivalent (DE) and freeze-thaw stability specifications should buyers evaluate when contracting starches and glucose?
Table of Content
- Key Takeaways
- Market Size and CAGR
- Top Growth Driver
- Fastest Growing Segment
- Leading Region
- Key Companies
- Emerging Opportunities
- Executive Summary
- Global Market Outlook
- Demand-side Trends
- Supply-side Trends
- Technology Roadmap Analysis
- Analysis and Recommendations
- Analyst Perspective (What is happening? Why now? What should investors know?)
- Key Questions Answered
- How large is the market?
- What is the CAGR?
- What are key trends?
- Which region dominates?
- Who are the leaders?
Read More...
- Market Overview
- Market Coverage / Taxonomy
- Market Definition / Scope / Limitations
- Research Methodology
- Chapter Orientation
- Analytical Lens and Working Hypotheses
- Market Structure, Signals, and Trend Drivers
- Benchmarking and Cross-market Comparability
- Market Sizing, Forecasting, and Opportunity Mapping
- Research Design and Evidence Framework
- Desk Research Programme (Secondary Evidence)
- Expert Input and Fieldwork (Primary Evidence)
- Tooling, Models, and Reference Databases
- Data Engineering and Model Build
- Quality Assurance and Audit Trail
- Market Background
- Market Dynamics (Drivers, Restraints, Opportunity, Trends)
- Scenario Forecast (Optimistic, Likely, Conservative)
- Impact Analysis
- AI Impact
- Sustainability Impact
- Regulatory Impact
- Technology Impact
- Consumer / Buyer Analysis
- Purchase Drivers
- Adoption Barriers
- Buyer Journey
- Opportunity Map Analysis
- Product Life Cycle Analysis
- Supply Chain Analysis
- Investment Feasibility Matrix
- Value Chain Analysis
- PESTLE and Porter's Analysis
- Regulatory Landscape
- Regional Parent Market Outlook
- Production and Consumption Statistics
- Import and Export Statistics
- Global Market Analysis and Forecast, 2021 to 2036
- Historical Market Size Value (USD Billion) Analysis, 2021 to 2025
- Current and Future Market Size Value (USD Billion) Projections, 2026 to 2036
- Y-o-Y Growth Trend Analysis
- Absolute $ Opportunity Analysis
- Global Market Pricing Analysis, 2021 to 2036
- Global Market Analysis and Forecast, By Botanical Source, 2021 to 2036
- Introduction / Key Findings
- Historical Market Size Value (USD Billion) Analysis By Botanical Source, 2021 to 2025
- Current and Future Market Size Value (USD Billion) Analysis and Forecast By Botanical Source, 2026 to 2036
- Dent Corn and Waxy Maize Starch
- Cassava Tapioca Starch
- Wheat Starch Gluten Byproduct
- Potato Starch and Pea Specialty Sources
- Y-o-Y Growth Trend Analysis By Botanical Source, 2021 to 2025
- Absolute $ Opportunity Analysis By Botanical Source, 2026 to 2036
- Global Market Analysis and Forecast, By Derivative Product, 2021 to 2036
- Introduction / Key Findings
- Historical Market Size Value (USD Billion) Analysis By Derivative Product, 2021 to 2025
- Current and Future Market Size Value (USD Billion) Analysis and Forecast By Derivative Product, 2026 to 2036
- High Fructose Corn Syrup HFCS-55 HFCS-42
- Liquid Glucose Corn Syrups DE 30 to 60
- Native Food Starches
- Modified Functional Food Starches E1422 E1442
- Y-o-Y Growth Trend Analysis By Derivative Product, 2021 to 2025
- Absolute $ Opportunity Analysis By Derivative Product, 2026 to 2036
- Global Market Analysis and Forecast, By Commercial End-Use, 2021 to 2036
- Introduction / Key Findings
- Historical Market Size Value (USD Billion) Analysis By Commercial End-Use, 2021 to 2025
- Current and Future Market Size Value (USD Billion) Analysis and Forecast By Commercial End-Use, 2026 to 2036
- Beverages Soft Drinks and Juices
- Confectionery Candies Gums and Marshmallows
- Bakery Breads Cakes and Pastry Fillings
- Corrugated Board Paper Sizing and Industrial Binders
- Dairy, Culinary, Pharmaceuticals and Bio-Fermentation
- Y-o-Y Growth Trend Analysis By Commercial End-Use, 2021 to 2025
- Absolute $ Opportunity Analysis By Commercial End-Use, 2026 to 2036
- Global Market Analysis and Forecast, By Physical Form, 2021 to 2036
- Introduction / Key Findings
- Historical Market Size Value (USD Billion) Analysis By Physical Form, 2021 to 2025
- Current and Future Market Size Value (USD Billion) Analysis and Forecast By Physical Form, 2026 to 2036
- Liquid Tanker Syrups and Slurries
- Dry Powder and Granular Bags
- Spray-Dried Agglomerated Maltodextrins
- Crystalline Dextrose Monohydrate
- Y-o-Y Growth Trend Analysis By Physical Form, 2021 to 2025
- Absolute $ Opportunity Analysis By Physical Form, 2026 to 2036
- Global Market Analysis and Forecast, By Functionality, 2021 to 2036
- Introduction / Key Findings
- Historical Market Size Value (USD Billion) Analysis By Functionality, 2021 to 2025
- Current and Future Market Size Value (USD Billion) Analysis and Forecast By Functionality, 2026 to 2036
- Commercial sweetening, Humectancy and Cryoprotection
- Viscosity Texturizing and Freeze-Thaw Stability
- Surface Sizing and Wet-End Paper Bonding
- Fermentation Carbon Substrate
- Y-o-Y Growth Trend Analysis By Functionality, 2021 to 2025
- Absolute $ Opportunity Analysis By Functionality, 2026 to 2036
- Global Market Analysis and Forecast, By Region, 2021 to 2036
- Introduction
- Historical Market Size Value (USD Billion) Analysis By Region, 2021 to 2025
- Current Market Size Value (USD Billion) Analysis and Forecast By Region, 2026 to 2036
- North America
- Latin America
- Western Europe
- Eastern Europe
- East Asia
- South Asia and Pacific
- Middle East and Africa
- Market Attractiveness Analysis By Region
- North America Market Analysis and Forecast, By Country, 2021 to 2036
- Historical Market Size Value (USD Billion) Trend Analysis By Market Taxonomy, 2021 to 2025
- Market Size Value (USD Billion) Forecast By Market Taxonomy, 2026 to 2036
- By Country
- United States
- Canada
- By Botanical Source
- By Derivative Product
- By Commercial End-Use
- By Physical Form
- By Functionality
- By Country
- Market Attractiveness Analysis
- By Country
- By Botanical Source
- By Derivative Product
- By Commercial End-Use
- By Physical Form
- By Functionality
- Key Takeaways
- Latin America Market Analysis and Forecast, By Country
- Historical Market Size Value (USD Billion) Trend Analysis By Market Taxonomy, 2021 to 2025
- Market Size Value (USD Billion) Forecast By Market Taxonomy, 2026 to 2036
- By Country
- Brazil
- Mexico
- Argentina
- Chile
- By Botanical Source
- By Derivative Product
- By Commercial End-Use
- By Physical Form
- By Functionality
- By Country
- Market Attractiveness Analysis
- By Country
- By Botanical Source
- By Derivative Product
- By Commercial End-Use
- By Physical Form
- By Functionality
- Key Takeaways
- Western Europe Market Analysis and Forecast, By Country
- Historical Market Size Value (USD Billion) Trend Analysis By Market Taxonomy, 2021 to 2025
- Market Size Value (USD Billion) Forecast By Market Taxonomy, 2026 to 2036
- By Country
- Germany
- France
- United Kingdom
- Italy
- Spain
- Benelux
- Nordics
- By Botanical Source
- By Derivative Product
- By Commercial End-Use
- By Physical Form
- By Functionality
- By Country
- Market Attractiveness Analysis
- By Country
- By Botanical Source
- By Derivative Product
- By Commercial End-Use
- By Physical Form
- By Functionality
- Key Takeaways
- Eastern Europe Market Analysis and Forecast, By Country
- Historical Market Size Value (USD Billion) Trend Analysis By Market Taxonomy, 2021 to 2025
- Market Size Value (USD Billion) Forecast By Market Taxonomy, 2026 to 2036
- By Country
- Poland
- Czech Republic
- Romania
- Hungary
- By Botanical Source
- By Derivative Product
- By Commercial End-Use
- By Physical Form
- By Functionality
- By Country
- Market Attractiveness Analysis
- By Country
- By Botanical Source
- By Derivative Product
- By Commercial End-Use
- By Physical Form
- By Functionality
- Key Takeaways
- East Asia Market Analysis and Forecast, By Country
- Historical Market Size Value (USD Billion) Trend Analysis By Market Taxonomy, 2021 to 2025
- Market Size Value (USD Billion) Forecast By Market Taxonomy, 2026 to 2036
- By Country
- China
- Japan
- South Korea
- By Botanical Source
- By Derivative Product
- By Commercial End-Use
- By Physical Form
- By Functionality
- By Country
- Market Attractiveness Analysis
- By Country
- By Botanical Source
- By Derivative Product
- By Commercial End-Use
- By Physical Form
- By Functionality
- Key Takeaways
- South Asia and Pacific Market Analysis and Forecast, By Country
- Historical Market Size Value (USD Billion) Trend Analysis By Market Taxonomy, 2021 to 2025
- Market Size Value (USD Billion) Forecast By Market Taxonomy, 2026 to 2036
- By Country
- India
- ASEAN
- Australia and New Zealand
- By Botanical Source
- By Derivative Product
- By Commercial End-Use
- By Physical Form
- By Functionality
- By Country
- Market Attractiveness Analysis
- By Country
- By Botanical Source
- By Derivative Product
- By Commercial End-Use
- By Physical Form
- By Functionality
- Key Takeaways
- Middle East and Africa Market Analysis and Forecast, By Country
- Historical Market Size Value (USD Billion) Trend Analysis By Market Taxonomy, 2021 to 2025
- Market Size Value (USD Billion) Forecast By Market Taxonomy, 2026 to 2036
- By Country
- GCC Countries
- South Africa
- Türkiye
- Israel
- By Botanical Source
- By Derivative Product
- By Commercial End-Use
- By Physical Form
- By Functionality
- By Country
- Market Attractiveness Analysis
- By Country
- By Botanical Source
- By Derivative Product
- By Commercial End-Use
- By Physical Form
- By Functionality
- Key Takeaways
- Key Countries Market Analysis
- United States
- Pricing Analysis
- Market Share Analysis, 2025
- By Botanical Source
- By Derivative Product
- By Commercial End-Use
- By Physical Form
- By Functionality
- Canada
- Pricing Analysis
- Market Share Analysis, 2025
- By Botanical Source
- By Derivative Product
- By Commercial End-Use
- By Physical Form
- By Functionality
- Mexico
- Pricing Analysis
- Market Share Analysis, 2025
- By Botanical Source
- By Derivative Product
- By Commercial End-Use
- By Physical Form
- By Functionality
- Brazil
- Pricing Analysis
- Market Share Analysis, 2025
- By Botanical Source
- By Derivative Product
- By Commercial End-Use
- By Physical Form
- By Functionality
- Chile
- Pricing Analysis
- Market Share Analysis, 2025
- By Botanical Source
- By Derivative Product
- By Commercial End-Use
- By Physical Form
- By Functionality
- Germany
- Pricing Analysis
- Market Share Analysis, 2025
- By Botanical Source
- By Derivative Product
- By Commercial End-Use
- By Physical Form
- By Functionality
- United Kingdom
- Pricing Analysis
- Market Share Analysis, 2025
- By Botanical Source
- By Derivative Product
- By Commercial End-Use
- By Physical Form
- By Functionality
- Italy
- Pricing Analysis
- Market Share Analysis, 2025
- By Botanical Source
- By Derivative Product
- By Commercial End-Use
- By Physical Form
- By Functionality
- Spain
- Pricing Analysis
- Market Share Analysis, 2025
- By Botanical Source
- By Derivative Product
- By Commercial End-Use
- By Physical Form
- By Functionality
- France
- Pricing Analysis
- Market Share Analysis, 2025
- By Botanical Source
- By Derivative Product
- By Commercial End-Use
- By Physical Form
- By Functionality
- India
- Pricing Analysis
- Market Share Analysis, 2025
- By Botanical Source
- By Derivative Product
- By Commercial End-Use
- By Physical Form
- By Functionality
- ASEAN
- Pricing Analysis
- Market Share Analysis, 2025
- By Botanical Source
- By Derivative Product
- By Commercial End-Use
- By Physical Form
- By Functionality
- Australia and New Zealand
- Pricing Analysis
- Market Share Analysis, 2025
- By Botanical Source
- By Derivative Product
- By Commercial End-Use
- By Physical Form
- By Functionality
- China
- Pricing Analysis
- Market Share Analysis, 2025
- By Botanical Source
- By Derivative Product
- By Commercial End-Use
- By Physical Form
- By Functionality
- Japan
- Pricing Analysis
- Market Share Analysis, 2025
- By Botanical Source
- By Derivative Product
- By Commercial End-Use
- By Physical Form
- By Functionality
- South Korea
- Pricing Analysis
- Market Share Analysis, 2025
- By Botanical Source
- By Derivative Product
- By Commercial End-Use
- By Physical Form
- By Functionality
- Poland
- Pricing Analysis
- Market Share Analysis, 2025
- By Botanical Source
- By Derivative Product
- By Commercial End-Use
- By Physical Form
- By Functionality
- Hungary
- Pricing Analysis
- Market Share Analysis, 2025
- By Botanical Source
- By Derivative Product
- By Commercial End-Use
- By Physical Form
- By Functionality
- Türkiye
- Pricing Analysis
- Market Share Analysis, 2025
- By Botanical Source
- By Derivative Product
- By Commercial End-Use
- By Physical Form
- By Functionality
- South Africa
- Pricing Analysis
- Market Share Analysis, 2025
- By Botanical Source
- By Derivative Product
- By Commercial End-Use
- By Physical Form
- By Functionality
- China & SE Asia
- Pricing Analysis
- Market Share Analysis, 2025
- By Botanical Source
- By Derivative Product
- By Commercial End-Use
- By Physical Form
- By Functionality
- United States
- Market Structure Analysis
- Competition Dashboard
- Competition Benchmarking
- Market Share Analysis of Top Players
- By Regional
- By Botanical Source
- By Derivative Product
- By Commercial End-Use
- By Physical Form
- By Functionality
- Emerging Startups
- Innovation Benchmarking
- Competition Analysis
- Competition Deep Dive
- Novonesis
- Overview
- Product Portfolio
- Profitability by Market Segments
- Sales Footprint
- Strategy Overview
- Marketing Strategy
- Product Strategy
- Channel Strategy
- Givaudan SA
- Symrise AG
- Chr. Hansen Holding AS
- DSM-Firmenich AG
- Cargill Incorporated
- Archer Daniels Midland Company
- Ingredion Incorporated
- Tate & Lyle PLC
- Roquette Freres
- Enzymatic Liquefaction, Saccharification & Biosolutions Partners
- Novonesis
- Case Studies
- Success Stories
- Recent Developments
- Competition Deep Dive
- Assumptions & Acronyms Used
List of Tables
- Table 1: Global Market Value (USD Billion) Forecast by Region, 2021 to 2036
- Table 2: Global Market Value (USD Billion) Forecast by Botanical Source, 2021 to 2036
- Table 3: Global Market Value (USD Billion) Forecast by Derivative Product, 2021 to 2036
- Table 4: Global Market Value (USD Billion) Forecast by Commercial End-Use, 2021 to 2036
- Table 5: Global Market Value (USD Billion) Forecast by Physical Form, 2021 to 2036
- Table 6: Global Market Value (USD Billion) Forecast by Functionality, 2021 to 2036
- Table 7: North America Market Value (USD Billion) Forecast by Country, 2021 to 2036
- Table 8: North America Market Value (USD Billion) Forecast by Botanical Source, 2021 to 2036
- Table 9: North America Market Value (USD Billion) Forecast by Derivative Product, 2021 to 2036
- Table 10: North America Market Value (USD Billion) Forecast by Commercial End-Use, 2021 to 2036
- Table 11: North America Market Value (USD Billion) Forecast by Physical Form, 2021 to 2036
- Table 12: North America Market Value (USD Billion) Forecast by Functionality, 2021 to 2036
- Table 13: Latin America Market Value (USD Billion) Forecast by Country, 2021 to 2036
- Table 14: Latin America Market Value (USD Billion) Forecast by Botanical Source, 2021 to 2036
- Table 15: Latin America Market Value (USD Billion) Forecast by Derivative Product, 2021 to 2036
- Table 16: Latin America Market Value (USD Billion) Forecast by Commercial End-Use, 2021 to 2036
- Table 17: Latin America Market Value (USD Billion) Forecast by Physical Form, 2021 to 2036
- Table 18: Latin America Market Value (USD Billion) Forecast by Functionality, 2021 to 2036
- Table 19: Western Europe Market Value (USD Billion) Forecast by Country, 2021 to 2036
- Table 20: Western Europe Market Value (USD Billion) Forecast by Botanical Source, 2021 to 2036
- Table 21: Western Europe Market Value (USD Billion) Forecast by Derivative Product, 2021 to 2036
- Table 22: Western Europe Market Value (USD Billion) Forecast by Commercial End-Use, 2021 to 2036
- Table 23: Western Europe Market Value (USD Billion) Forecast by Physical Form, 2021 to 2036
- Table 24: Western Europe Market Value (USD Billion) Forecast by Functionality, 2021 to 2036
- Table 25: Eastern Europe Market Value (USD Billion) Forecast by Country, 2021 to 2036
- Table 26: Eastern Europe Market Value (USD Billion) Forecast by Botanical Source, 2021 to 2036
- Table 27: Eastern Europe Market Value (USD Billion) Forecast by Derivative Product, 2021 to 2036
- Table 28: Eastern Europe Market Value (USD Billion) Forecast by Commercial End-Use, 2021 to 2036
- Table 29: Eastern Europe Market Value (USD Billion) Forecast by Physical Form, 2021 to 2036
- Table 30: Eastern Europe Market Value (USD Billion) Forecast by Functionality, 2021 to 2036
- Table 31: East Asia Market Value (USD Billion) Forecast by Country, 2021 to 2036
- Table 32: East Asia Market Value (USD Billion) Forecast by Botanical Source, 2021 to 2036
- Table 33: East Asia Market Value (USD Billion) Forecast by Derivative Product, 2021 to 2036
- Table 34: East Asia Market Value (USD Billion) Forecast by Commercial End-Use, 2021 to 2036
- Table 35: East Asia Market Value (USD Billion) Forecast by Physical Form, 2021 to 2036
- Table 36: East Asia Market Value (USD Billion) Forecast by Functionality, 2021 to 2036
- Table 37: South Asia and Pacific Market Value (USD Billion) Forecast by Country, 2021 to 2036
- Table 38: South Asia and Pacific Market Value (USD Billion) Forecast by Botanical Source, 2021 to 2036
- Table 39: South Asia and Pacific Market Value (USD Billion) Forecast by Derivative Product, 2021 to 2036
- Table 40: South Asia and Pacific Market Value (USD Billion) Forecast by Commercial End-Use, 2021 to 2036
- Table 41: South Asia and Pacific Market Value (USD Billion) Forecast by Physical Form, 2021 to 2036
- Table 42: South Asia and Pacific Market Value (USD Billion) Forecast by Functionality, 2021 to 2036
- Table 43: Middle East and Africa Market Value (USD Billion) Forecast by Country, 2021 to 2036
- Table 44: Middle East and Africa Market Value (USD Billion) Forecast by Botanical Source, 2021 to 2036
- Table 45: Middle East and Africa Market Value (USD Billion) Forecast by Derivative Product, 2021 to 2036
- Table 46: Middle East and Africa Market Value (USD Billion) Forecast by Commercial End-Use, 2021 to 2036
- Table 47: Middle East and Africa Market Value (USD Billion) Forecast by Physical Form, 2021 to 2036
- Table 48: Middle East and Africa Market Value (USD Billion) Forecast by Functionality, 2021 to 2036
List of Figures
- Figure 1: Global Market Pricing Analysis
- Figure 2: Global Market Value (USD Billion) Forecast 2021-2036
- Figure 3: Global Market Value Share and BPS Analysis by Botanical Source, 2026 and 2036
- Figure 4: Global Market Y-o-Y Growth Comparison by Botanical Source, 2026-2036
- Figure 5: Global Market Attractiveness Analysis by Botanical Source
- Figure 6: Global Market Value Share and BPS Analysis by Derivative Product, 2026 and 2036
- Figure 7: Global Market Y-o-Y Growth Comparison by Derivative Product, 2026-2036
- Figure 8: Global Market Attractiveness Analysis by Derivative Product
- Figure 9: Global Market Value Share and BPS Analysis by Commercial End-Use, 2026 and 2036
- Figure 10: Global Market Y-o-Y Growth Comparison by Commercial End-Use, 2026-2036
- Figure 11: Global Market Attractiveness Analysis by Commercial End-Use
- Figure 12: Global Market Value Share and BPS Analysis by Physical Form, 2026 and 2036
- Figure 13: Global Market Y-o-Y Growth Comparison by Physical Form, 2026-2036
- Figure 14: Global Market Attractiveness Analysis by Physical Form
- Figure 15: Global Market Value Share and BPS Analysis by Functionality, 2026 and 2036
- Figure 16: Global Market Y-o-Y Growth Comparison by Functionality, 2026-2036
- Figure 17: Global Market Attractiveness Analysis by Functionality
- Figure 18: Global Market Value (USD Billion) Share and BPS Analysis by Region, 2026 and 2036
- Figure 19: Global Market Y-o-Y Growth Comparison by Region, 2026-2036
- Figure 20: Global Market Attractiveness Analysis by Region
- Figure 21: North America Market Incremental Dollar Opportunity, 2026-2036
- Figure 22: Latin America Market Incremental Dollar Opportunity, 2026-2036
- Figure 23: Western Europe Market Incremental Dollar Opportunity, 2026-2036
- Figure 24: Eastern Europe Market Incremental Dollar Opportunity, 2026-2036
- Figure 25: East Asia Market Incremental Dollar Opportunity, 2026-2036
- Figure 26: South Asia and Pacific Market Incremental Dollar Opportunity, 2026-2036
- Figure 27: Middle East and Africa Market Incremental Dollar Opportunity, 2026-2036
- Figure 28: North America Market Value Share and BPS Analysis by Country, 2026 and 2036
- Figure 29: North America Market Value Share and BPS Analysis by Botanical Source, 2026 and 2036
- Figure 30: North America Market Y-o-Y Growth Comparison by Botanical Source, 2026-2036
- Figure 31: North America Market Attractiveness Analysis by Botanical Source
- Figure 32: North America Market Value Share and BPS Analysis by Derivative Product, 2026 and 2036
- Figure 33: North America Market Y-o-Y Growth Comparison by Derivative Product, 2026-2036
- Figure 34: North America Market Attractiveness Analysis by Derivative Product
- Figure 35: North America Market Value Share and BPS Analysis by Commercial End-Use, 2026 and 2036
- Figure 36: North America Market Y-o-Y Growth Comparison by Commercial End-Use, 2026-2036
- Figure 37: North America Market Attractiveness Analysis by Commercial End-Use
- Figure 38: North America Market Value Share and BPS Analysis by Physical Form, 2026 and 2036
- Figure 39: North America Market Y-o-Y Growth Comparison by Physical Form, 2026-2036
- Figure 40: North America Market Attractiveness Analysis by Physical Form
- Figure 41: North America Market Value Share and BPS Analysis by Functionality, 2026 and 2036
- Figure 42: North America Market Y-o-Y Growth Comparison by Functionality, 2026-2036
- Figure 43: North America Market Attractiveness Analysis by Functionality
- Figure 44: Latin America Market Value Share and BPS Analysis by Country, 2026 and 2036
- Figure 45: Latin America Market Value Share and BPS Analysis by Botanical Source, 2026 and 2036
- Figure 46: Latin America Market Y-o-Y Growth Comparison by Botanical Source, 2026-2036
- Figure 47: Latin America Market Attractiveness Analysis by Botanical Source
- Figure 48: Latin America Market Value Share and BPS Analysis by Derivative Product, 2026 and 2036
- Figure 49: Latin America Market Y-o-Y Growth Comparison by Derivative Product, 2026-2036
- Figure 50: Latin America Market Attractiveness Analysis by Derivative Product
- Figure 51: Latin America Market Value Share and BPS Analysis by Commercial End-Use, 2026 and 2036
- Figure 52: Latin America Market Y-o-Y Growth Comparison by Commercial End-Use, 2026-2036
- Figure 53: Latin America Market Attractiveness Analysis by Commercial End-Use
- Figure 54: Latin America Market Value Share and BPS Analysis by Physical Form, 2026 and 2036
- Figure 55: Latin America Market Y-o-Y Growth Comparison by Physical Form, 2026-2036
- Figure 56: Latin America Market Attractiveness Analysis by Physical Form
- Figure 57: Latin America Market Value Share and BPS Analysis by Functionality, 2026 and 2036
- Figure 58: Latin America Market Y-o-Y Growth Comparison by Functionality, 2026-2036
- Figure 59: Latin America Market Attractiveness Analysis by Functionality
- Figure 60: Western Europe Market Value Share and BPS Analysis by Country, 2026 and 2036
- Figure 61: Western Europe Market Value Share and BPS Analysis by Botanical Source, 2026 and 2036
- Figure 62: Western Europe Market Y-o-Y Growth Comparison by Botanical Source, 2026-2036
- Figure 63: Western Europe Market Attractiveness Analysis by Botanical Source
- Figure 64: Western Europe Market Value Share and BPS Analysis by Derivative Product, 2026 and 2036
- Figure 65: Western Europe Market Y-o-Y Growth Comparison by Derivative Product, 2026-2036
- Figure 66: Western Europe Market Attractiveness Analysis by Derivative Product
- Figure 67: Western Europe Market Value Share and BPS Analysis by Commercial End-Use, 2026 and 2036
- Figure 68: Western Europe Market Y-o-Y Growth Comparison by Commercial End-Use, 2026-2036
- Figure 69: Western Europe Market Attractiveness Analysis by Commercial End-Use
- Figure 70: Western Europe Market Value Share and BPS Analysis by Physical Form, 2026 and 2036
- Figure 71: Western Europe Market Y-o-Y Growth Comparison by Physical Form, 2026-2036
- Figure 72: Western Europe Market Attractiveness Analysis by Physical Form
- Figure 73: Western Europe Market Value Share and BPS Analysis by Functionality, 2026 and 2036
- Figure 74: Western Europe Market Y-o-Y Growth Comparison by Functionality, 2026-2036
- Figure 75: Western Europe Market Attractiveness Analysis by Functionality
- Figure 76: Eastern Europe Market Value Share and BPS Analysis by Country, 2026 and 2036
- Figure 77: Eastern Europe Market Value Share and BPS Analysis by Botanical Source, 2026 and 2036
- Figure 78: Eastern Europe Market Y-o-Y Growth Comparison by Botanical Source, 2026-2036
- Figure 79: Eastern Europe Market Attractiveness Analysis by Botanical Source
- Figure 80: Eastern Europe Market Value Share and BPS Analysis by Derivative Product, 2026 and 2036
- Figure 81: Eastern Europe Market Y-o-Y Growth Comparison by Derivative Product, 2026-2036
- Figure 82: Eastern Europe Market Attractiveness Analysis by Derivative Product
- Figure 83: Eastern Europe Market Value Share and BPS Analysis by Commercial End-Use, 2026 and 2036
- Figure 84: Eastern Europe Market Y-o-Y Growth Comparison by Commercial End-Use, 2026-2036
- Figure 85: Eastern Europe Market Attractiveness Analysis by Commercial End-Use
- Figure 86: Eastern Europe Market Value Share and BPS Analysis by Physical Form, 2026 and 2036
- Figure 87: Eastern Europe Market Y-o-Y Growth Comparison by Physical Form, 2026-2036
- Figure 88: Eastern Europe Market Attractiveness Analysis by Physical Form
- Figure 89: Eastern Europe Market Value Share and BPS Analysis by Functionality, 2026 and 2036
- Figure 90: Eastern Europe Market Y-o-Y Growth Comparison by Functionality, 2026-2036
- Figure 91: Eastern Europe Market Attractiveness Analysis by Functionality
- Figure 92: East Asia Market Value Share and BPS Analysis by Country, 2026 and 2036
- Figure 93: East Asia Market Value Share and BPS Analysis by Botanical Source, 2026 and 2036
- Figure 94: East Asia Market Y-o-Y Growth Comparison by Botanical Source, 2026-2036
- Figure 95: East Asia Market Attractiveness Analysis by Botanical Source
- Figure 96: East Asia Market Value Share and BPS Analysis by Derivative Product, 2026 and 2036
- Figure 97: East Asia Market Y-o-Y Growth Comparison by Derivative Product, 2026-2036
- Figure 98: East Asia Market Attractiveness Analysis by Derivative Product
- Figure 99: East Asia Market Value Share and BPS Analysis by Commercial End-Use, 2026 and 2036
- Figure 100: East Asia Market Y-o-Y Growth Comparison by Commercial End-Use, 2026-2036
- Figure 101: East Asia Market Attractiveness Analysis by Commercial End-Use
- Figure 102: East Asia Market Value Share and BPS Analysis by Physical Form, 2026 and 2036
- Figure 103: East Asia Market Y-o-Y Growth Comparison by Physical Form, 2026-2036
- Figure 104: East Asia Market Attractiveness Analysis by Physical Form
- Figure 105: East Asia Market Value Share and BPS Analysis by Functionality, 2026 and 2036
- Figure 106: East Asia Market Y-o-Y Growth Comparison by Functionality, 2026-2036
- Figure 107: East Asia Market Attractiveness Analysis by Functionality
- Figure 108: South Asia and Pacific Market Value Share and BPS Analysis by Country, 2026 and 2036
- Figure 109: South Asia and Pacific Market Value Share and BPS Analysis by Botanical Source, 2026 and 2036
- Figure 110: South Asia and Pacific Market Y-o-Y Growth Comparison by Botanical Source, 2026-2036
- Figure 111: South Asia and Pacific Market Attractiveness Analysis by Botanical Source
- Figure 112: South Asia and Pacific Market Value Share and BPS Analysis by Derivative Product, 2026 and 2036
- Figure 113: South Asia and Pacific Market Y-o-Y Growth Comparison by Derivative Product, 2026-2036
- Figure 114: South Asia and Pacific Market Attractiveness Analysis by Derivative Product
- Figure 115: South Asia and Pacific Market Value Share and BPS Analysis by Commercial End-Use, 2026 and 2036
- Figure 116: South Asia and Pacific Market Y-o-Y Growth Comparison by Commercial End-Use, 2026-2036
- Figure 117: South Asia and Pacific Market Attractiveness Analysis by Commercial End-Use
- Figure 118: South Asia and Pacific Market Value Share and BPS Analysis by Physical Form, 2026 and 2036
- Figure 119: South Asia and Pacific Market Y-o-Y Growth Comparison by Physical Form, 2026-2036
- Figure 120: South Asia and Pacific Market Attractiveness Analysis by Physical Form
- Figure 121: South Asia and Pacific Market Value Share and BPS Analysis by Functionality, 2026 and 2036
- Figure 122: South Asia and Pacific Market Y-o-Y Growth Comparison by Functionality, 2026-2036
- Figure 123: South Asia and Pacific Market Attractiveness Analysis by Functionality
- Figure 124: Middle East and Africa Market Value Share and BPS Analysis by Country, 2026 and 2036
- Figure 125: Middle East and Africa Market Value Share and BPS Analysis by Botanical Source, 2026 and 2036
- Figure 126: Middle East and Africa Market Y-o-Y Growth Comparison by Botanical Source, 2026-2036
- Figure 127: Middle East and Africa Market Attractiveness Analysis by Botanical Source
- Figure 128: Middle East and Africa Market Value Share and BPS Analysis by Derivative Product, 2026 and 2036
- Figure 129: Middle East and Africa Market Y-o-Y Growth Comparison by Derivative Product, 2026-2036
- Figure 130: Middle East and Africa Market Attractiveness Analysis by Derivative Product
- Figure 131: Middle East and Africa Market Value Share and BPS Analysis by Commercial End-Use, 2026 and 2036
- Figure 132: Middle East and Africa Market Y-o-Y Growth Comparison by Commercial End-Use, 2026-2036
- Figure 133: Middle East and Africa Market Attractiveness Analysis by Commercial End-Use
- Figure 134: Middle East and Africa Market Value Share and BPS Analysis by Physical Form, 2026 and 2036
- Figure 135: Middle East and Africa Market Y-o-Y Growth Comparison by Physical Form, 2026-2036
- Figure 136: Middle East and Africa Market Attractiveness Analysis by Physical Form
- Figure 137: Middle East and Africa Market Value Share and BPS Analysis by Functionality, 2026 and 2036
- Figure 138: Middle East and Africa Market Y-o-Y Growth Comparison by Functionality, 2026-2036
- Figure 139: Middle East and Africa Market Attractiveness Analysis by Functionality
- Figure 140: Global Market - Tier Structure Analysis
- Figure 141: Global Market - Company Share Analysis
Frequently Asked Questions
How big is the starches/glucose market in 2026, and what is forecast for 2036?
FMI estimates that the global starches/glucose market size stood at USD 76.5 billion in 2025 and reached USD 78.5 billion in 2026. Overall industry valuation is on track to hit USD 103.5 billion by 2036 as wet-millers expand clean-label food starches, corrugated packaging binders, and fermentation dextrose.
What is the CAGR for the starches/glucose market from 2026 to 2036?
The starches/glucose sector is projected to expand at a 2.8% CAGR over the 2026 to 2036 window, adding USD 25.0 billion in incremental value.
Which botanical source segment leads the starches/glucose market?
Dent Corn and Waxy Maize Starch holds 30.0% of botanical source demand in 2026 because integrated maize wet-milling complexes capture high co-product credits from corn oil and gluten meal.
Which derivative product and end-use segments lead the starches/glucose market?
High Fructose Corn Syrup HFCS-55 and HFCS-42 represents 33.7% of derivative products while Beverages Soft Drinks and Juices command 37.5% of commercial end-use demand in 2026.
Which country has a notable growth outlook during the assessment period?
Brazil leads national expansion projections at a 3.4% CAGR through 2036, followed closely by Canada at 3.3% and Mexico at 3.1%.
Who are the key players in the market?
Novonesis and Givaudan SA with Symrise AG, Chr. Hansen Holding AS, DSM-Firmenich AG with Cargill Incorporated with Midland Company with Ingredion Incorporated with & Lyle PLC and Roquette Freres lead across the value chain.
Preview the report firsthand - request a free sample
Get SampleGet the brochure for pricing and purchase details.
Get PDF
