Pea Starch Market Size and Share Forecast Outlook 2025 to 2035

The global pea starch market is projected to grow from USD 147.1 million in 2025 to USD 501.6 million by 2035, registering a CAGR of 13.1%. The market expansion is being driven by heightened demand for gluten-free ingredients, the growing influence of celebrity-endorsed diets, and rising health consciousness among consumers globally.

Quick Stats for Pea Starch Market

  • Market Value (2025): USD 147.1 million
  • Forecast Value (2035): USD 501.6 million
  • Forecast CAGR: 13.1%
  • Nature Leader in 2025: Conventional (81.5% market share)
  • Top Grade Segment: Food Grade (55% share)
  • Key Growth Region: North America (USA is thefastest-growing market with 12.6% CAGR)
Metric Value
Industry Size (2025E) USD 147.1 million
Industry Value (2035F) USD 501.6 million
CAGR (2025 to 2035) 13.1%

Pea starch is gaining traction due to its cost-effectiveness compared to potato or tapioca starch, alongside its superior consistency, texturizing, and stabilizing properties for bakery, confectionery, and processed food applications.

The market holds a 100% share in the pea-based starch market, around 6% share within plant-based functional food ingredients, and 2% in the broader plant-based food ingredients market. Its share is around 0.1% in the global specialty food ingredients market and below 0.01% in the entire global food ingredients market.

This indicates its niche yet high-potential positioning in premium gluten-free, allergen-free, and functional ingredient segments, supported by rising clean label trends, organic product adoption, and bakery sector innovations worldwide.

Government regulations impacting the market focus on food safety standards, allergen labelling, and organic certification. For instance, the FDA’s Gluten-Free Labelling Rule under the Food Allergen Labelling and Consumer Protection Act in the United States ensures pea starch-based products labelled gluten-free meet strict criteria.

In Europe, EFSA’s regulations on novel foods and allergen declarations maintain product safety and transparency. These regulations drive the adoption of pea starch with enhanced purity, traceability, and organic certification, ensuring compliance and supporting its future growth in gluten-free, organic, and weight management segments.

The USA is projected to be the fastest-growing market, expanding at a CAGR of 12.6% from 2025 to 2035. Conventional will lead the nature segment with an 81.5% share, while food grade will dominate the grade segment with a 55% share. The Germany and UK markets are also expected to grow steadily at CAGRs of 10.6% and 8.3% respectively.

Analyzing Pea Starch Market by Top Investment Segments

The pea starch market is segmented by nature, application, grade, end use, and region. By nature, the market is bifurcated into organic and conventional. In terms of application, the market is classified into thickening & binding, gelling, texturizing, and others (animal feed, cosmetics, pharmaceuticals, and pet food).

Based on grade, the market is divided into feed grade, food grade, and industrial grade. By end use, the market is segmented into soups & sauces, snacks & savory, bakery products, cosmetics, pharmaceuticals, pet food, and others (meat processing, dairy alternatives, confectionery, and beverages).Regionally, the market is classified into North America, Latin America, Western Europe, South Asia, East Asia, Eastern Europe, and the Middle East & Africa.

Conventional to Lead the Nature Segment with 81.5% Market Share

Conventional will dominate the nature segment with an 81.5% market share by 2025, driven by its established extraction processes, cost-effectiveness, and extensive usage in bakery and processed foods.

  • Conventional extraction methods are well-established and cost-effective for manufacturers.
  • High demand in bakeries, snacks, and processed foods continues to drive growth for conventional pea starch.

Thickening and Binding to Capture the Application Segment with 34% Market Share

Thickening and binding will account for a 34% market share in 2025, due to the superior texturizing, binding, and stabilizing properties of pea starch in gluten-free soups, sauces, and processed foods.
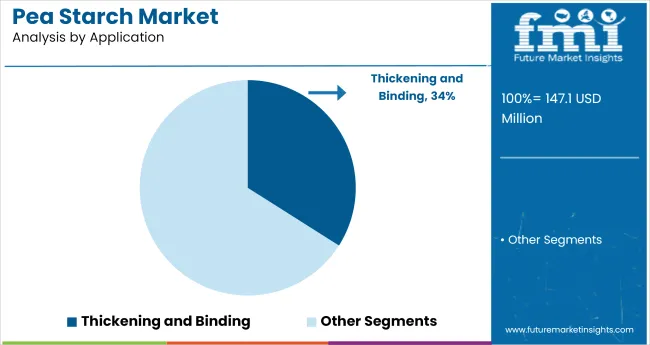
  • Pea starch provides superior thickening, stability, and binding properties across soups, sauces, and processed foods.
  • The need for gluten-free and allergen-free thickening agents will drive this segment's growth.

Pea Starch Market   Analysis By Application

Food Grade to Lead the Grade Segment with 55% Market Share

Food grade is expected to lead the grade segment with a 55% global market share by 2025, supported by its cost-effectiveness, clean-label positioning, and strong demand in bakery and snack applications.
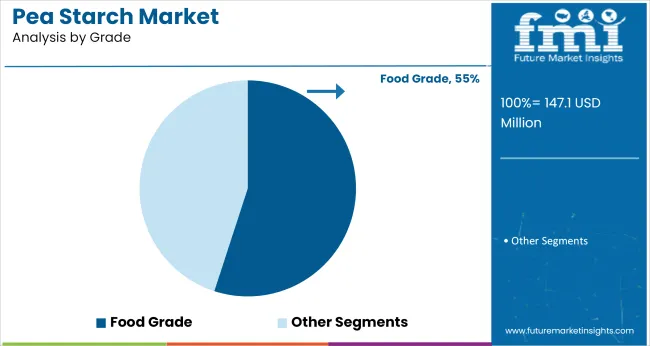
  • Its cost-effectiveness compared to potato and corn starch makes it the preferred choice for food manufacturers.
  • Growing adoption in bakery products and snacks continues to propel this segment forward.

Pea Starch Market   Analysis By Grade

Bakery Products to Lead the End Use Segment with 28% Market Share

Bakery products are expected to dominate the end use segment, accounting for 28% of the global market share by 2025.
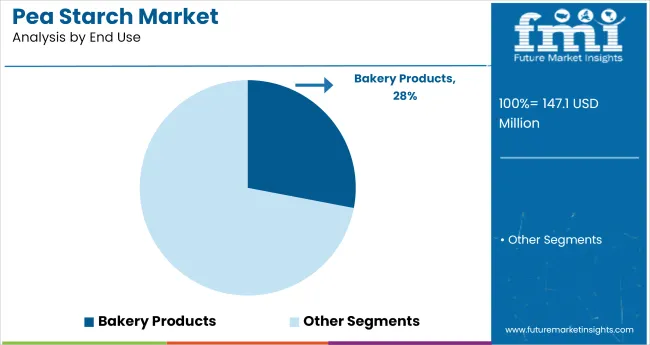
  • Pea starch enhances dough stability, texture, and freshness in bakery applications.
  • Rising gluten-free baking trends will continue to boost demand in this segment.

Pea Starch Market   Analysis By End Use

Top Pea Starch Market Dynamics

The global pea starch market is experiencing robust growth, driven by the rising demand for gluten-free and allergen-free food ingredients across industries. Pea starch plays a crucial role in enhancing the texture, stability, and binding of various food products.

Recent Trends in the Pea Starch Market

  • Integration of advanced extraction techniques, such as ultrasonic extraction, is improving yield, efficiency, and product quality in pea starch production.
  • Pea starch is increasingly used as a fat replacer and texture enhancer in bakery, dairy alternatives, and processed meats, supporting clean-label and plant-based formulation trends.

Challenges in the Pea Starch Market

  • High costs associated with extraction and processing equipment limit its adoption among small-scale manufacturers.
  • The availability and preference for alternative starches, such as corn, potato, and tapioca starch, pose challenges due to their lower costs and widespread market acceptance.

Top Countries Manufacturing, Regulating, and Driving Demand for Pea Starch

The USA leads with the highest CAGR at 12.6%, driven by rising obesity awareness and growing demand for gluten-free and weight management products. Germany follows at 10.6%, supported by strong sports culture and clean label trends. The UK records an 8.3% CAGR, fueled by increasing bakery production using non-GMO, allergen-free starch. France shows an 8% CAGR, with rising demand for pea starch in gluten-free bakery and confectionery products.

Japan has the lowest growth at 7%, despite strong traditional starch consumption and emerging plant-based product innovations. Western markets lead growth driven by health, fitness, and gluten-free dietary shifts, while Japan grows steadily with a focus on baking, functional foods, and premium product formulations.

The report covers in-depth analysis of 40+ countries; five top-performing OECD countries are highlighted below.

In-depth Analysis of Pea Starch Demand in Japan

The Japan pea starch revenue is growing at a CAGR of 7% from 2024 to 2034. Growth is driven by steady demand in the baking and confectionery sectors, alongside rising use in plant-based and premium food products.

  • Strong demand in bakery, confectionery, and plant-based functional foods.
  • Preference for premium, fortified, and allergen-free starch products.

Growth Outlook for Pea Starch in the USA

The sales of pea starch in the USA are expanding at 12.6% CAGR during the forecast period, the highest among key countries. Key drivers include rising obesity rates, health-conscious diets, and growing demand for gluten-free, non-GMO food ingredients.

  • Strong health and wellness trends driving market expansion.
  • Major market for gluten-free bakery products, weight loss supplements, and functional foods.

Industrial Pea Starch Demand in Germany

The pea starch market in Germany is projected to grow at a 10.6% CAGR during the forecast period. Sports culture, clean label preferences, and gluten-free dietary trends support market expansion.

  • High adoption in bakery, confectionery, and sports nutrition industries.
  • Emphasis on clean label, non-GMO, and organic-certified pea starch products.

Pea Starch Demand Rising in France

The French pea starch market is expected to grow at a CAGR of 8% from 2024 to 2034. Consumer interest in gluten-free and allergen-free ingredients, coupled with demand for plant-based bakery and confectionery products, drives market growth.

  • Increasing adoption in gluten-free bakery and confectionery formulations.
  • Growing demand for non-GMO and premium pea starch products.

Growth Outlook for Pea Starch in the UK

The UK pea starch revenue is projected to grow at a CAGR of 8.3% from 2024 to 2034. Bakery production continues to rise, with pea starch gaining market share as a gluten-free and allergen-free alternative.

  • Strong demand in bakery items as a wheat flour substitute.
  • Increasing focus on organic, non-GMO, and clean label pea starch products.

Leading Pea Starch Suppliers and Manufacturers

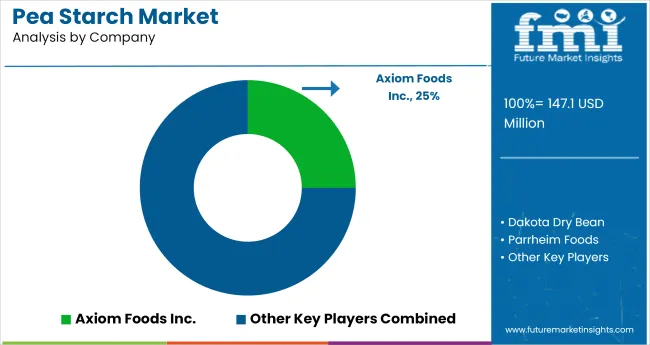
The market is moderately consolidated, with leading players like Axiom Foods Inc., Dakota Dry Bean, Parrheim Foods, Cargill Inc., and Vestkorn dominating the industry. These companies provide high-purity, functional pea starch catering to sectors such as bakery, pharmaceuticals, and functional foods. Axiom Foods Inc. focuses on clean-label, allergen-free pea ingredients, while Dakota Dry Bean specializes in integrated pea processing and starch extraction solutions.

Parrheim Foods delivers food-grade and feed-grade pea starch, emphasizing consistent quality. Cargill Inc. offers globally sourced, GMO-free starches for versatile applications, and Vestkorn is known for its sustainable, eco-friendly production processes. Other key players like Roquette, Sanstar Bio-Polymers, Emsland Group, and American Key Products contribute by providing specialized, high-performance pea starch for a wide range of food, nutraceutical, and industrial uses.

Recent Pea Starch Industry News
  • In June 2024, Bunge signed a collaborative agreement with Golden Fields, which established a new facility in Liepaja, Latvia, to exclusively supply Bunge with dry-milled pea and faba bean protein concentrates.
  • In May 2024, Roquette launched LYCAGEL/Flex, a hydroxypropyl pea starch premix tailored for nutraceutical and pharmaceutical softgel capsules. The innovation enables customizable formulations while enhancing flexibility, performance, and efficiency for end users.

Pea Starch Market   Analysis By Company

Pea Starch Market Report Scope

Report Attributes Details
Market Size (2025) USD 147.1 million
Projected Market Size (2035) USD 501.6 million
CAGR (2025 to 2035) 13.1%
Base Year for Estimation 2024
Historical Period 2020 to 2024
Projections Period 2025 to 2035
Report Parameter USD million for value/volume in metric tons
Nature Analyzed Organic and Conventional
Application Analyzed Thickening and Binding, Gelling, Texturizing, and Others (Animal Feed, Cosmetics, Pharmaceuticals, Pet Food)
Grade Analyzed Feed Grade, Food Grade, and Industrial Grade
End Use Analyzed Soups and Sauces, Snacks and Savory, Bakery Products, Cosmetics, Pharmaceuticals, Pet Food, and Others (Meat Processing, Dairy Alternatives, Confectionery, Beverages)
Regions Covered North America, Latin America, Western Europe, South Asia, East Asia, Eastern Europe, Middle East & Africa
Countries Covered United States, United Kingdom, Germany, France, Japan, China, India, Brazil, South Korea, Australia
Key Players Influencing the Market Axiom Foods Inc., Dakota Dry Bean, Parrheim Foods, Cargill Inc., Vestkorn , Roquette , Sanstar Bio-Polymers, Emsland Group, and American Key Products
Additional Attributes Dollar sales by source type, purity analysis, regional demand growth, regulatory influence, competitive benchmarking

Key Segmentation

By Nature:

Based on its nature, the pea starch market is bifurcated into organic and conventional.

By Grade:

In terms of grade, the pea industry is categorized into feed grade, food grade, and industrial grade.

By Application:

Key product applications include thickening and binding, gelling, texturizing, and others.

By End Use:

When it comes to end use, the industry is segmented into soups and sauces, snacks and savory, bakery products, food processing industry, cosmetics, pharmaceuticals, and pet food industry.

By Region:

Analysis has been carried out in key countries of North America, Latin America, Europe, South Asia, East Asia, Oceania, and the Middle East and Africa.

Table of Content

  1. Executive Summary
    • Global Market Outlook
    • Demand-side Trends
    • Supply-side Trends
    • Technology Roadmap Analysis
    • Analysis and Recommendations
  2. Market Overview
    • Market Coverage/Taxonomy
    • Market Definition/Scope/Limitations
  3. Market Background
    • Market Dynamics
      • Drivers
      • Restraints
      • Opportunity
      • Trends
    • Scenario Forecast
      • Demand in Optimistic Scenario
      • Demand in Likely Scenario
      • Demand in Conservative Scenario
    • Opportunity Map Analysis
    • Product Life Cycle Analysis
    • Supply Chain Analysis
      • Supply Side Participants and their Roles
        • Producers
        • Mid-Level Participants (Traders/ Agents/ Brokers)
        • Wholesalers and Distributors
      • Value Added and Value Created at Node in the Supply Chain
      • List of Raw Material Suppliers
      • List of Existing and Potential Buyer’s
    • Investment Feasibility Matrix
    • Value Chain Analysis
      • Profit Margin Analysis
      • Wholesalers and Distributors
      • Retailers
    • PESTLE and Porter’s Analysis
    • Regulatory Landscape
      • By Key Regions
      • By Key Countries
    • Regional Parent Market Outlook
    • Production and Consumption Statistics
    • Import and Export Statistics
  4. Global Market Analysis 2020 to 2024 and Forecast, 2025 to 2035
    • Historical Market Size Value (USD Million) & Volume (Metric Tons) Analysis, 2020 to 2024
    • Current and Future Market Size Value (USD Million) & Volume (Metric Tons) Projections, 2025 to 2035
      • Y-o-Y Growth Trend Analysis
      • Absolute $ Opportunity Analysis
  5. Global Market Pricing Analysis 2020 to 2024 and Forecast 2025 to 2035
  6. Global Market Analysis 2020 to 2024 and Forecast 2025 to 2035, By Nature
    • Introduction/Key Findings
    • Historical Market Size Value (USD Million) & Volume (Metric Tons) Analysis By Nature, 2020 to 2024
    • Current and Future Market Size Value (USD Million) & Volume (Metric Tons) Analysis and Forecast By Nature, 2025 to 2035
      • Organic
      • Conventional
    • Y-o-Y Growth Trend Analysis By Nature, 2020 to 2024
    • Absolute $ Opportunity Analysis By Nature, 2025 to 2035
  7. Global Market Analysis 2020 to 2024 and Forecast 2025 to 2035, By Application
    • Introduction/Key Findings
    • Historical Market Size Value (USD Million) & Volume (Metric Tons) Analysis By Application, 2020 to 2024
    • Current and Future Market Size Value (USD Million) & Volume (Metric Tons) Analysis and Forecast By Application, 2025 to 2035
      • Thickening and Binding
      • Gelling
      • Texturizing
      • Others (animal feed, cosmetics, pharmaceuticals, pet food)
    • Y-o-Y Growth Trend Analysis By Application, 2020 to 2024
    • Absolute $ Opportunity Analysis By Application, 2025 to 2035
  8. Global Market Analysis 2020 to 2024 and Forecast 2025 to 2035, By Grade
    • Introduction/Key Findings
    • Historical Market Size Value (USD Million) & Volume (Metric Tons) Analysis By Grade, 2020 to 2024
    • Current and Future Market Size Value (USD Million) & Volume (Metric Tons) Analysis and Forecast By Grade, 2025 to 2035
      • Feed Grade
      • Food Grade
      • Industrial Grade
    • Y-o-Y Growth Trend Analysis By Grade, 2020 to 2024
    • Absolute $ Opportunity Analysis By Grade, 2025 to 2035
  9. Global Market Analysis 2020 to 2024 and Forecast 2025 to 2035, By End Use
    • Introduction/Key Findings
    • Historical Market Size Value (USD Million) & Volume (Metric Tons) Analysis By End Use, 2020 to 2024
    • Current and Future Market Size Value (USD Million) & Volume (Metric Tons) Analysis and Forecast By End Use, 2025 to 2035
      • Soups and Sauces
      • Snacks and Savory
      • Bakery Products
      • Cosmetics
      • Pharmaceuticals
      • Pet Food
      • Others (meat processing, dairy alternatives, confectionery, beverages)
    • Y-o-Y Growth Trend Analysis By End Use, 2020 to 2024
    • Absolute $ Opportunity Analysis By End Use, 2025 to 2035
  10. Global Market Analysis 2020 to 2024 and Forecast 2025 to 2035, By Region
    • Introduction
    • Historical Market Size Value (USD Million) & Volume (Metric Tons) Analysis By Region, 2020 to 2024
    • Current Market Size Value (USD Million) & Volume (Metric Tons) Analysis and Forecast By Region, 2025 to 2035
      • North America
      • Latin America
      • Western Europe
      • Eastern Europe
      • East Asia
      • South Asia & Pacific
      • Middle East and Africa
    • Market Attractiveness Analysis By Region
  11. North America Market Analysis 2020 to 2024 and Forecast 2025 to 2035, By Country
    • Historical Market Size Value (USD Million) & Volume (Metric Tons) Trend Analysis By Market Taxonomy, 2020 to 2024
    • Market Size Value (USD Million) & Volume (Metric Tons) Forecast By Market Taxonomy, 2025 to 2035
      • By Country
        • USA
        • Canada
        • Mexico
      • By Nature
      • By Application
      • By Grade
      • By End Use
    • Market Attractiveness Analysis
      • By Country
      • By Nature
      • By Application
      • By Grade
      • By End Use
    • Key Takeaways
  12. Latin America Market Analysis 2020 to 2024 and Forecast 2025 to 2035, By Country
    • Historical Market Size Value (USD Million) & Volume (Metric Tons) Trend Analysis By Market Taxonomy, 2020 to 2024
    • Market Size Value (USD Million) & Volume (Metric Tons) Forecast By Market Taxonomy, 2025 to 2035
      • By Country
        • Brazil
        • Argentina
        • Rest of LATAM
      • By Nature
      • By Application
      • By Grade
      • By End Use
    • Market Attractiveness Analysis
      • By Country
      • By Nature
      • By Application
      • By Grade
      • By End Use
    • Key Takeaways
  13. Western Europe Market Analysis 2020 to 2024 and Forecast 2025 to 2035, By Country
    • Historical Market Size Value (USD Million) & Volume (Metric Tons) Trend Analysis By Market Taxonomy, 2020 to 2024
    • Market Size Value (USD Million) & Volume (Metric Tons) Forecast By Market Taxonomy, 2025 to 2035
      • By Country
        • Germany
        • Italy
        • France
        • UK
        • Spain
        • BENELUX
        • Nordic
        • Rest of W.Europe
      • By Nature
      • By Application
      • By Grade
      • By End Use
    • Market Attractiveness Analysis
      • By Country
      • By Nature
      • By Application
      • By Grade
      • By End Use
    • Key Takeaways
  14. Eastern Europe Market Analysis 2020 to 2024 and Forecast 2025 to 2035, By Country
    • Historical Market Size Value (USD Million) & Volume (Metric Tons) Trend Analysis By Market Taxonomy, 2020 to 2024
    • Market Size Value (USD Million) & Volume (Metric Tons) Forecast By Market Taxonomy, 2025 to 2035
      • By Country
        • Russia
        • Hungary
        • Poland
        • Balkan & Baltics
        • Rest of E. Europe
      • By Nature
      • By Application
      • By Grade
      • By End Use
    • Market Attractiveness Analysis
      • By Country
      • By Nature
      • By Application
      • By Grade
      • By End Use
    • Key Takeaways
  15. East Asia Market Analysis 2020 to 2024 and Forecast 2025 to 2035, By Country
    • Historical Market Size Value (USD Million) & Volume (Metric Tons) Trend Analysis By Market Taxonomy, 2020 to 2024
    • Market Size Value (USD Million) & Volume (Metric Tons) Forecast By Market Taxonomy, 2025 to 2035
      • By Country
        • China
        • Japan
        • South Korea
      • By Nature
      • By Application
      • By Grade
      • By End Use
    • Market Attractiveness Analysis
      • By Country
      • By Nature
      • By Application
      • By Grade
      • By End Use
    • Key Takeaways
  16. South Asia & Pacific Market Analysis 2020 to 2024 and Forecast 2025 to 2035, By Country
    • Historical Market Size Value (USD Million) & Volume (Metric Tons) Trend Analysis By Market Taxonomy, 2020 to 2024
    • Market Size Value (USD Million) & Volume (Metric Tons) Forecast By Market Taxonomy, 2025 to 2035
      • By Country
        • India
        • Australia & New Zealand
        • ASEAN
        • Rest of SAP
      • By Nature
      • By Application
      • By Grade
      • By End Use
    • Market Attractiveness Analysis
      • By Country
      • By Nature
      • By Application
      • By Grade
      • By End Use
    • Key Takeaways
  17. Middle East and Africa Market Analysis 2020 to 2024 and Forecast 2025 to 2035, By Country
    • Historical Market Size Value (USD Million) & Volume (Metric Tons) Trend Analysis By Market Taxonomy, 2020 to 2024
    • Market Size Value (USD Million) & Volume (Metric Tons) Forecast By Market Taxonomy, 2025 to 2035
      • By Country
        • GCC Countries
        • Northern Africa
        • South Africa
        • Turkiye
        • Rest of MEA
      • By Nature
      • By Application
      • By Grade
      • By End Use
    • Market Attractiveness Analysis
      • By Country
      • By Nature
      • By Application
      • By Grade
      • By End Use
    • Key Takeaways
  18. Key Countries Market Analysis
    • USA
      • Pricing Analysis
      • Market Share Analysis, 2024
        • By Nature
        • By Application
        • By Grade
        • By End Use
    • Canada
      • Pricing Analysis
      • Market Share Analysis, 2024
        • By Nature
        • By Application
        • By Grade
        • By End Use
    • Brazil
      • Pricing Analysis
      • Market Share Analysis, 2024
        • By Nature
        • By Application
        • By Grade
        • By End Use
    • Mexico
      • Pricing Analysis
      • Market Share Analysis, 2024
        • By Nature
        • By Application
        • By Grade
        • By End Use
    • Argentina
      • Pricing Analysis
      • Market Share Analysis, 2024
        • By Nature
        • By Application
        • By Grade
        • By End Use
  19. Market Structure Analysis
    • Competition Dashboard
    • Competition Benchmarking
    • Market Share Analysis of Top Players
      • By Regional
      • By Nature
      • By Application
      • By Grade
      • By End Use
  20. Competition Analysis
    • Competition Deep Dive
      • Axiom Foods Inc.
        • Overview
        • Product Portfolio
        • Profitability by Market Segments (Product/Age /Sales Channel/Region)
        • Sales Footprint
        • Strategy Overview
          • Marketing Strategy
          • Product Strategy
          • Channel Strategy
      • Dakota Dry Bean
        • Overview
        • Product Portfolio
        • Profitability by Market Segments (Product/Age /Sales Channel/Region)
        • Sales Footprint
        • Strategy Overview
          • Marketing Strategy
          • Product Strategy
          • Channel Strategy
      • Parrheim Foods
        • Overview
        • Product Portfolio
        • Profitability by Market Segments (Product/Age /Sales Channel/Region)
        • Sales Footprint
        • Strategy Overview
          • Marketing Strategy
          • Product Strategy
          • Channel Strategy
      • Cargill Inc.
        • Overview
        • Product Portfolio
        • Profitability by Market Segments (Product/Age /Sales Channel/Region)
        • Sales Footprint
        • Strategy Overview
          • Marketing Strategy
          • Product Strategy
          • Channel Strategy
      • Vestkorn
        • Overview
        • Product Portfolio
        • Profitability by Market Segments (Product/Age /Sales Channel/Region)
        • Sales Footprint
        • Strategy Overview
          • Marketing Strategy
          • Product Strategy
          • Channel Strategy
      • Roquette
        • Overview
        • Product Portfolio
        • Profitability by Market Segments (Product/Age /Sales Channel/Region)
        • Sales Footprint
        • Strategy Overview
          • Marketing Strategy
          • Product Strategy
          • Channel Strategy
      • Sanstar Bio-Polymers
        • Overview
        • Product Portfolio
        • Profitability by Market Segments (Product/Age /Sales Channel/Region)
        • Sales Footprint
        • Strategy Overview
          • Marketing Strategy
          • Product Strategy
          • Channel Strategy
      • Emsland Group
        • Overview
        • Product Portfolio
        • Profitability by Market Segments (Product/Age /Sales Channel/Region)
        • Sales Footprint
        • Strategy Overview
          • Marketing Strategy
          • Product Strategy
          • Channel Strategy
      • American Key Products
        • Overview
        • Product Portfolio
        • Profitability by Market Segments (Product/Age /Sales Channel/Region)
        • Sales Footprint
        • Strategy Overview
          • Marketing Strategy
          • Product Strategy
          • Channel Strategy
  21. Assumptions & Acronyms Used
  22. Research Methodology

List of Tables

  • Table 1: Global Market Value (USD Million) Forecast by Region, 2020-2035
  • Table 2: Global Market Volume (Metric Tons) Forecast by Region, 2020-2035
  • Table 3: Global Market Value (USD Million) Forecast by Nature, 2020-2035
  • Table 4: Global Market Volume (Metric Tons) Forecast by Nature, 2020-2035
  • Table 5: Global Market Value (USD Million) Forecast by Application, 2020-2035
  • Table 6: Global Market Volume (Metric Tons) Forecast by Application, 2020-2035
  • Table 7: Global Market Value (USD Million) Forecast by Grade, 2020-2035
  • Table 8: Global Market Volume (Metric Tons) Forecast by Grade, 2020-2035
  • Table 9: Global Market Value (USD Million) Forecast by End Use, 2020-2035
  • Table 10: Global Market Volume (Metric Tons) Forecast by End Use, 2020-2035
  • Table 11: North America Market Value (USD Million) Forecast by Country, 2020-2035
  • Table 12: North America Market Volume (Metric Tons) Forecast by Country, 2020-2035
  • Table 13: North America Market Value (USD Million) Forecast by Nature, 2020-2035
  • Table 14: North America Market Volume (Metric Tons) Forecast by Nature, 2020-2035
  • Table 15: North America Market Value (USD Million) Forecast by Application, 2020-2035
  • Table 16: North America Market Volume (Metric Tons) Forecast by Application, 2020-2035
  • Table 17: North America Market Value (USD Million) Forecast by Grade, 2020-2035
  • Table 18: North America Market Volume (Metric Tons) Forecast by Grade, 2020-2035
  • Table 19: North America Market Value (USD Million) Forecast by End Use, 2020-2035
  • Table 20: North America Market Volume (Metric Tons) Forecast by End Use, 2020-2035
  • Table 21: Latin America Market Value (USD Million) Forecast by Country, 2020-2035
  • Table 22: Latin America Market Volume (Metric Tons) Forecast by Country, 2020-2035
  • Table 23: Latin America Market Value (USD Million) Forecast by Nature, 2020-2035
  • Table 24: Latin America Market Volume (Metric Tons) Forecast by Nature, 2020-2035
  • Table 25: Latin America Market Value (USD Million) Forecast by Application, 2020-2035
  • Table 26: Latin America Market Volume (Metric Tons) Forecast by Application, 2020-2035
  • Table 27: Latin America Market Value (USD Million) Forecast by Grade, 2020-2035
  • Table 28: Latin America Market Volume (Metric Tons) Forecast by Grade, 2020-2035
  • Table 29: Latin America Market Value (USD Million) Forecast by End Use, 2020-2035
  • Table 30: Latin America Market Volume (Metric Tons) Forecast by End Use, 2020-2035
  • Table 31: Western Europe Market Value (USD Million) Forecast by Country, 2020-2035
  • Table 32: Western Europe Market Volume (Metric Tons) Forecast by Country, 2020-2035
  • Table 33: Western Europe Market Value (USD Million) Forecast by Nature, 2020-2035
  • Table 34: Western Europe Market Volume (Metric Tons) Forecast by Nature, 2020-2035
  • Table 35: Western Europe Market Value (USD Million) Forecast by Application, 2020-2035
  • Table 36: Western Europe Market Volume (Metric Tons) Forecast by Application, 2020-2035
  • Table 37: Western Europe Market Value (USD Million) Forecast by Grade, 2020-2035
  • Table 38: Western Europe Market Volume (Metric Tons) Forecast by Grade, 2020-2035
  • Table 39: Western Europe Market Value (USD Million) Forecast by End Use, 2020-2035
  • Table 40: Western Europe Market Volume (Metric Tons) Forecast by End Use, 2020-2035
  • Table 41: Eastern Europe Market Value (USD Million) Forecast by Country, 2020-2035
  • Table 42: Eastern Europe Market Volume (Metric Tons) Forecast by Country, 2020-2035
  • Table 43: Eastern Europe Market Value (USD Million) Forecast by Nature, 2020-2035
  • Table 44: Eastern Europe Market Volume (Metric Tons) Forecast by Nature, 2020-2035
  • Table 45: Eastern Europe Market Value (USD Million) Forecast by Application, 2020-2035
  • Table 46: Eastern Europe Market Volume (Metric Tons) Forecast by Application, 2020-2035
  • Table 47: Eastern Europe Market Value (USD Million) Forecast by Grade, 2020-2035
  • Table 48: Eastern Europe Market Volume (Metric Tons) Forecast by Grade, 2020-2035
  • Table 49: Eastern Europe Market Value (USD Million) Forecast by End Use, 2020-2035
  • Table 50: Eastern Europe Market Volume (Metric Tons) Forecast by End Use, 2020-2035
  • Table 51: East Asia Market Value (USD Million) Forecast by Country, 2020-2035
  • Table 52: East Asia Market Volume (Metric Tons) Forecast by Country, 2020-2035
  • Table 53: East Asia Market Value (USD Million) Forecast by Nature, 2020-2035
  • Table 54: East Asia Market Volume (Metric Tons) Forecast by Nature, 2020-2035
  • Table 55: East Asia Market Value (USD Million) Forecast by Application, 2020-2035
  • Table 56: East Asia Market Volume (Metric Tons) Forecast by Application, 2020-2035
  • Table 57: East Asia Market Value (USD Million) Forecast by Grade, 2020-2035
  • Table 58: East Asia Market Volume (Metric Tons) Forecast by Grade, 2020-2035
  • Table 59: East Asia Market Value (USD Million) Forecast by End Use, 2020-2035
  • Table 60: East Asia Market Volume (Metric Tons) Forecast by End Use, 2020-2035
  • Table 61: South Asia & Pacific Market Value (USD Million) Forecast by Country, 2020-2035
  • Table 62: South Asia & Pacific Market Volume (Metric Tons) Forecast by Country, 2020-2035
  • Table 63: South Asia & Pacific Market Value (USD Million) Forecast by Nature, 2020-2035
  • Table 64: South Asia & Pacific Market Volume (Metric Tons) Forecast by Nature, 2020-2035
  • Table 65: South Asia & Pacific Market Value (USD Million) Forecast by Application, 2020-2035
  • Table 66: South Asia & Pacific Market Volume (Metric Tons) Forecast by Application, 2020-2035
  • Table 67: South Asia & Pacific Market Value (USD Million) Forecast by Grade, 2020-2035
  • Table 68: South Asia & Pacific Market Volume (Metric Tons) Forecast by Grade, 2020-2035
  • Table 69: South Asia & Pacific Market Value (USD Million) Forecast by End Use, 2020-2035
  • Table 70: South Asia & Pacific Market Volume (Metric Tons) Forecast by End Use, 2020-2035
  • Table 71: Middle East and Africa Market Value (USD Million) Forecast by Country, 2020-2035
  • Table 72: Middle East and Africa Market Volume (Metric Tons) Forecast by Country, 2020-2035
  • Table 73: Middle East and Africa Market Value (USD Million) Forecast by Nature, 2020-2035
  • Table 74: Middle East and Africa Market Volume (Metric Tons) Forecast by Nature, 2020-2035
  • Table 75: Middle East and Africa Market Value (USD Million) Forecast by Application, 2020-2035
  • Table 76: Middle East and Africa Market Volume (Metric Tons) Forecast by Application, 2020-2035
  • Table 77: Middle East and Africa Market Value (USD Million) Forecast by Grade, 2020-2035
  • Table 78: Middle East and Africa Market Volume (Metric Tons) Forecast by Grade, 2020-2035
  • Table 79: Middle East and Africa Market Value (USD Million) Forecast by End Use, 2020-2035
  • Table 80: Middle East and Africa Market Volume (Metric Tons) Forecast by End Use, 2020-2035

List of Figures

  • Figure 1: Global Market Volume (Metric Tons) Forecast 2020-2035
  • Figure 2: Global Market Pricing Analysis
  • Figure 3: Global Market Value (USD Million) Forecast 2020-2035
  • Figure 4: Global Market Value Share and BPS Analysis by Nature, 2025 and 2035
  • Figure 5: Global Market Y-o-Y Growth Comparison by Nature, 2025-2035
  • Figure 6: Global Market Attractiveness Analysis by Nature
  • Figure 7: Global Market Value Share and BPS Analysis by Application, 2025 and 2035
  • Figure 8: Global Market Y-o-Y Growth Comparison by Application, 2025-2035
  • Figure 9: Global Market Attractiveness Analysis by Application
  • Figure 10: Global Market Value Share and BPS Analysis by Grade, 2025 and 2035
  • Figure 11: Global Market Y-o-Y Growth Comparison by Grade, 2025-2035
  • Figure 12: Global Market Attractiveness Analysis by Grade
  • Figure 13: Global Market Value Share and BPS Analysis by End Use, 2025 and 2035
  • Figure 14: Global Market Y-o-Y Growth Comparison by End Use, 2025-2035
  • Figure 15: Global Market Attractiveness Analysis by End Use
  • Figure 16: Global Market Value (USD Million) Share and BPS Analysis by Region, 2025 and 2035
  • Figure 17: Global Market Y-o-Y Growth Comparison by Region, 2025-2035
  • Figure 18: Global Market Attractiveness Analysis by Region
  • Figure 19: North America Market Incremental $ Opportunity, 2025-2035
  • Figure 20: Latin America Market Incremental $ Opportunity, 2025-2035
  • Figure 21: Western Europe Market Incremental $ Opportunity, 2025-2035
  • Figure 22: Eastern Europe Market Incremental $ Opportunity, 2025-2035
  • Figure 23: East Asia Market Incremental $ Opportunity, 2025-2035
  • Figure 24: South Asia & Pacific Market Incremental $ Opportunity, 2025-2035
  • Figure 25: Middle East and Africa Market Incremental $ Opportunity, 2025-2035
  • Figure 26: North America Market Value Share and BPS Analysis by Country, 2025 and 2035
  • Figure 27: North America Market Value Share and BPS Analysis by Nature, 2025 and 2035
  • Figure 28: North America Market Y-o-Y Growth Comparison by Nature, 2025-2035
  • Figure 29: North America Market Attractiveness Analysis by Nature
  • Figure 30: North America Market Value Share and BPS Analysis by Application, 2025 and 2035
  • Figure 31: North America Market Y-o-Y Growth Comparison by Application, 2025-2035
  • Figure 32: North America Market Attractiveness Analysis by Application
  • Figure 33: North America Market Value Share and BPS Analysis by Grade, 2025 and 2035
  • Figure 34: North America Market Y-o-Y Growth Comparison by Grade, 2025-2035
  • Figure 35: North America Market Attractiveness Analysis by Grade
  • Figure 36: North America Market Value Share and BPS Analysis by End Use, 2025 and 2035
  • Figure 37: North America Market Y-o-Y Growth Comparison by End Use, 2025-2035
  • Figure 38: North America Market Attractiveness Analysis by End Use
  • Figure 39: Latin America Market Value Share and BPS Analysis by Country, 2025 and 2035
  • Figure 40: Latin America Market Value Share and BPS Analysis by Nature, 2025 and 2035
  • Figure 41: Latin America Market Y-o-Y Growth Comparison by Nature, 2025-2035
  • Figure 42: Latin America Market Attractiveness Analysis by Nature
  • Figure 43: Latin America Market Value Share and BPS Analysis by Application, 2025 and 2035
  • Figure 44: Latin America Market Y-o-Y Growth Comparison by Application, 2025-2035
  • Figure 45: Latin America Market Attractiveness Analysis by Application
  • Figure 46: Latin America Market Value Share and BPS Analysis by Grade, 2025 and 2035
  • Figure 47: Latin America Market Y-o-Y Growth Comparison by Grade, 2025-2035
  • Figure 48: Latin America Market Attractiveness Analysis by Grade
  • Figure 49: Latin America Market Value Share and BPS Analysis by End Use, 2025 and 2035
  • Figure 50: Latin America Market Y-o-Y Growth Comparison by End Use, 2025-2035
  • Figure 51: Latin America Market Attractiveness Analysis by End Use
  • Figure 52: Western Europe Market Value Share and BPS Analysis by Country, 2025 and 2035
  • Figure 53: Western Europe Market Value Share and BPS Analysis by Nature, 2025 and 2035
  • Figure 54: Western Europe Market Y-o-Y Growth Comparison by Nature, 2025-2035
  • Figure 55: Western Europe Market Attractiveness Analysis by Nature
  • Figure 56: Western Europe Market Value Share and BPS Analysis by Application, 2025 and 2035
  • Figure 57: Western Europe Market Y-o-Y Growth Comparison by Application, 2025-2035
  • Figure 58: Western Europe Market Attractiveness Analysis by Application
  • Figure 59: Western Europe Market Value Share and BPS Analysis by Grade, 2025 and 2035
  • Figure 60: Western Europe Market Y-o-Y Growth Comparison by Grade, 2025-2035
  • Figure 61: Western Europe Market Attractiveness Analysis by Grade
  • Figure 62: Western Europe Market Value Share and BPS Analysis by End Use, 2025 and 2035
  • Figure 63: Western Europe Market Y-o-Y Growth Comparison by End Use, 2025-2035
  • Figure 64: Western Europe Market Attractiveness Analysis by End Use
  • Figure 65: Eastern Europe Market Value Share and BPS Analysis by Country, 2025 and 2035
  • Figure 66: Eastern Europe Market Value Share and BPS Analysis by Nature, 2025 and 2035
  • Figure 67: Eastern Europe Market Y-o-Y Growth Comparison by Nature, 2025-2035
  • Figure 68: Eastern Europe Market Attractiveness Analysis by Nature
  • Figure 69: Eastern Europe Market Value Share and BPS Analysis by Application, 2025 and 2035
  • Figure 70: Eastern Europe Market Y-o-Y Growth Comparison by Application, 2025-2035
  • Figure 71: Eastern Europe Market Attractiveness Analysis by Application
  • Figure 72: Eastern Europe Market Value Share and BPS Analysis by Grade, 2025 and 2035
  • Figure 73: Eastern Europe Market Y-o-Y Growth Comparison by Grade, 2025-2035
  • Figure 74: Eastern Europe Market Attractiveness Analysis by Grade
  • Figure 75: Eastern Europe Market Value Share and BPS Analysis by End Use, 2025 and 2035
  • Figure 76: Eastern Europe Market Y-o-Y Growth Comparison by End Use, 2025-2035
  • Figure 77: Eastern Europe Market Attractiveness Analysis by End Use
  • Figure 78: East Asia Market Value Share and BPS Analysis by Country, 2025 and 2035
  • Figure 79: East Asia Market Value Share and BPS Analysis by Nature, 2025 and 2035
  • Figure 80: East Asia Market Y-o-Y Growth Comparison by Nature, 2025-2035
  • Figure 81: East Asia Market Attractiveness Analysis by Nature
  • Figure 82: East Asia Market Value Share and BPS Analysis by Application, 2025 and 2035
  • Figure 83: East Asia Market Y-o-Y Growth Comparison by Application, 2025-2035
  • Figure 84: East Asia Market Attractiveness Analysis by Application
  • Figure 85: East Asia Market Value Share and BPS Analysis by Grade, 2025 and 2035
  • Figure 86: East Asia Market Y-o-Y Growth Comparison by Grade, 2025-2035
  • Figure 87: East Asia Market Attractiveness Analysis by Grade
  • Figure 88: East Asia Market Value Share and BPS Analysis by End Use, 2025 and 2035
  • Figure 89: East Asia Market Y-o-Y Growth Comparison by End Use, 2025-2035
  • Figure 90: East Asia Market Attractiveness Analysis by End Use
  • Figure 91: South Asia & Pacific Market Value Share and BPS Analysis by Country, 2025 and 2035
  • Figure 92: South Asia & Pacific Market Value Share and BPS Analysis by Nature, 2025 and 2035
  • Figure 93: South Asia & Pacific Market Y-o-Y Growth Comparison by Nature, 2025-2035
  • Figure 94: South Asia & Pacific Market Attractiveness Analysis by Nature
  • Figure 95: South Asia & Pacific Market Value Share and BPS Analysis by Application, 2025 and 2035
  • Figure 96: South Asia & Pacific Market Y-o-Y Growth Comparison by Application, 2025-2035
  • Figure 97: South Asia & Pacific Market Attractiveness Analysis by Application
  • Figure 98: South Asia & Pacific Market Value Share and BPS Analysis by Grade, 2025 and 2035
  • Figure 99: South Asia & Pacific Market Y-o-Y Growth Comparison by Grade, 2025-2035
  • Figure 100: South Asia & Pacific Market Attractiveness Analysis by Grade
  • Figure 101: South Asia & Pacific Market Value Share and BPS Analysis by End Use, 2025 and 2035
  • Figure 102: South Asia & Pacific Market Y-o-Y Growth Comparison by End Use, 2025-2035
  • Figure 103: South Asia & Pacific Market Attractiveness Analysis by End Use
  • Figure 104: Middle East and Africa Market Value Share and BPS Analysis by Country, 2025 and 2035
  • Figure 105: Middle East and Africa Market Value Share and BPS Analysis by Nature, 2025 and 2035
  • Figure 106: Middle East and Africa Market Y-o-Y Growth Comparison by Nature, 2025-2035
  • Figure 107: Middle East and Africa Market Attractiveness Analysis by Nature
  • Figure 108: Middle East and Africa Market Value Share and BPS Analysis by Application, 2025 and 2035
  • Figure 109: Middle East and Africa Market Y-o-Y Growth Comparison by Application, 2025-2035
  • Figure 110: Middle East and Africa Market Attractiveness Analysis by Application
  • Figure 111: Middle East and Africa Market Value Share and BPS Analysis by Grade, 2025 and 2035
  • Figure 112: Middle East and Africa Market Y-o-Y Growth Comparison by Grade, 2025-2035
  • Figure 113: Middle East and Africa Market Attractiveness Analysis by Grade
  • Figure 114: Middle East and Africa Market Value Share and BPS Analysis by End Use, 2025 and 2035
  • Figure 115: Middle East and Africa Market Y-o-Y Growth Comparison by End Use, 2025-2035
  • Figure 116: Middle East and Africa Market Attractiveness Analysis by End Use
  • Figure 117: Global Market - Tier Structure Analysis
  • Figure 118: Global Market - Company Share Analysis

Frequently Asked Questions

What is the projected size of the pea starch market in 2025?

The market is valued at USD 147.1 million in 2025.

What is the outlook on pea starch demand by 2035?

The market is forecasted to reach USD 501.6 million by 2035, reflecting a CAGR of 13.1%.

Which segment leads the pea starch market by nature in 2025?

Conventional will lead the nature segment, accounting for 81.5% of the global market share in 2025.

Which grade segment dominates the pea starch market in 2025?

Food grade will dominate the grade segment with a 55% share in 2025.

Which country is projected to have the fastest-growing pea starch market?

The USA is projected to grow at the fastest rate, with a CAGR of 12.6% from 2025 to 2035.

Explore Similar Insights

Future Market Insights

Pea Starch Market